


NORTHEAST OHIO AREAWIDE COORDINATING AGENCY (NOACA), CLEVELAND, OHIO, USA
JASON J. BITTNER & DAVID K. HEIN, Applied Research Associates, Inc., USA & Canada
INTRODUCTION
In order to ensure that the condition of the roadway is adequate to maintain the usability, comfort, and safety of the travelling public, concession agreements usually include a set of conditions outlining the type and frequency of monitoring and the minimum acceptable levels of pavement performance. The ability to meet these criteria is an important part of the project and is outlined in the operations, maintenance, and rehabilitation plan.
The performance of pavements and their compliance to the project requirements can be measured in a variety of ways. Typical concession agreements focus on the components that most impact the safety and ride comfort level of pavement. The most common conditions identified in the concession agreements for highway projects include:
- International Roughness Index (IRI);
- Pavement Surface Distress;
- Rut Depth;
- Friction.
IRI has become the element of choice to reflect the ride comfort level of a pavement. IRI reflects the serviceability of the pavement, the ride comfort (Patterson), and even the amount of vehicle fuel consumption (Taylor). Typically, a maximum value of IRI is specified for a given section length (i.e. average IRI of 2.5 m/km for each 50 m length of a lane). In addition to a maximum IRI value, it is also becoming common for the concession agreements to also specify a given distribution of IRI values to ensure that the entire network is not maintained at only the minimum level of acceptability. A typical IRI profile cumulative distribution used in can be seen below (NBDOT).
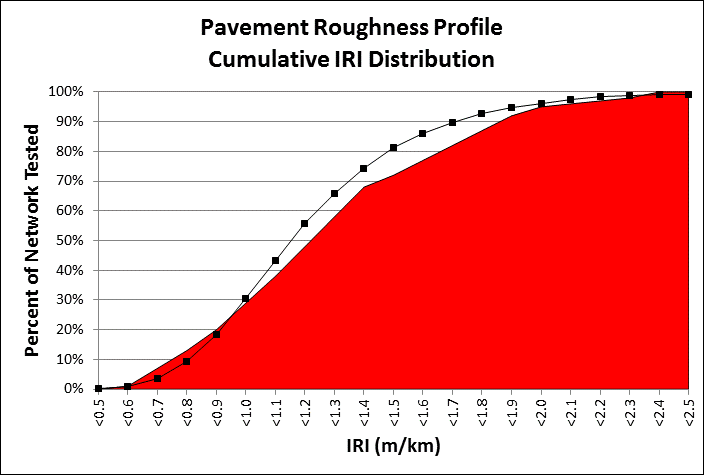
Figure 1.3.5.1: IRI profile cumulative distribution
A highway concession may have thousands of 50 m sections. The percent of 50 m sections in each “bin” of IRI range from 0.5 to 2.5 m/km. For example, the figure shows that 50 percent of the sections must have an IRI of less than 1.25 m/km. The curve in the figure shows that about 60 percent of the sections have an IRI of less than 1.25 m/km which is compliant, but the curve moves into the red (non-compliant zone) for number of sections requiring an IRI of less than 0.9 m/km.
OBJECTIVES
A unique component of some of the concession agreements is the use of key performance indicator distributions such as those shown in figure above. These distributions add a new level of complexity to the prediction and budgeting of rehabilitation activities.
Typical PMS software applications allow for a large variety of goals during the forecasting analysis. However, they are not designed to meet the dynamic needs of the distribution analysis. This has proven to be one of the more difficult aspects of performing long term forecasting (ie. 5 years). The most optimal plan for a concessionaire is to plan rehabilitation activities such that in conjunction with the deterioration of non-rehabilitated sections just meets the distribution of IRI in the following year. Traditional pavement performance models for IRI would be developed through an age versus IRI graph. The following figure shows the age versus IRI graph for a typical highway conditions with more than 5,000 pavement management sections each 50 m in length.
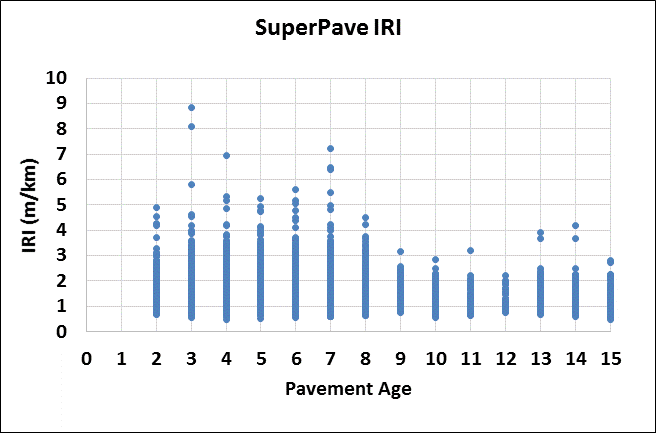
Figure 1.3.5.2: Age vs. IRI
Clearly, it is not possible to fit a traditional performance curve thought this IRI data. Ideally, the overall roadway condition should be hovering just over the distribution line. In order to change the distribution, it is important to understand that improving the condition of an individual section will alter the shape of the distribution of all section with better performance. This means that many minor preventative maintenance activities on the network, although the most cost-effective treatment for the pavement, will not significantly change the distribution. By locating the poor performing sections on the distributions and simulating the results of the repair, an estimate of distribution can be created to assess any other areas of the curve that many need to be adjusted. For areas that affect the performance at around the 50 percent mark of the distribution, localized cost-effective rehabilitation and maintenance alternatives can be used to change the shape and ensure overall compliance.
CHALLENGE
The nature of the requirements for IRI, is such that pavement sections exhibiting an IRI of greater than 2.5 mm/m are scheduled for rehabilitation each year. The rehabilitation action taken may be very localized to address a bump or settlement and as long as the IRI for the 50 m section is reduced to below 2.5 m/km, the section is in compliance with the project requirements. Predicting when an individual section may exceed the 2.5 mm/m limit is very difficult as “rough” pavement sections may appear very quickly.
SOLUTION
In order to develop an indication of the impact of the pavement maintenance and rehabilitation program on the distribution of IRI as compared to the concession IRI requirements, an analysis of the rate of change of IRI was completed. The average rate of change of IRI of 1.6 percent through the past 5 years was selected to represent the typical reduction in smoothness for sections that were not improved by maintenance or rehabilitation action. This average reduction in IRI was then applied to the all of the measured IRI for all 50 m sections that were not improved to determine the expected IRI for each section. For sections that were improved, the IRI values were “reset” and assigned to bins as shown in the following table. The bins are necessary because the result of maintenance to improve IRI will not result in the same IRI for all sections.
Table 1.3.5.1: IRI distribution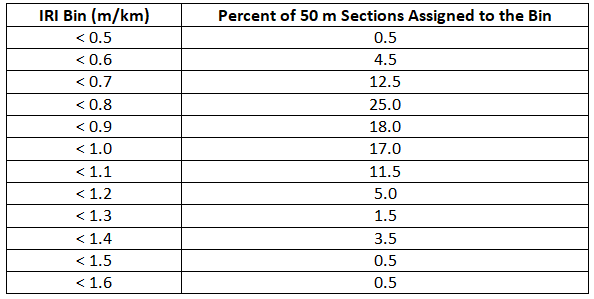
The percent of “improved” sections in each bin represents the expected improvement due to the rehabilitation action taken for pavement sections that exceeded an IRI value of 2.5 mm/m, i.e. 25 percent of sections were improved from an IRI of greater than 2.5 mm/m to less than 0.8 mm/m of roughness. The number of “improved” sections in each bin were then added back to the “deteriorated” IRI dataset based on the average deterioration of 1.6 percent per year to determine the new IRI cumulative distribution curve. The curve for 2018 is shown below.
A similar exercise was then completed for the next 5 years of the concession based on the maintenance and rehabilitation activities planned in the current 5-year plan and average annual rate of deterioration expected.
CONCLUSION
The cumulative distribution performance modeling described above permits the concessionaire to actively determine the impact of the current 5-year maintenance and rehabilitation plan on the cumulative distribution of IRI and to optimize their annual investments.
REFERENCES
Paterson, W.D.O. International Roughness Index: Relationship to Other Measures of Roughness and Riding Quality. In Transportation Research Record 1084, National Research Councel, Washington, D.C., 1987.
Taylor, G.W., and J.D. Patton. Effects of Pavement Structure on Vehicle Fuel Consumption – Phase III Report CSTT-HVC-TR-068. National Research Council of Canada, 2006.
New Brunswick Department of Transportation (NBDOT). OMR – Asset Management Requirements Trans Canada Highway Project Attachment 61. Fredericton, New Brunswick, 1998.