
The process and procedure of monitoring and reviewing the performance of asset management and the performance and/or condition of assets is presented in this chapter, which provides answers to the following questions:
Performance monitoring is the process of monitoring and reviewing the performance of asset management and the performance and/or condition of assets.
The performance framework discussed in section 1.4 creates a top-down connective thread from organizational direction and goals down to individual, day-to-day management activities (PIARC 2004). Similarly, the bottom-up monitoring of performance (asset characteristics, management systems problems, risks and opportunities) should provide the factual basis for adjusting and refining realistic asset management strategies and plans, through a process of continual improvement.
Therefore, the organization should establish, implement, and maintain processes and/or procedure(s) for the following:
This process is not intended to replace audit processes that may already be in place.
The performance monitoring process should cover the following areas (HMEP 2013, CSS & TAG 2004):
Strategic monitoring: To verify that outcomes are being met and asset management has been implemented and documented.
Performance measures and targets: To assess the effectiveness and efficiency of asset management.
System audits: To review and evaluate the effectiveness of asset management retrospectively (e.g., on an annual basis).
Compliance monitoring – To evaluate the organization’s compliance with applicable legal and absolute or regulatory requirements.
Performance Monitoring is the process and procedure of monitoring and reviewing the asset management framework
Frequency of monitoring should find the balance between the cost of collecting the monitoring data and information and the risks of not having the information available. Finding the balance is particularly important when considering compliance with statutory obligations and demonstrating value for money.
It is also important that the benefits from implementing asset management are captured and measured against those identified in the case for investment, or to support value for money initiatives or greater efficiency in delivery of the service. Recording and demonstrating the benefits may provide essential evidence for further investment. Demonstrating benefits is therefore a key success factor in the implementation of asset management and should form part of the monitoring process.
Monitoring and reporting performance (PIARC 2002) is an important part of demonstrating whether the organization is delivering the agreed levels of service (NAMS Group 2011).
The measurement of organizational performance provides the following:
Information and data arising from the implementation and delivery of asset management provide the following:
This information will also enable critical issues regarding performance to be identified and improvement plans to be developed.
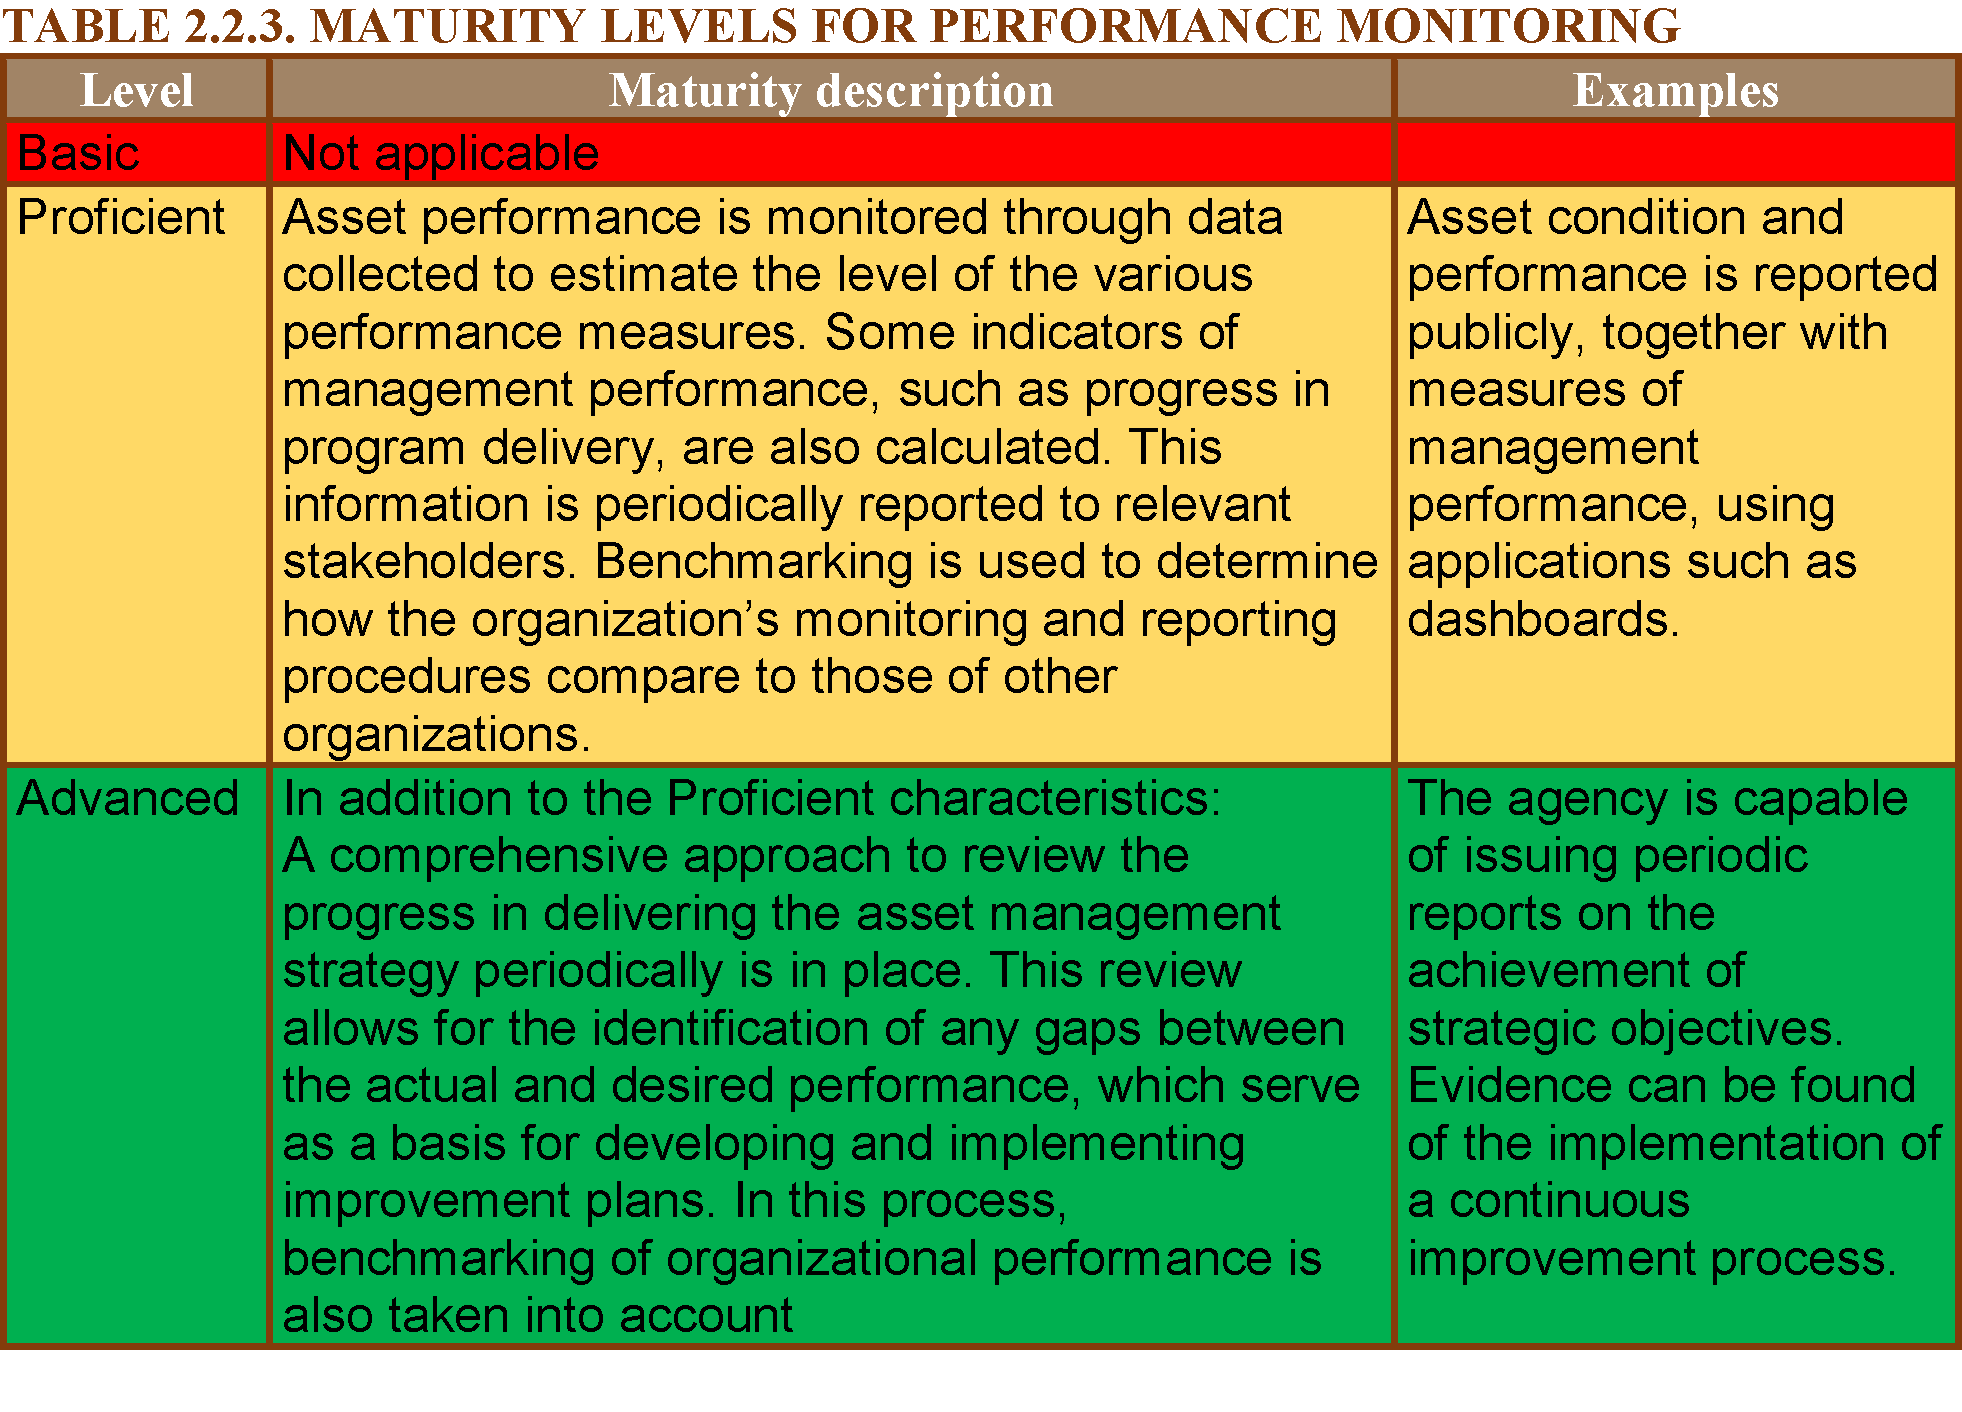
In terms of performance monitoring, Asset Management maturity levels can be defined as shown in table 2.2.3.
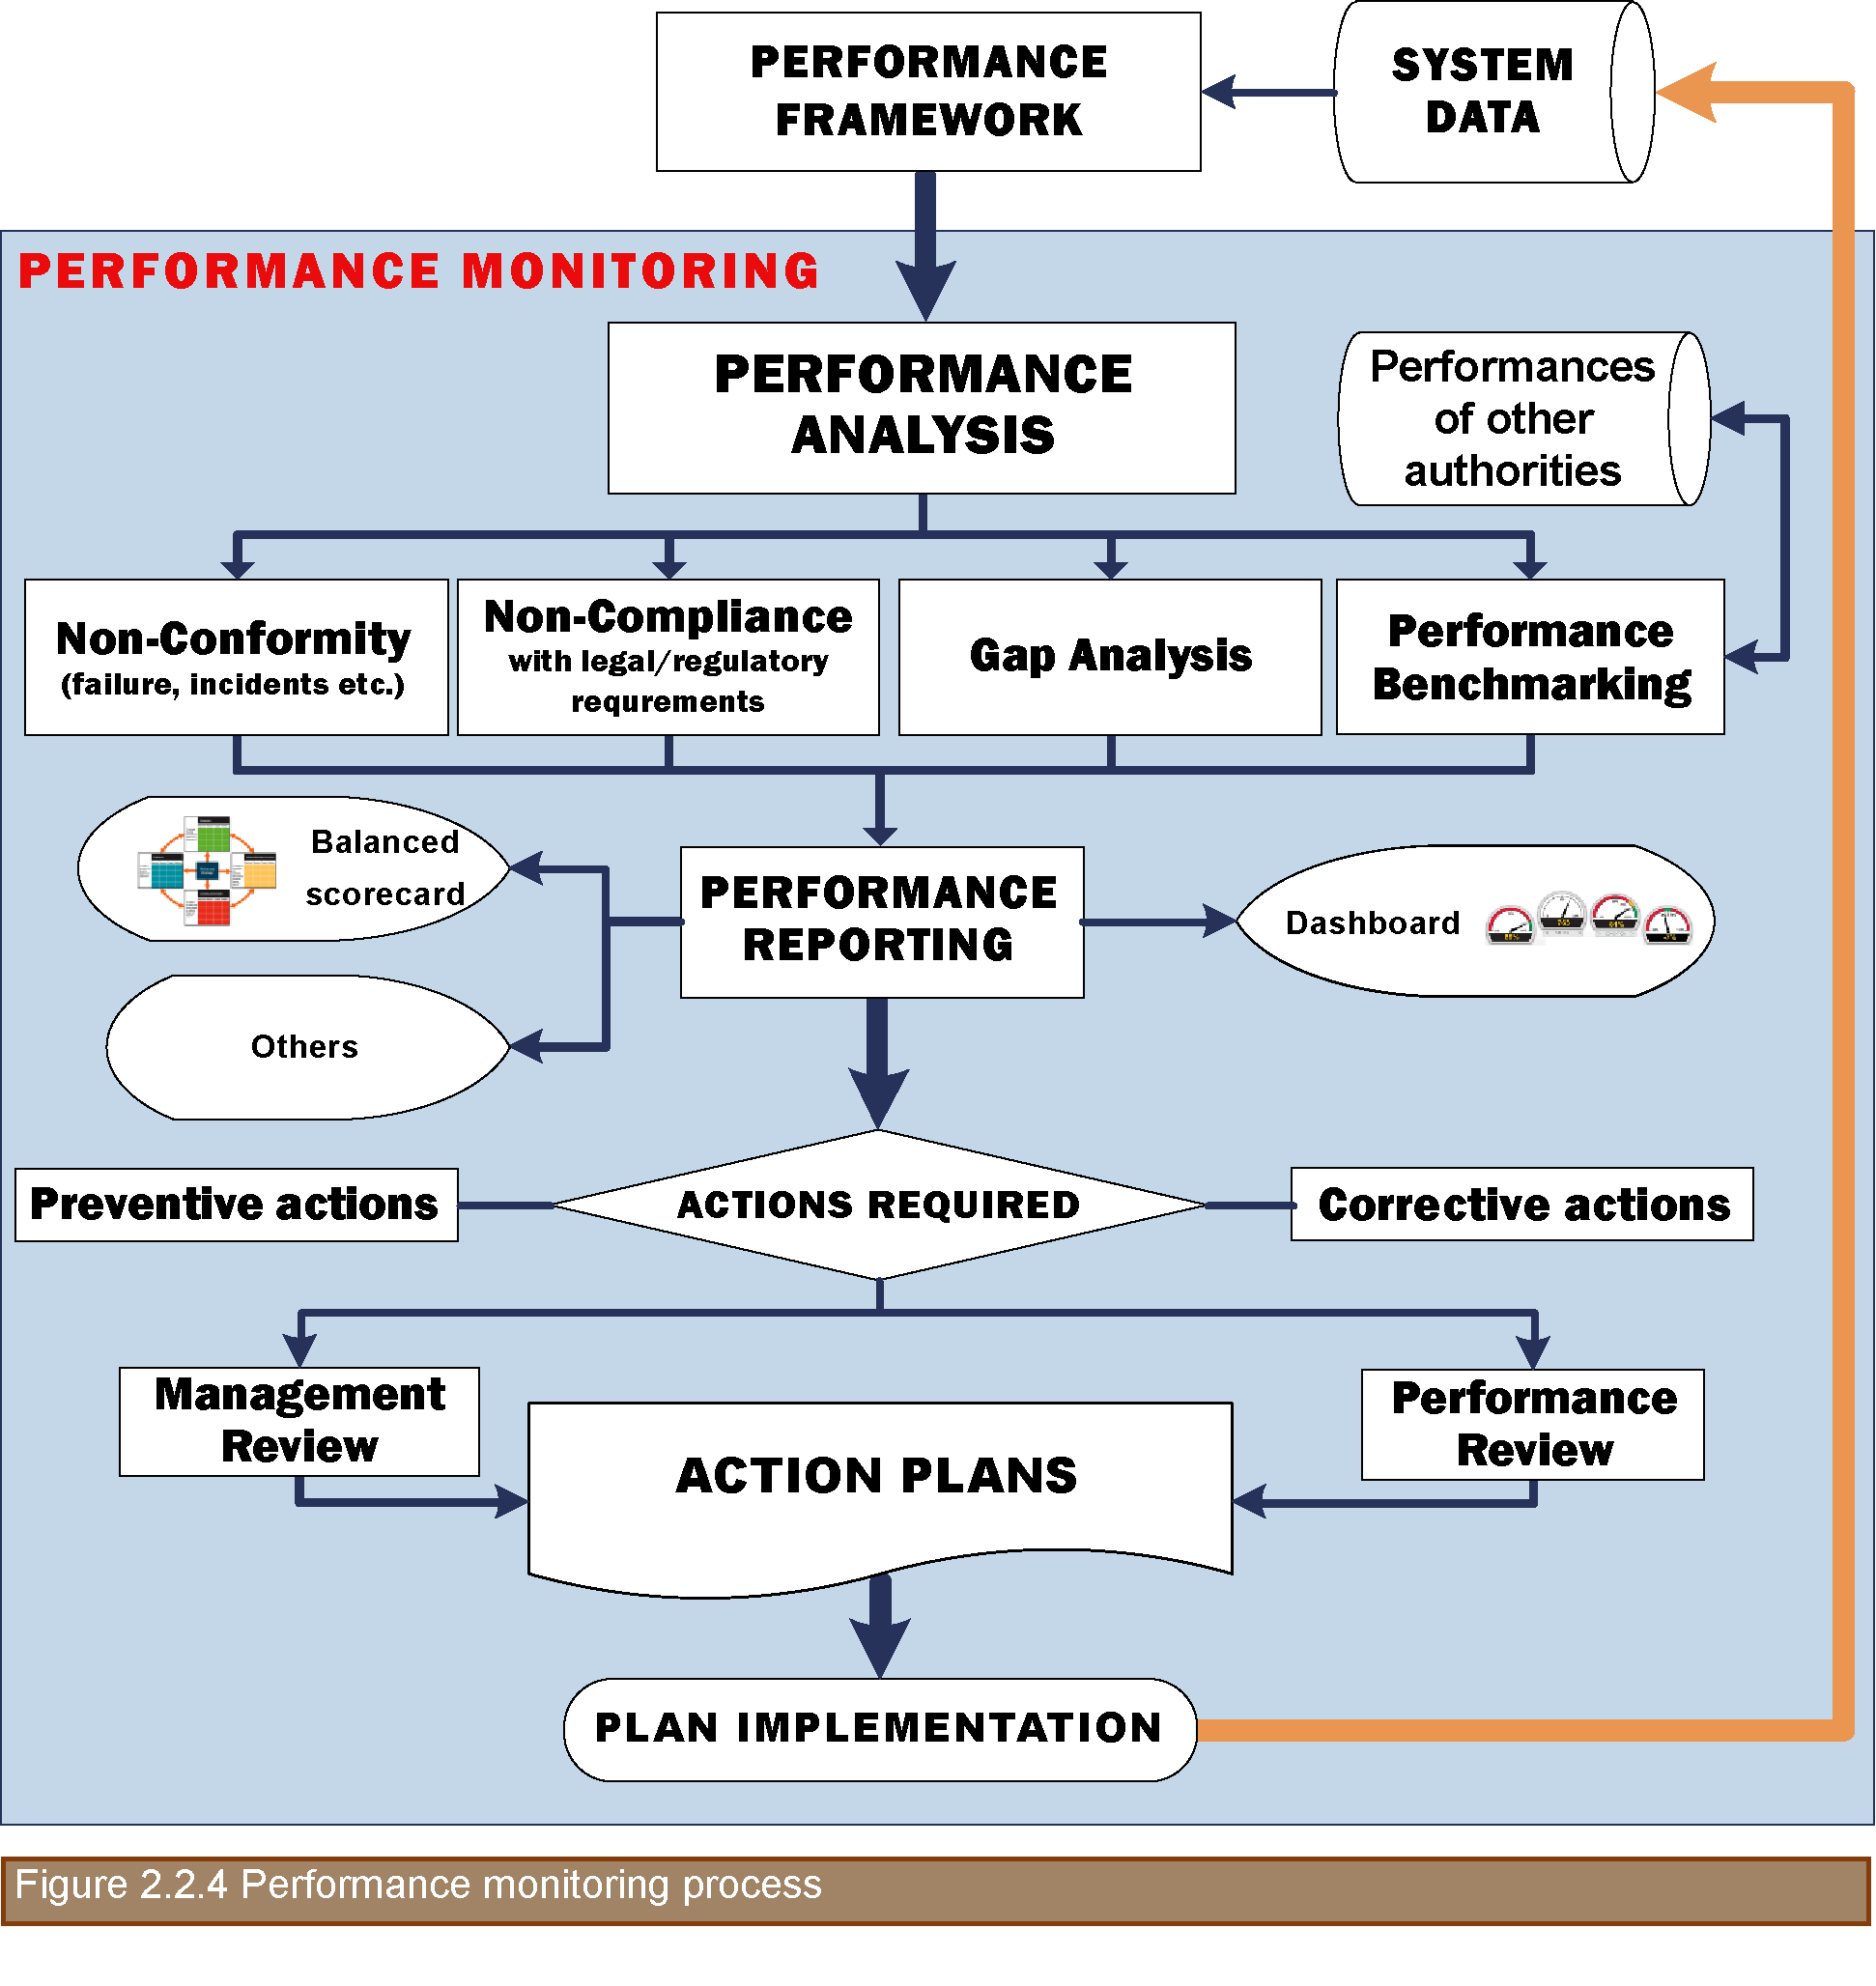
During the implementation of the asset management plan, the performance of the asset management plan and the performance and/or condition of assets and/or asset systems are assessed through collecting information and data (see section 2.1) and evaluating levels of service as defined in the performance framework (see section 1.4). Measuring current performance, which should be reported through various means, allows the organization to compare actual and expected performance by identifying any existing gaps. Gap analysis, in conjunction with performance reviews and benchmarking, are used in determining actions to be implemented if the current performance falls below the organization’s requirements or if ways to improve the efficacy and efficiency of the asset management approach are identified. The performance monitoring process is depicted in figure 2.2.4.
A performance gap in the monitoring process is the difference between the current performance of an asset and the expected performance reported in the management plan.
There are a number of ways in which performance measures can be summarized and reported. In deciding upon a reporting format, considerations should be given to the following:
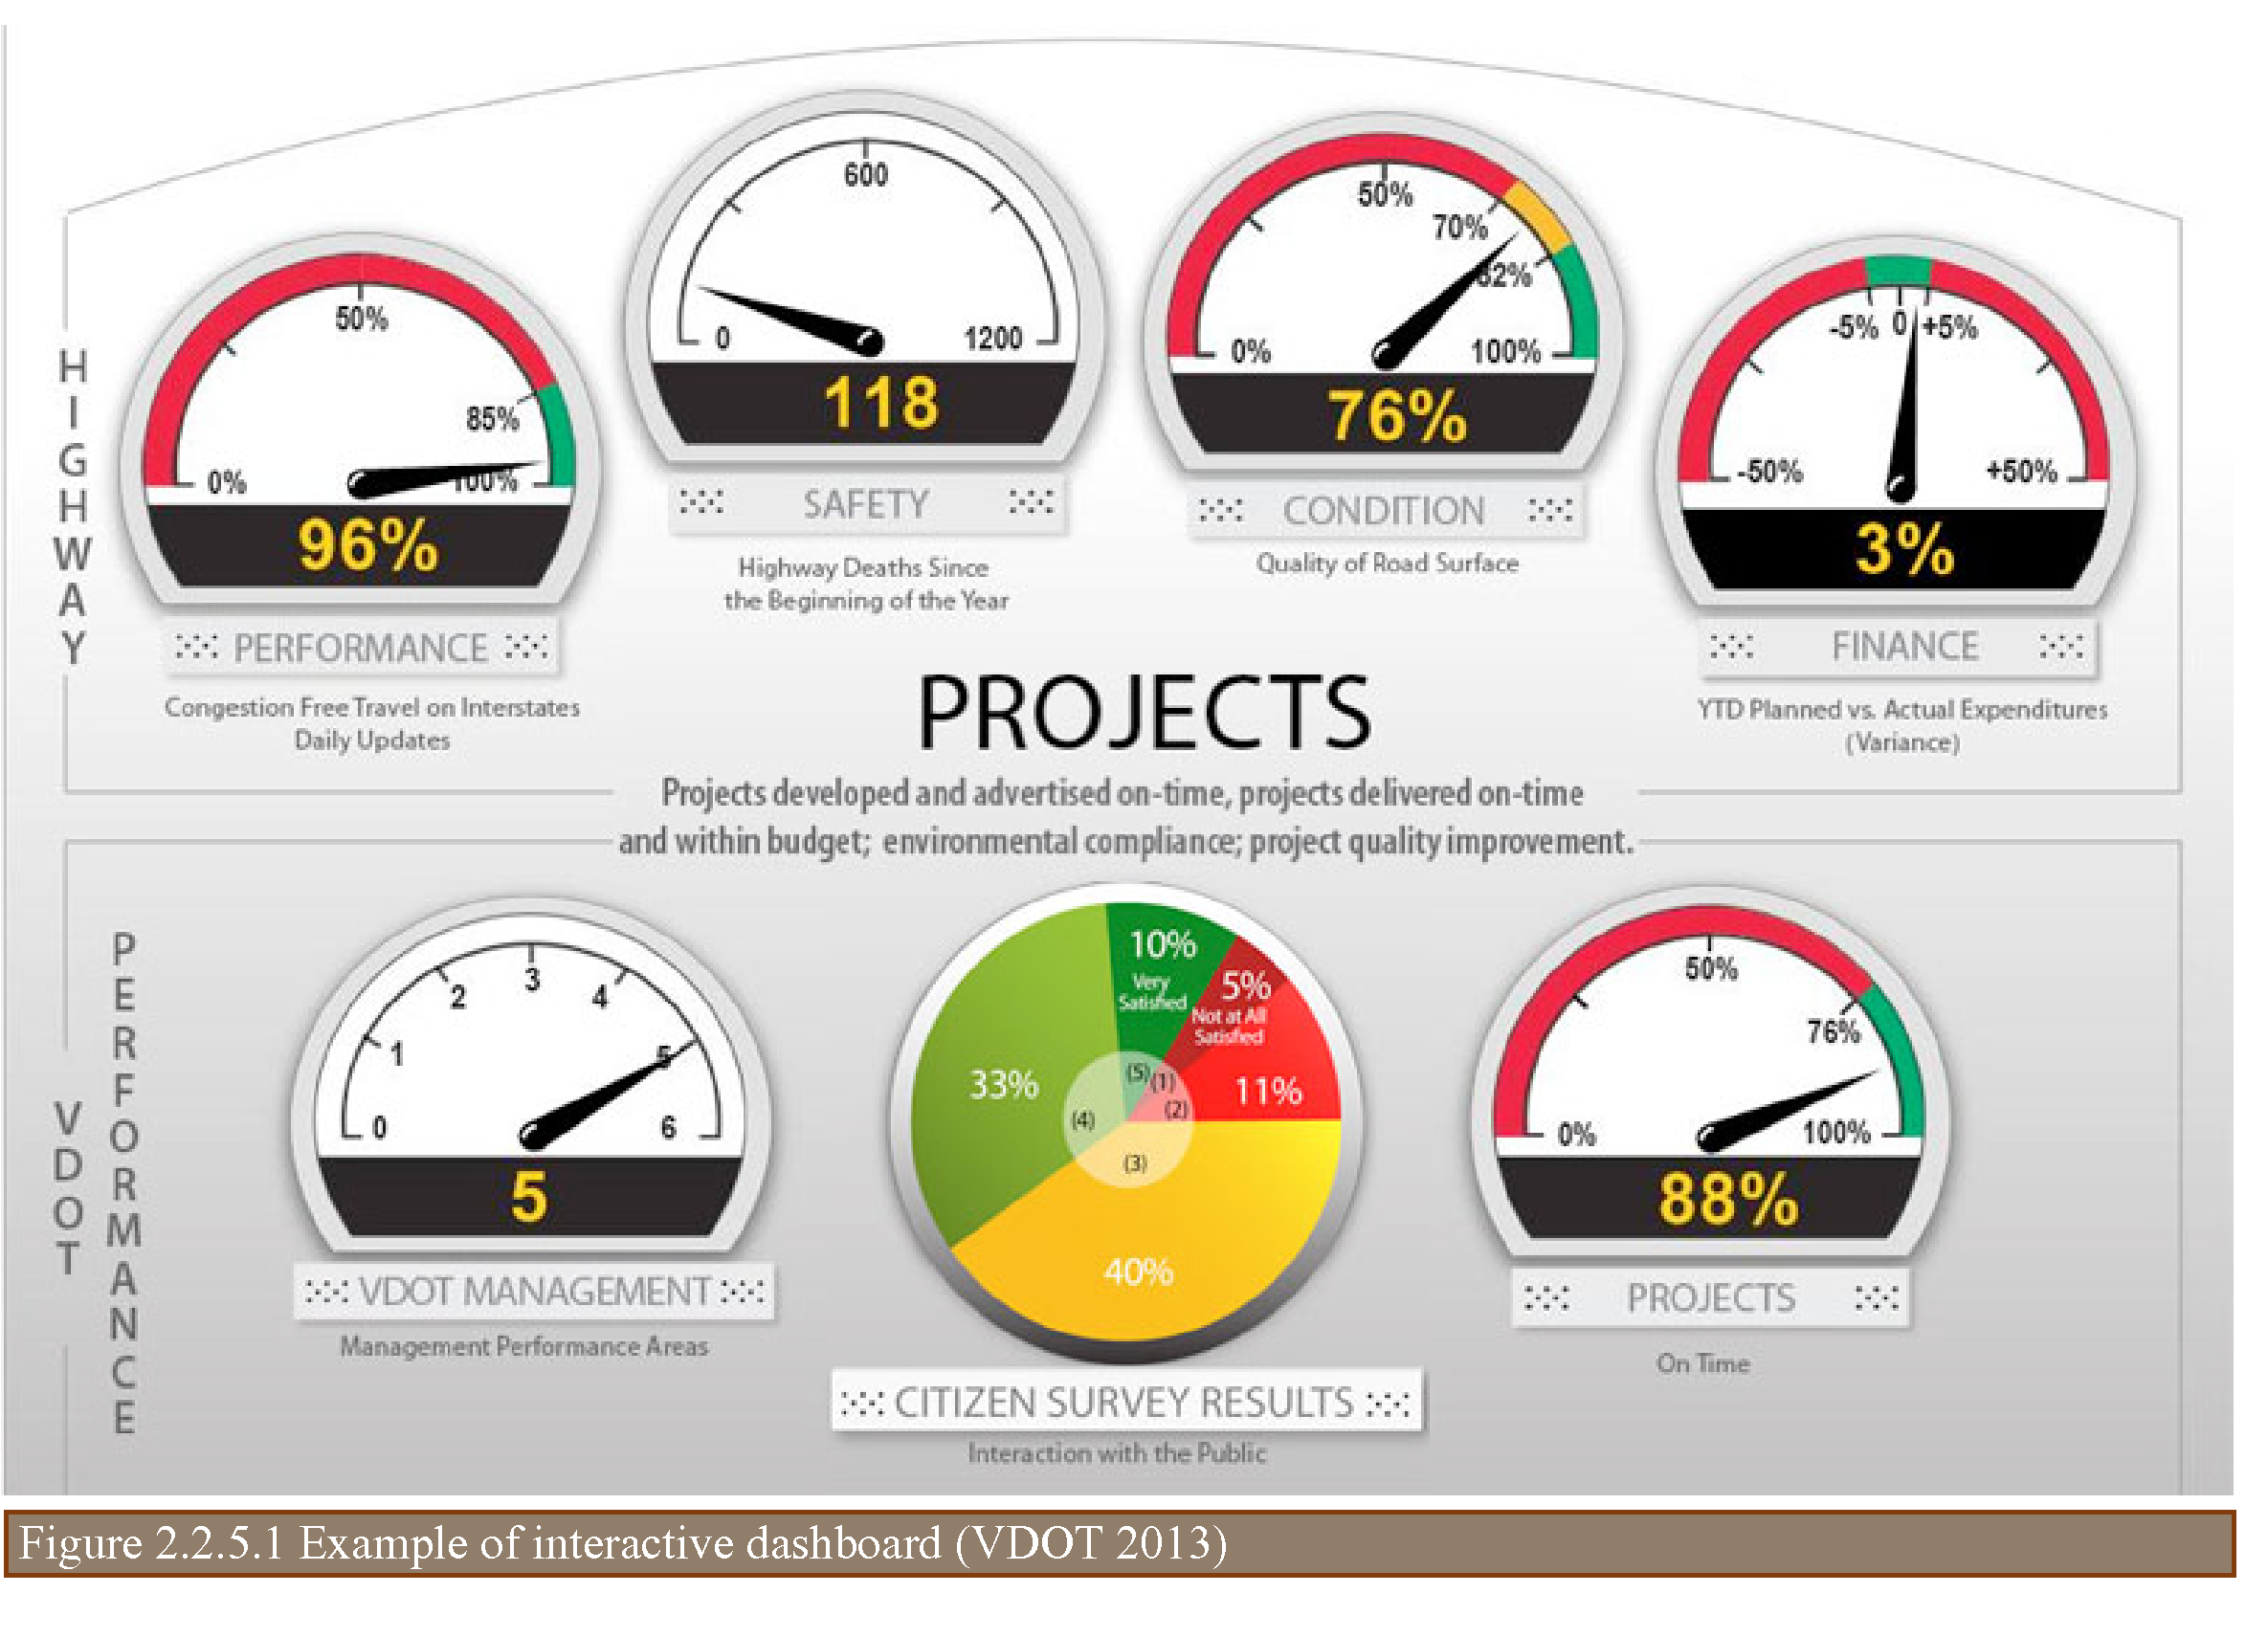
At present, there is an increasing demand for organizations to report not only financial and service outcomes, but also the social and environmental effects, and to demonstrate to stakeholders and political authorities that the organization is managing their social and environmental responsibilities (PIARC 2003). In this case, the balance scorecard and the dashboard approaches, described below, are appropriate as tools for demonstrating the level of attention given to each outcome area among competing demands.
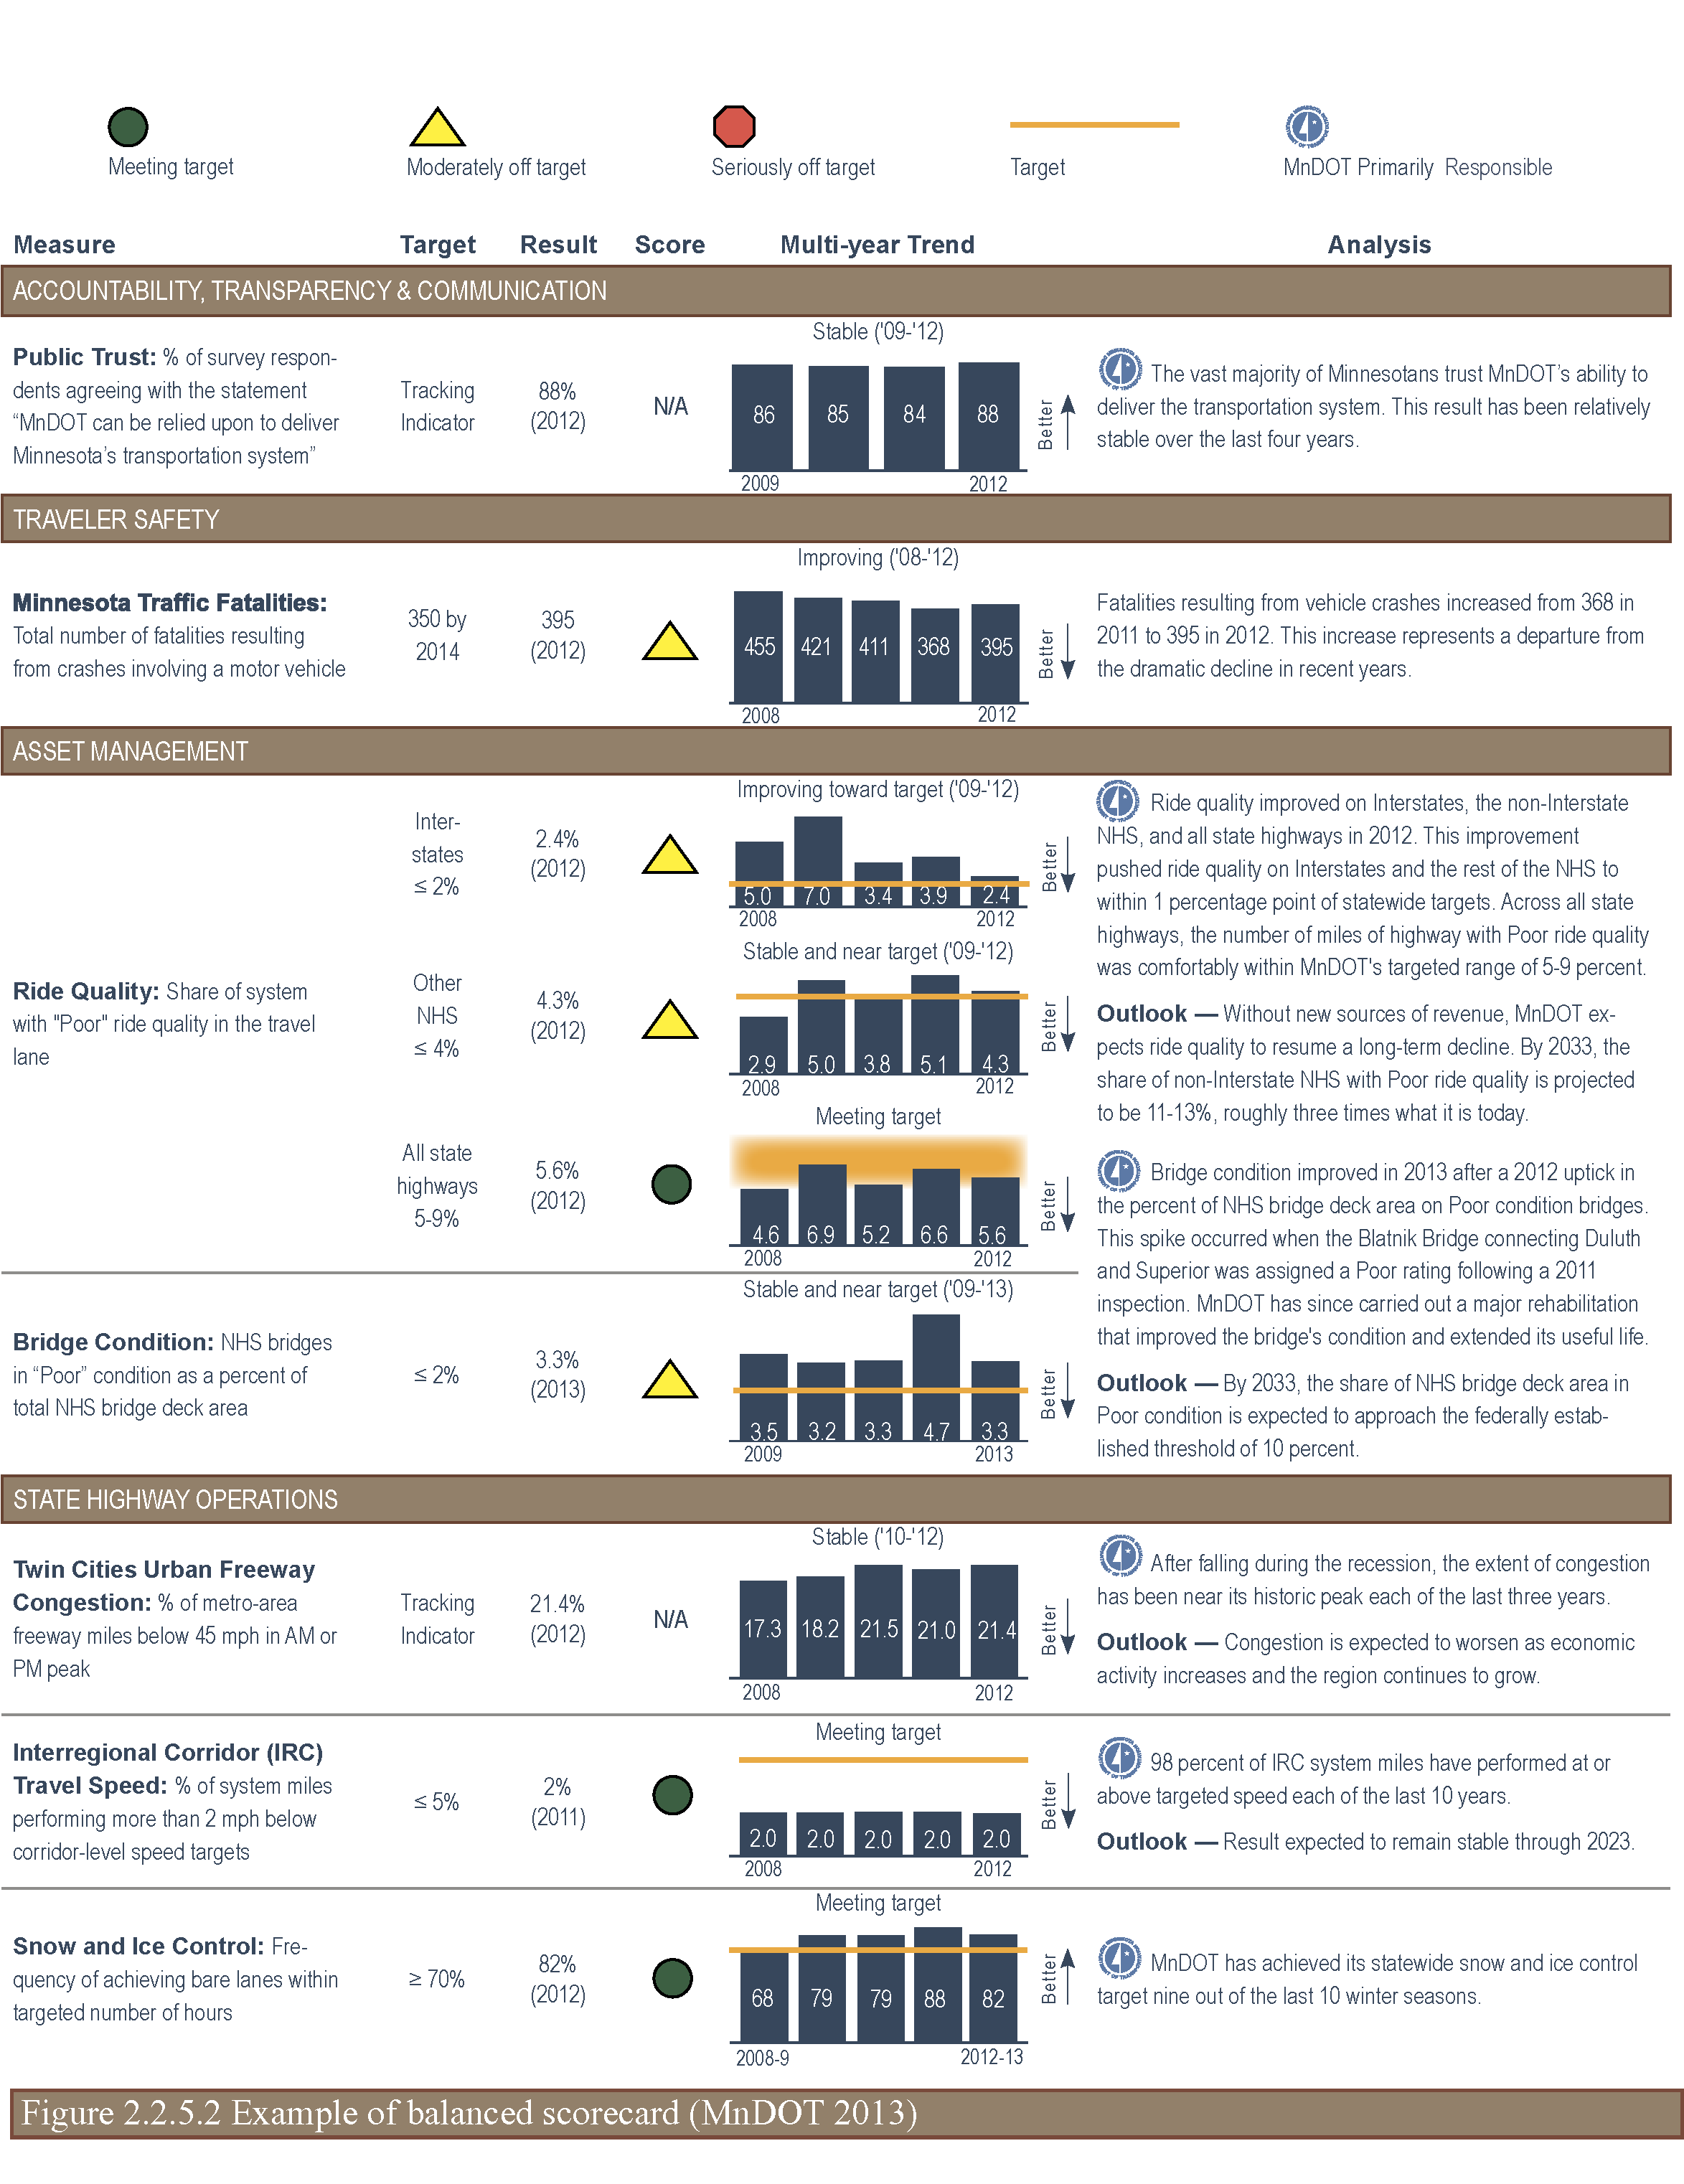
The balance scorecard and dashboard techniques use technical, non-technical, economic, and financial performance measures, normally less than 25, spread across two or more “themes” or “perspectives” (see examples in figures 2.2.5.1 and 2.2.5.2).
At the proficient level of service, performance measures related to the strategic objectives of the agency are normally reported at all organizational levels and to customers in an appropriate form (often via an annual report) (NAMS Group 2011).
As previously noted, performance monitoring is an element in a cycle structured to support a process of continuous audit and review of the plan and the processes used. Therefore, information from the performance monitoring and reporting processes should be used to review the asset management approach. Review activities may include the following:
The performance review involves the consideration of results, the factors contributing to performance, and options for dealing with substandard outcomes; it is carried out at regular intervals, usually on annual basis.
The management review involves an assessment of the need for changes to the asset management framework, including asset management policies, strategies and objectives (PIARC 2017). The outputs from the management review may include changes in policies, strategies, and objectives; performance requirements; resources; or other elements of the asset management approach. Some of these outputs may also generate changes in the organization’s strategic plan. Plans are normally reviewed and updated every three years because this time is considered long enough for the action indicated by the original plan to have taken effect.
The purpose of benchmarking is to compare the organization’s own asset management practices against those of a selection of similar organizations, but it is important that the comparison takes into account the organization’s overarching context and circumstances. Benchmarking should be seen as a positive and proactive process whereby an organization assesses how it performs activities in comparison to other organizations.
Four approaches to benchmarking may be considered, each of which provides a different perspective:
As a result of any of the reviews, organizations are likely to identify a series of desirable improvements they wish to put in place in order to advance their asset management practice. These improvements may be formally documented in an action plan. The plan should not only detail the specific actions to be taken, but also outline which levels of service the actions are intended to benefit. Furthermore, in developing the improvement plan, it is important that organizations be pragmatic about what can be delivered given the likely staff resources and budget.
Actions should be prioritized and placed into timeframes, and they can be classified as corrective or preventive, as follows:
County Surveyor’s Society (CSS) and Transport Analysis Guidance (TAG). 2004. Framework for Highway Asset Management. Last Accessed May 2015. http://www.ukroadsliaisongroup.org/en/utilities/document-summary.cfm?docid=9E4BA1A6-74B2-414B-81205FAC797615D1.
Minnesota Department of Transportation (MnDOT). 2013. Minnesota 2012 Transportation Results Scorecard. Last accessed July 27, 2015. www.dot.state.mn.us/measures/pdf/2012-scorecard.pdf.
New Zealand National Asset Management Support (NAMS) Group. 2011. International Infrastructure Management Manual. Wellington, New Zealand.
PIARC 2003. Evaluation of Transport Performance Measures for Cities, Technical Committee 10 – Urban Areas, ISBN: 2-94060-160-5 (https://www.piarc.org/ressources/publications/2/4422,TM10-14-VCD-e.pdf).
PIARC 2004. The framework for performance indicators, Comité technique 6 Gestion des Routes / Technical Committee 6 Road Management The Framework for Performance Indicators, PIARC Paris France 2004, ISBN 2-84060-165-6 (https://www.piarc.org/en/order-library/13485-en-The%20Framework%20for%20Performance%20Indicators.htm).
PIARC 2008. Integration of Performance Indicators, Technical Committee 4.1 – Management of Road Infrastructure Assets, ISBN: 2-84060-206-7 (https://www.piarc.org/ressources/publications/4/5905,2008R06.pdf).
PIARC 2017. Management of road assets: Balancing of environmental and engineering aspects in management of road networks, : Comité technique 4.1 Gestion du patrimoine routier / Technical Committee 4.1 Management of Road Infrastructure Assets, PIARC Paris France 2017, ISBN 978-2-84060-455-6 (https://www.piarc.org/ressources/publications/9/27317,2017R05EN.pdf)
United Kingdom Roads Liaison Group (UKRLG) and Highways Maintenance Efficiency Programme (HMEP). 2013. Highway Infrastructure Asset Management Guidance Document. Department for Transport, London. http://www.ukroadsliaisongroup.org/en/utilities/document-summary.cfm?docid=5C49F48E-1CE0-477F-933ACBFA169AF8CB.
Virginia Department of Transportation (VDOT). DASHBOARD: Performance Reporting System for Projects and Programs. Virginia Department of Transportation. http://dashboard.virginiadot.org. Accessed May 2015.
DAVID K. HEIN, Applied Research Associates, Inc., Canada
In order to ensure that the condition of the roadway is adequate to maintain the usability, comfort, and safety of the travelling public, concession agreements usually include a set of conditions outlining the type and frequency of monitoring and the minimum acceptable levels of pavement performance. The ability to meet these criteria is an important part of the project and is outlined in the operations, maintenance, and rehabilitation plan.
The performance of pavements and their compliance to the project requirements can be measured in a variety of ways. Typical concession agreements focus on the components that most impact the safety and ride comfort level of pavement. The most common conditions identified in the concession agreements for highway projects include:
IRI has become the element of choice to reflect the ride comfort level of a pavement. IRI reflects the serviceability of the pavement, the ride comfort (Patterson), and even the amount of vehicle fuel consumption (Taylor). Typically, a maximum value of IRI is specified for a given section length (i.e. average IRI of 2.5 m/km for each 50 m length of a lane). In addition to a maximum IRI value, it is also becoming common for the concession agreements to also specify a given distribution of IRI values to ensure that the entire network is not maintained at only the minimum level of acceptability. A typical IRI profile cumulative distribution used in can be seen below (NBDOT).
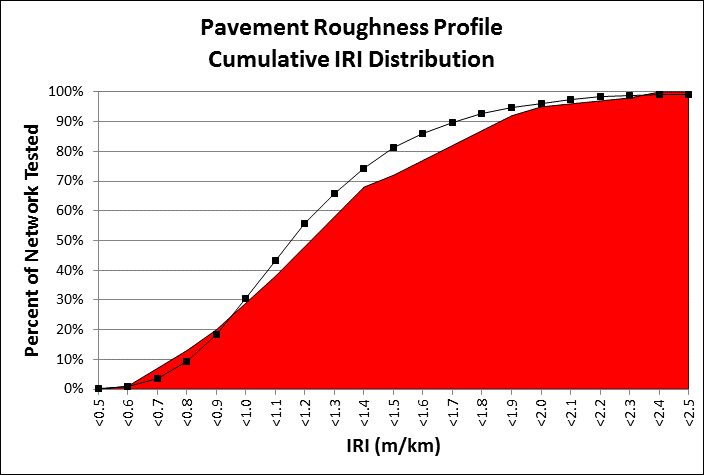
A highway concession may have thousands of 50 m sections. The percent of 50 m sections in each “bin” of IRI range from 0.5 to 2.5 m/km. For example, the figure shows that 50 percent of the sections must have an IRI of less than 1.25 m/km. The curve in the figure shows that about 60 percent of the sections have an IRI of less than 1.25 m/km which is compliant, but the curve moves into the red (non-compliant zone) for number of sections requiring an IRI of less than 0.9 m/km.
OBJECTIVES
A unique component of some of the concession agreements is the use of key performance indicator distributions such as those shown in figure above. These distributions add a new level of complexity to the prediction and budgeting of rehabilitation activities.
Typical PMS software applications allow for a large variety of goals during the forecasting analysis. However, they are not designed to meet the dynamic needs of the distribution analysis. This has proven to be one of the more difficult aspects of performing long term forecasting (ie. 5 years). The most optimal plan for a concessionaire is to plan rehabilitation activities such that in conjunction with the deterioration of non-rehabilitated sections just meets the distribution of IRI in the following year. Traditional pavement performace models for IRI would be developed through an age versus IRI graph. The following figure shows the age versus IRI graph for a typcial highway conditions with more than 5,000 pavement management sections each 50 m in length.
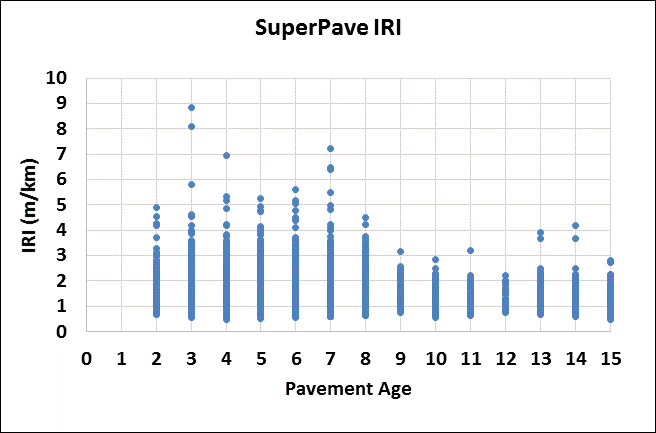
Clearly, it is not possible to fit a traditional performance curve thought this IRI data. Ideally, the overall roadway condition should be hovering just over the distribution line. In order to change the distribution, it is important to understand that improving the condition of an individual section will alter the shape of the distribution of all section with better performance. The means that many minor preventative maintenance activities on the network, although the most cost-effective treatment for the pavement, will not significantly change the distribution. By locating the poor performing sections on the distributions and simulating the results of the repair, an estimate of distribution can be created to assess any other areas of the curve that many need to be adjusted. For areas that affect the performance at around the 50 percent mark of the distribution, localized cost-effective rehabilitation and maintenance alternatives can be used to change the shape and ensure overall compliance.
The nature of the requirements for IRI, is such that pavement sections exhibiting an IRI of greater than 2.5 mm/m are scheduled for rehabilitation each year. The rehabilitation action taken may be very localized to address a bump or settlement and as long as the IRI for the 50 m section is reduced to below 2.5 m/km, the section is in compliance with the project requirements. Predicting when an individual section may exceed the 2.5 mm/m limit is very difficult as “rough” pavement sections may appear very quickly.
In order to develop an indication of the impact of the pavement maintenance and rehabilitation program on the distribution of IRI as compared to the concession IRI requirements, an analysis of the rate of change of IRI was completed. The average rate of change of IRI of 1.6 percent through the past 5 years was selected to represent the typical reduction in smoothness for sections that were not improved by maintenance or rehabilitation action. This average reduction in IRI was then applied to the all of the measured IRI for all 50 m sections that were not improved to determine the expected IRI for each section. For sections that were improved, the IRI values were “reset” and assigned to bins as shown in the following table. The bins are necessary because the result of maintenance to improve IRI will not result in the same IRI for all sections.
TABLE 2.2.10.1: IRI distribution
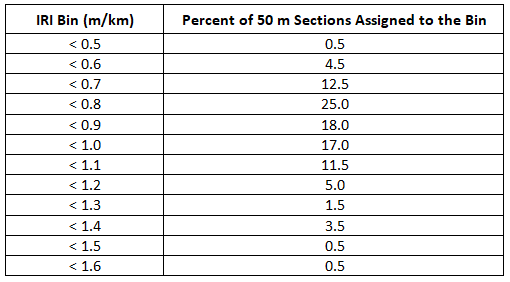
The percent of “improved” sections in each bin represents the expected improvement due to the rehabilitation action taken for pavement sections that exceeded an IRI value of 2.5 mm/m, i.e. 25 percent of sections were improved from an IRI of greater than 2.5 mm/m to less than 0.8 mm/m of roughness. The number of “improved” sections in each bin were then added back to the “deteriorated” IRI dataset based on the average deterioration of 1.6 percent per year to determine the new IRI cumulative distribution curve. The curve for 2018 is shown below.
A similar exercise was then completed for the next 5 years of the concession based on the maintenance and rehabilitation activities planned in the current 5-year plan and average annual rate of deterioration expected.
The cumulative distribution performance modeling described above permits the concessionaire to actively determine the impact of the current 5-year maintenance and rehabilitation plan on the cumulative distribution of IRI and to optimize their annual investments.
Paterson, W.D.O. International Roughness Index: Relationship to Other Measures of Roughness and Riding Quality. In Transportation Research Record 1084, National Research Councel, Washington, D.C., 1987.
Taylor, G.W., and J.D. Patton. Effects of Pavement Structure on Vehicle Fuel Consumption – Phase III Report CSTT-HVC-TR-068. National Research Council of Canada, 2006.
New Brunswick Department of Transportation (NBDOT). OMR – Asset Management Requirements Trans Canada Highway Project Attachment 61. Fredericton, New Brunswick, 1998.