
The asset management strategy, introduced in chapter 1.3, links organizational goals and objectives with actions needed to manage its highway infrastructure assets. Performance measures and levels of service (target values negotiated with stakeholders) should be established to make the strategy operational.
Therefore, the organization shall establish, implement and maintain process(es) and/or procedure(s) to monitor and measure the performance and/or condition of assets.
This chapter sets out the process(es) and/or procedure(s) for:
The process(es) and/or procedure(s) for monitoring the overall effectiveness and efficiency of the asset management system are dealt with in section 2.2.
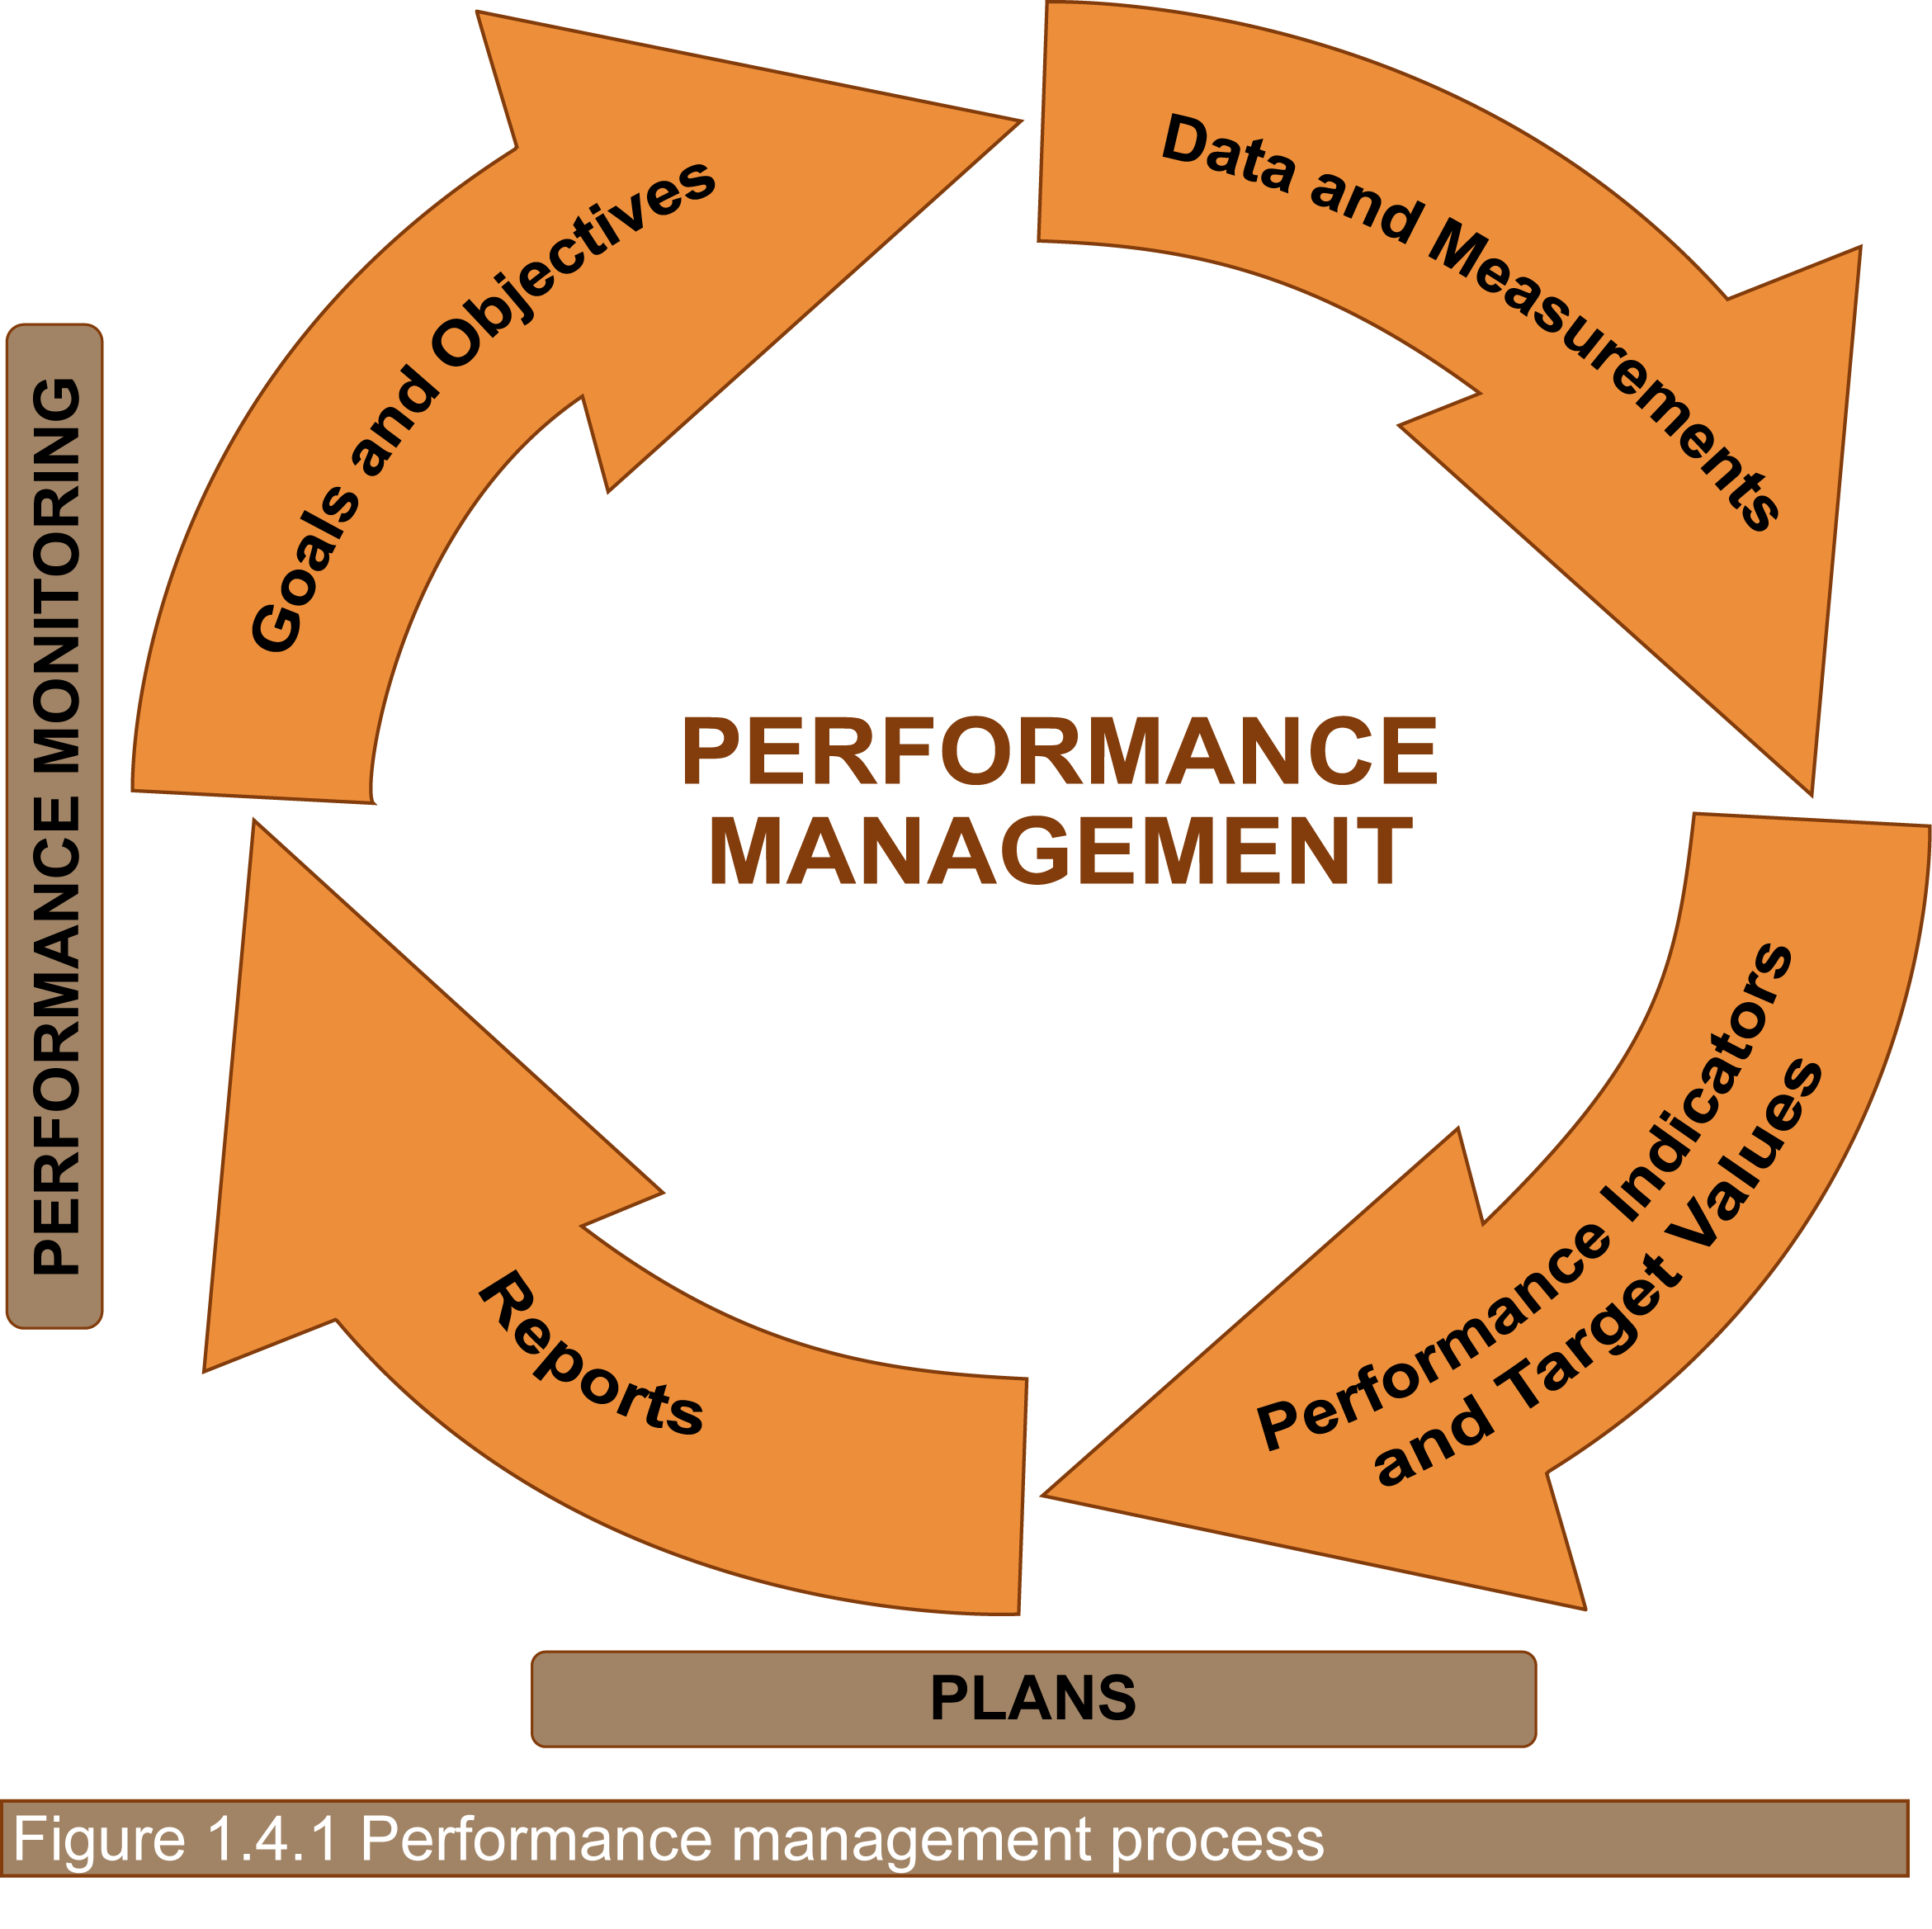
Performance management refers to a systematic process for evaluating the ability of road assets to provide the required level of service. This process should be applied to a road network rather than to individual assets.
Goals and objectives, essential for managing the highway infrastructure asset, are defined in terms of levels of service. In order to evaluate these levels of service target values of performance indicators, also called performance measures, have to be used.
Therefore, road organizations establish, implement and maintain process(es) and/or procedure(s) to measure the performance of the assets they are responsible for, and to monitor progress toward a result or goal (see figure 1.4.1, PIARC 2012, PAS55 and ISO 55000).
Performance management is functional to the achievement of the following objectives:
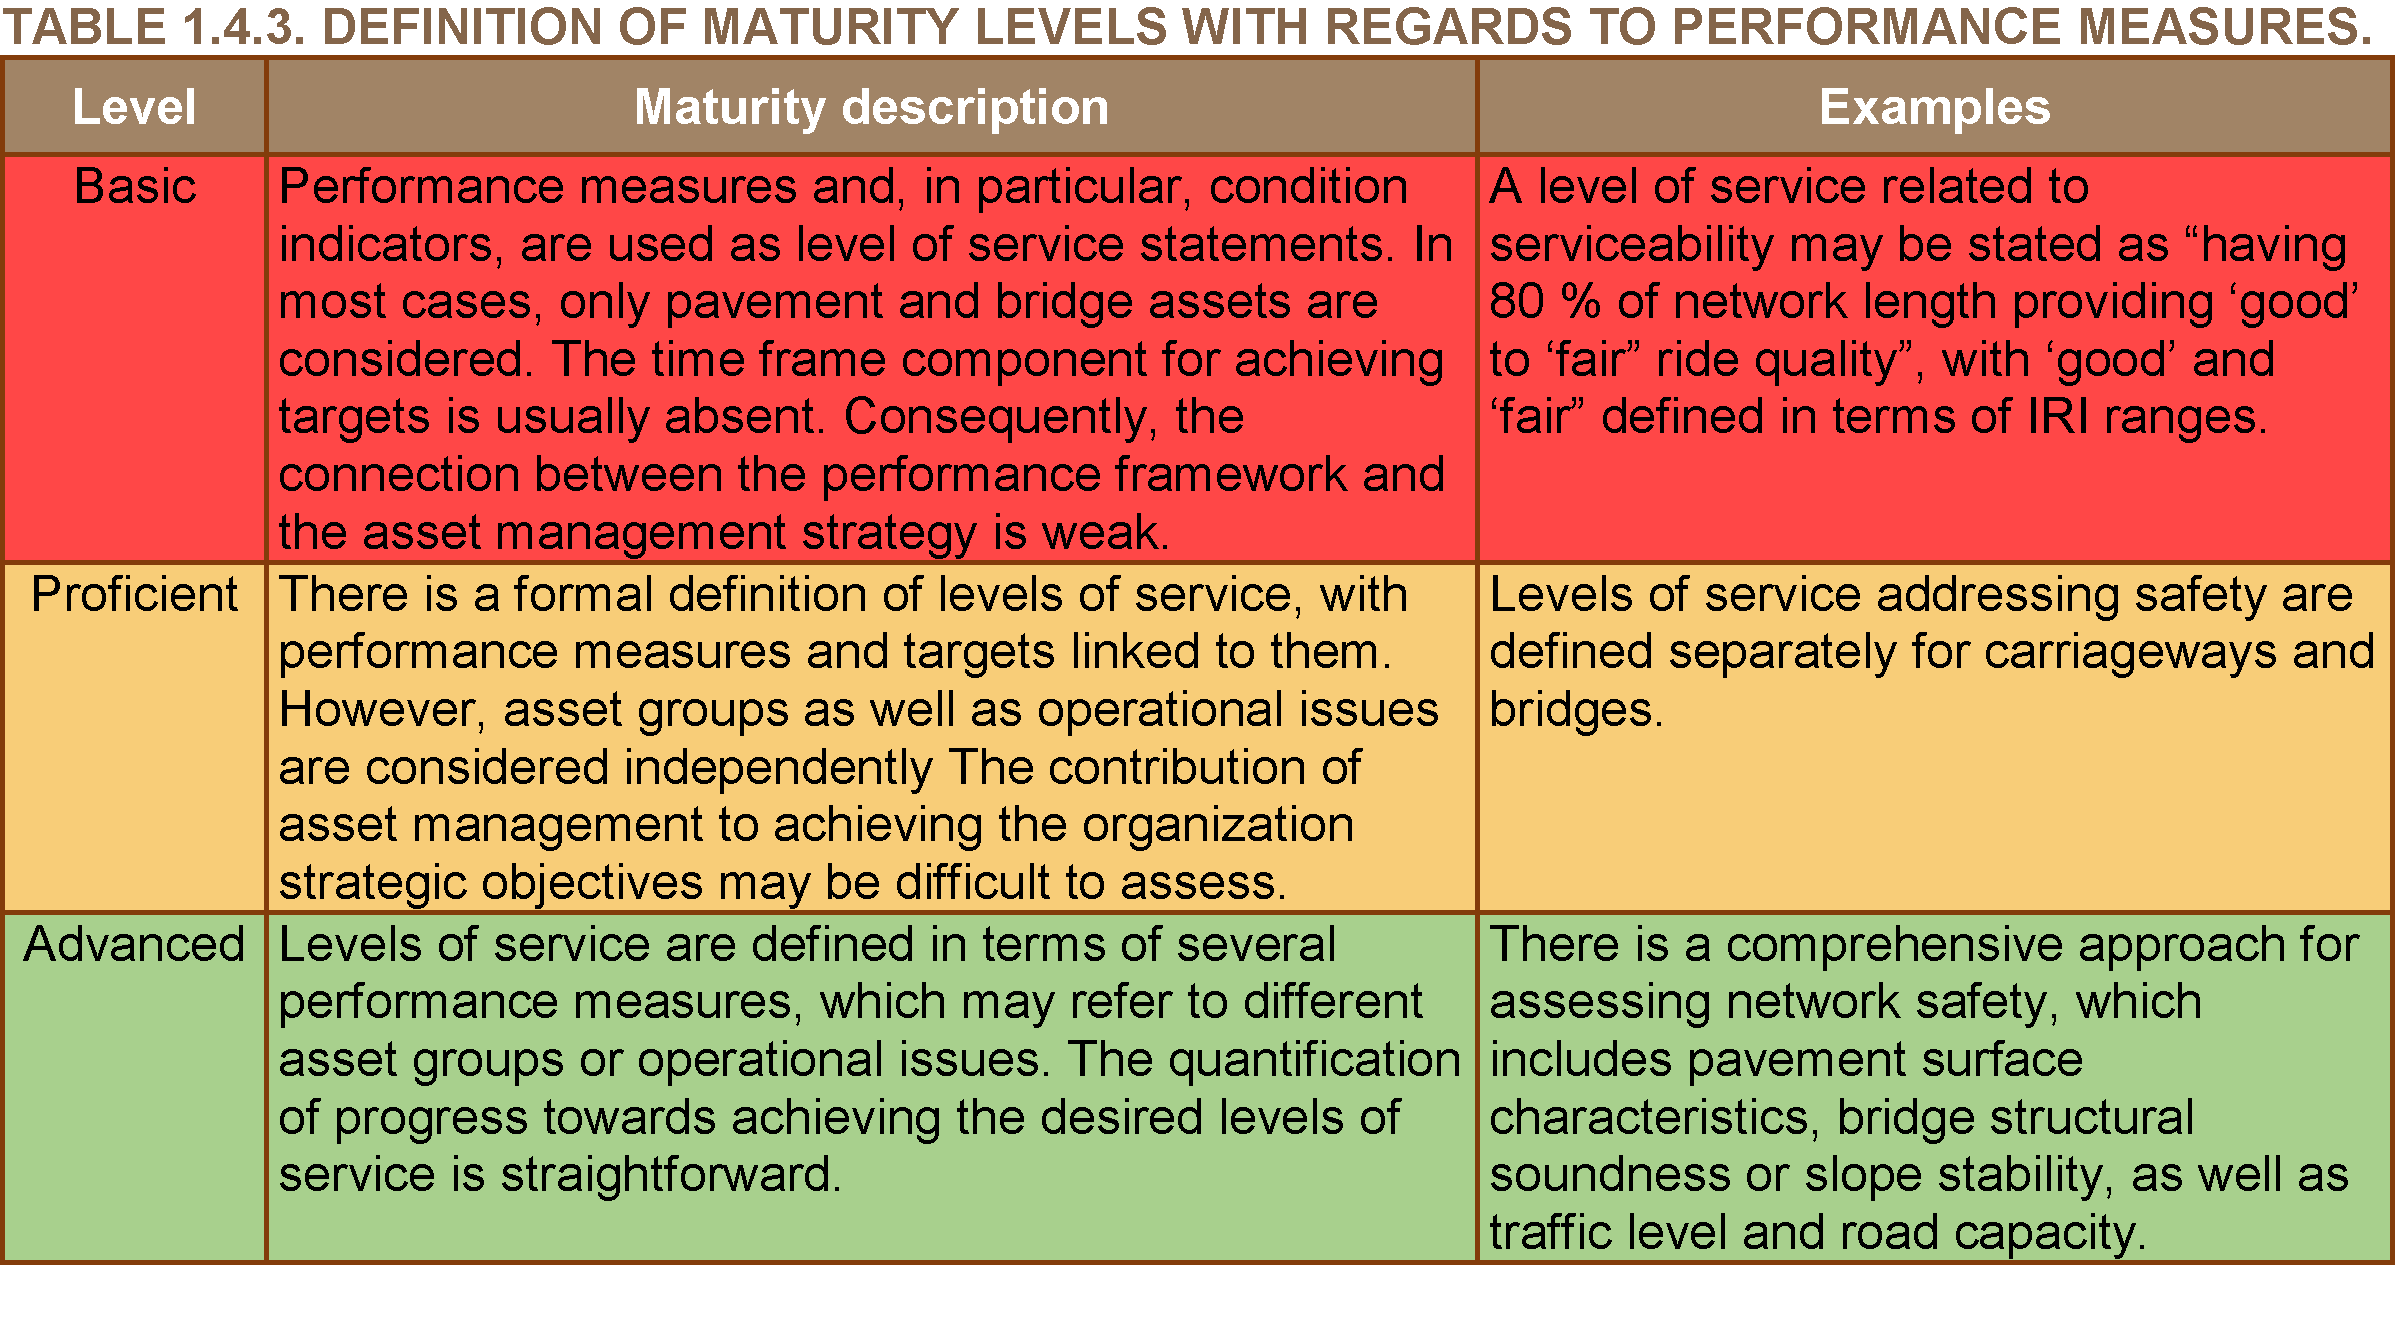
The maturity levels for authorities/agencies with regards to performance management can be defined as shown in table 1.4.3.
Setting a framework for performance management involves expressing the long term corporate goals and objectives of the road organization in terms of the desired levels of service, and linking these with performance measures and targets that allow the organization to monitor progress in achieving the intended results (PIARC 2004). Therefore, the main components of a performance management framework are: levels of service, performance measures and performance targets (see figure 1.4.4).
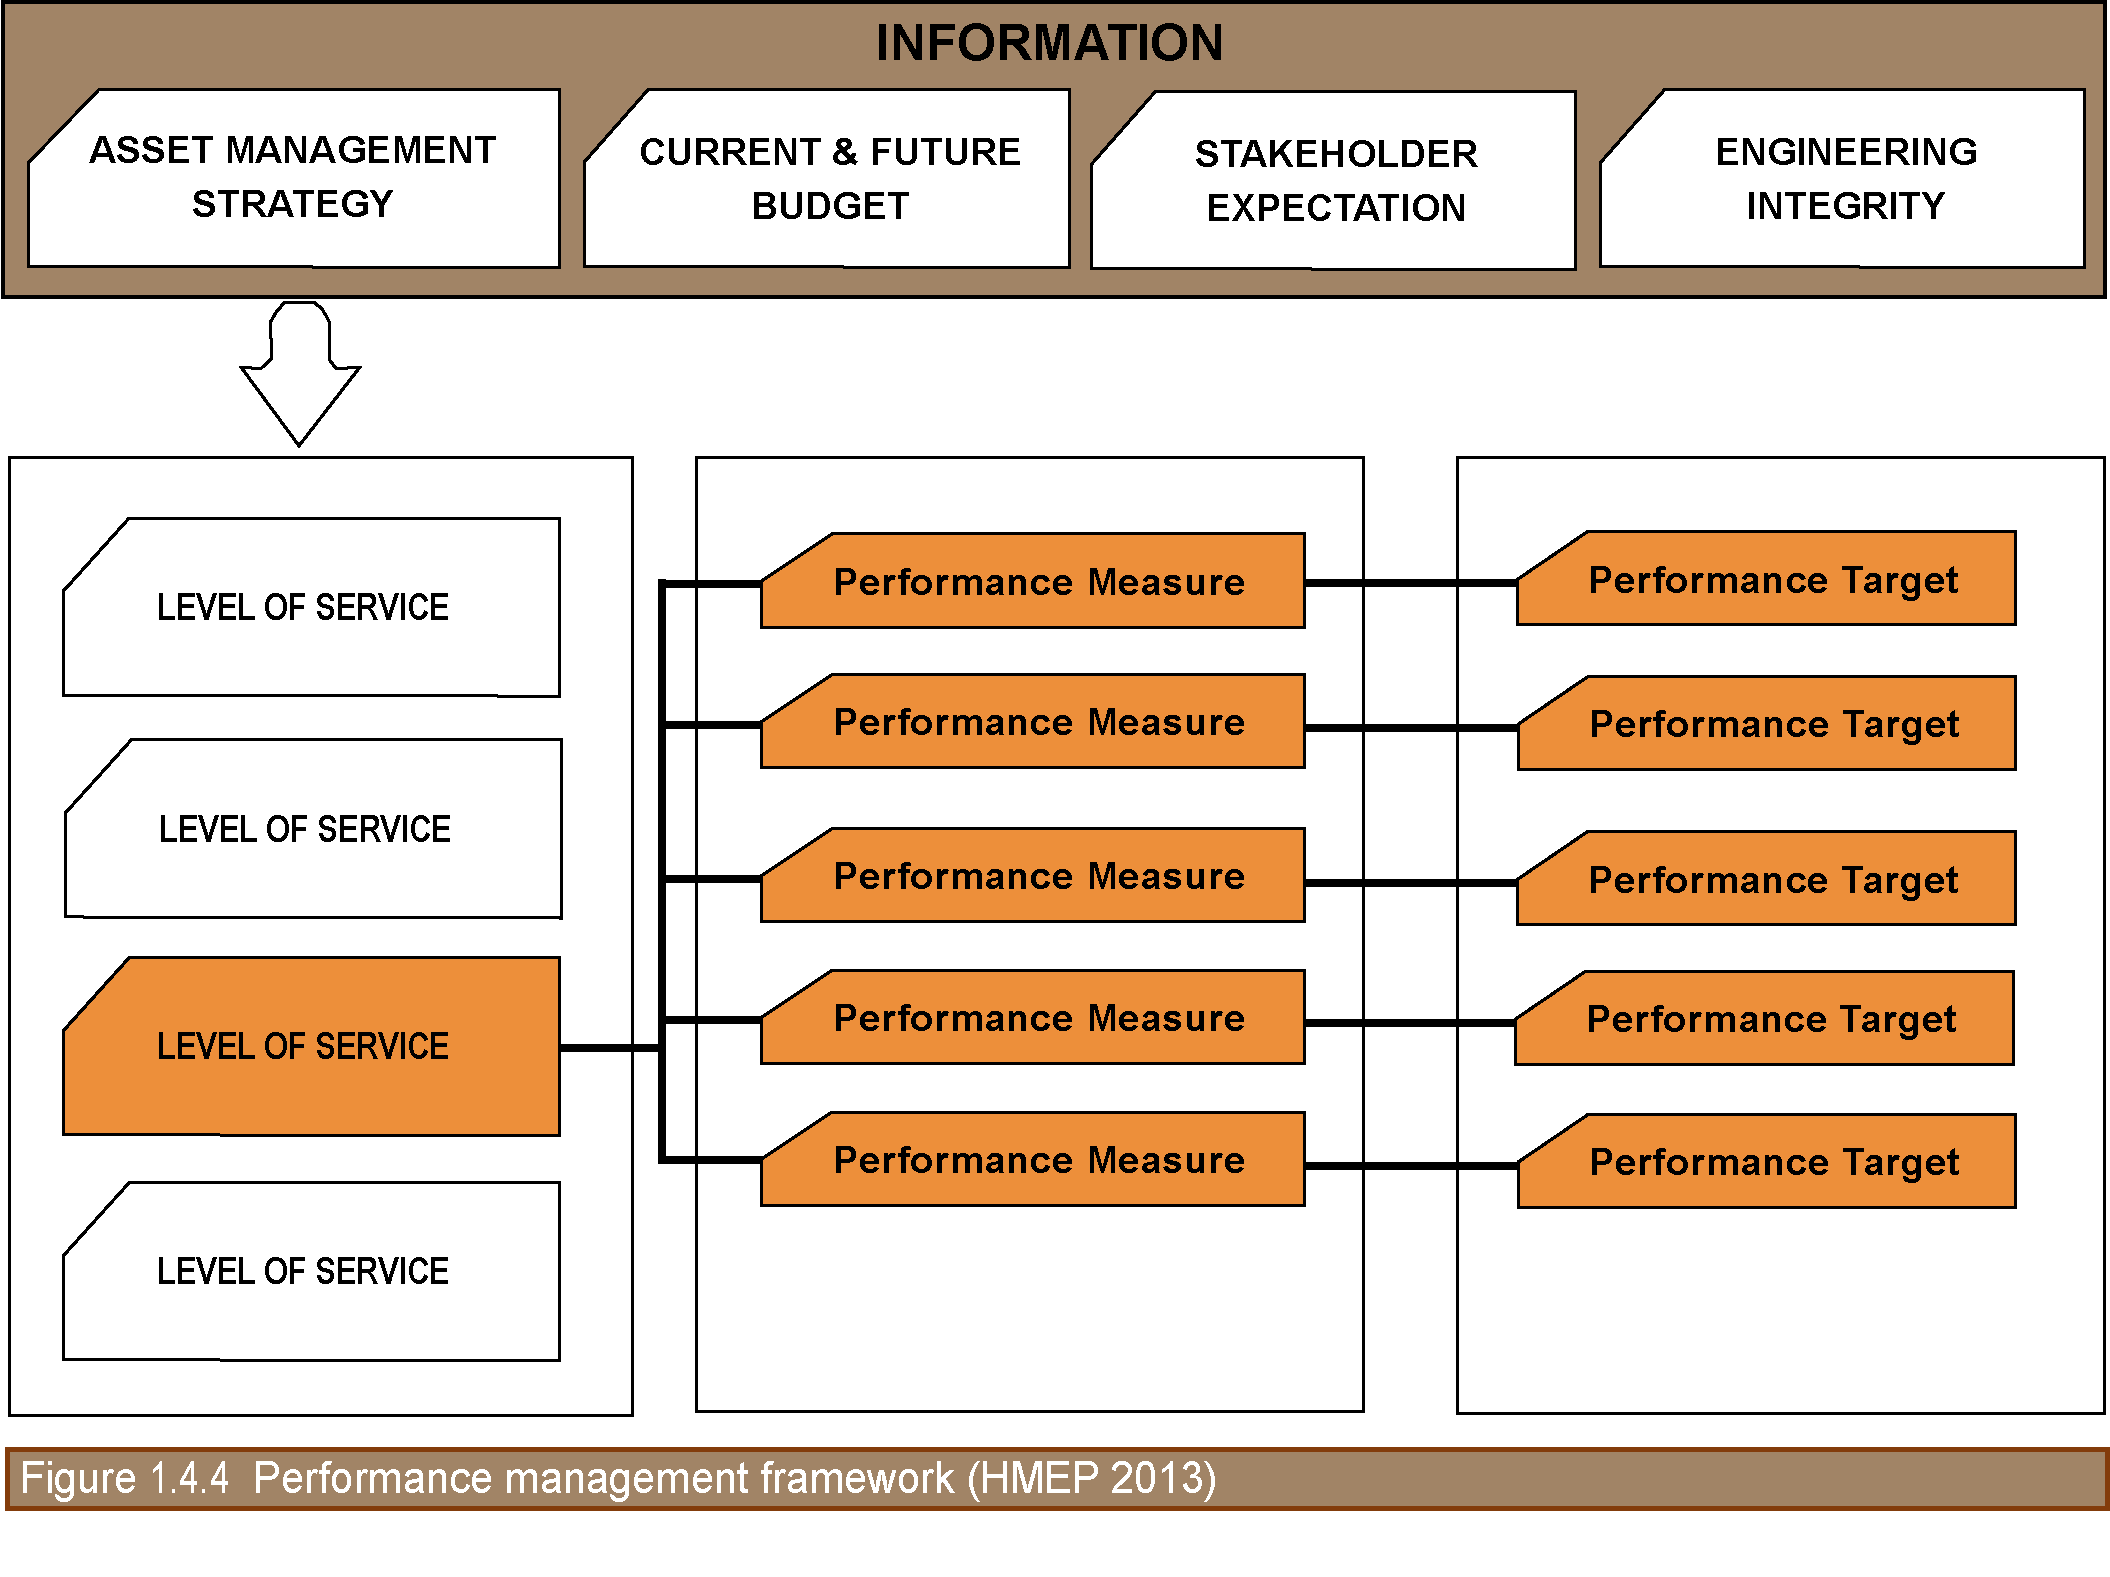
As shown in Figure 1.4.4, a number of measures can be chosen to describe the overall performance associated with each level of service.
In developing a performance framework, it is important to understand who is affected by highway asset performances; within this broad group of people, three broad categories may be identified:
The data collection and processing activities, dealt with in section 2.1, must be guided by a coherent strategic vision that specifies what goals and objectives are to be served and what measures will quantify the objectives, as defined by the performance management framework.
The methodology used to collect data, calculate performance measures and establish targets, and define the associated levels of service should be fully documented for future reference. Furthermore, authorities/agencies may develop an approach for communicating levels of service and measures to external and internal stakeholders.
The asset management strategy sets out what the authority intends to do in order to manage its highway infrastructure assets; in developing the strategy, authorities/agencies should establish the mission and goals (asset management objectives). Management objectives usually identify the quality of service to be offered to stakeholders, which reflect the authority’s aspiration/availability and the expectations of stakeholder. Any asset service affecting any stakeholders in their roles as users, taxpayers, partners, elected officials, community residents, etc., may be included.
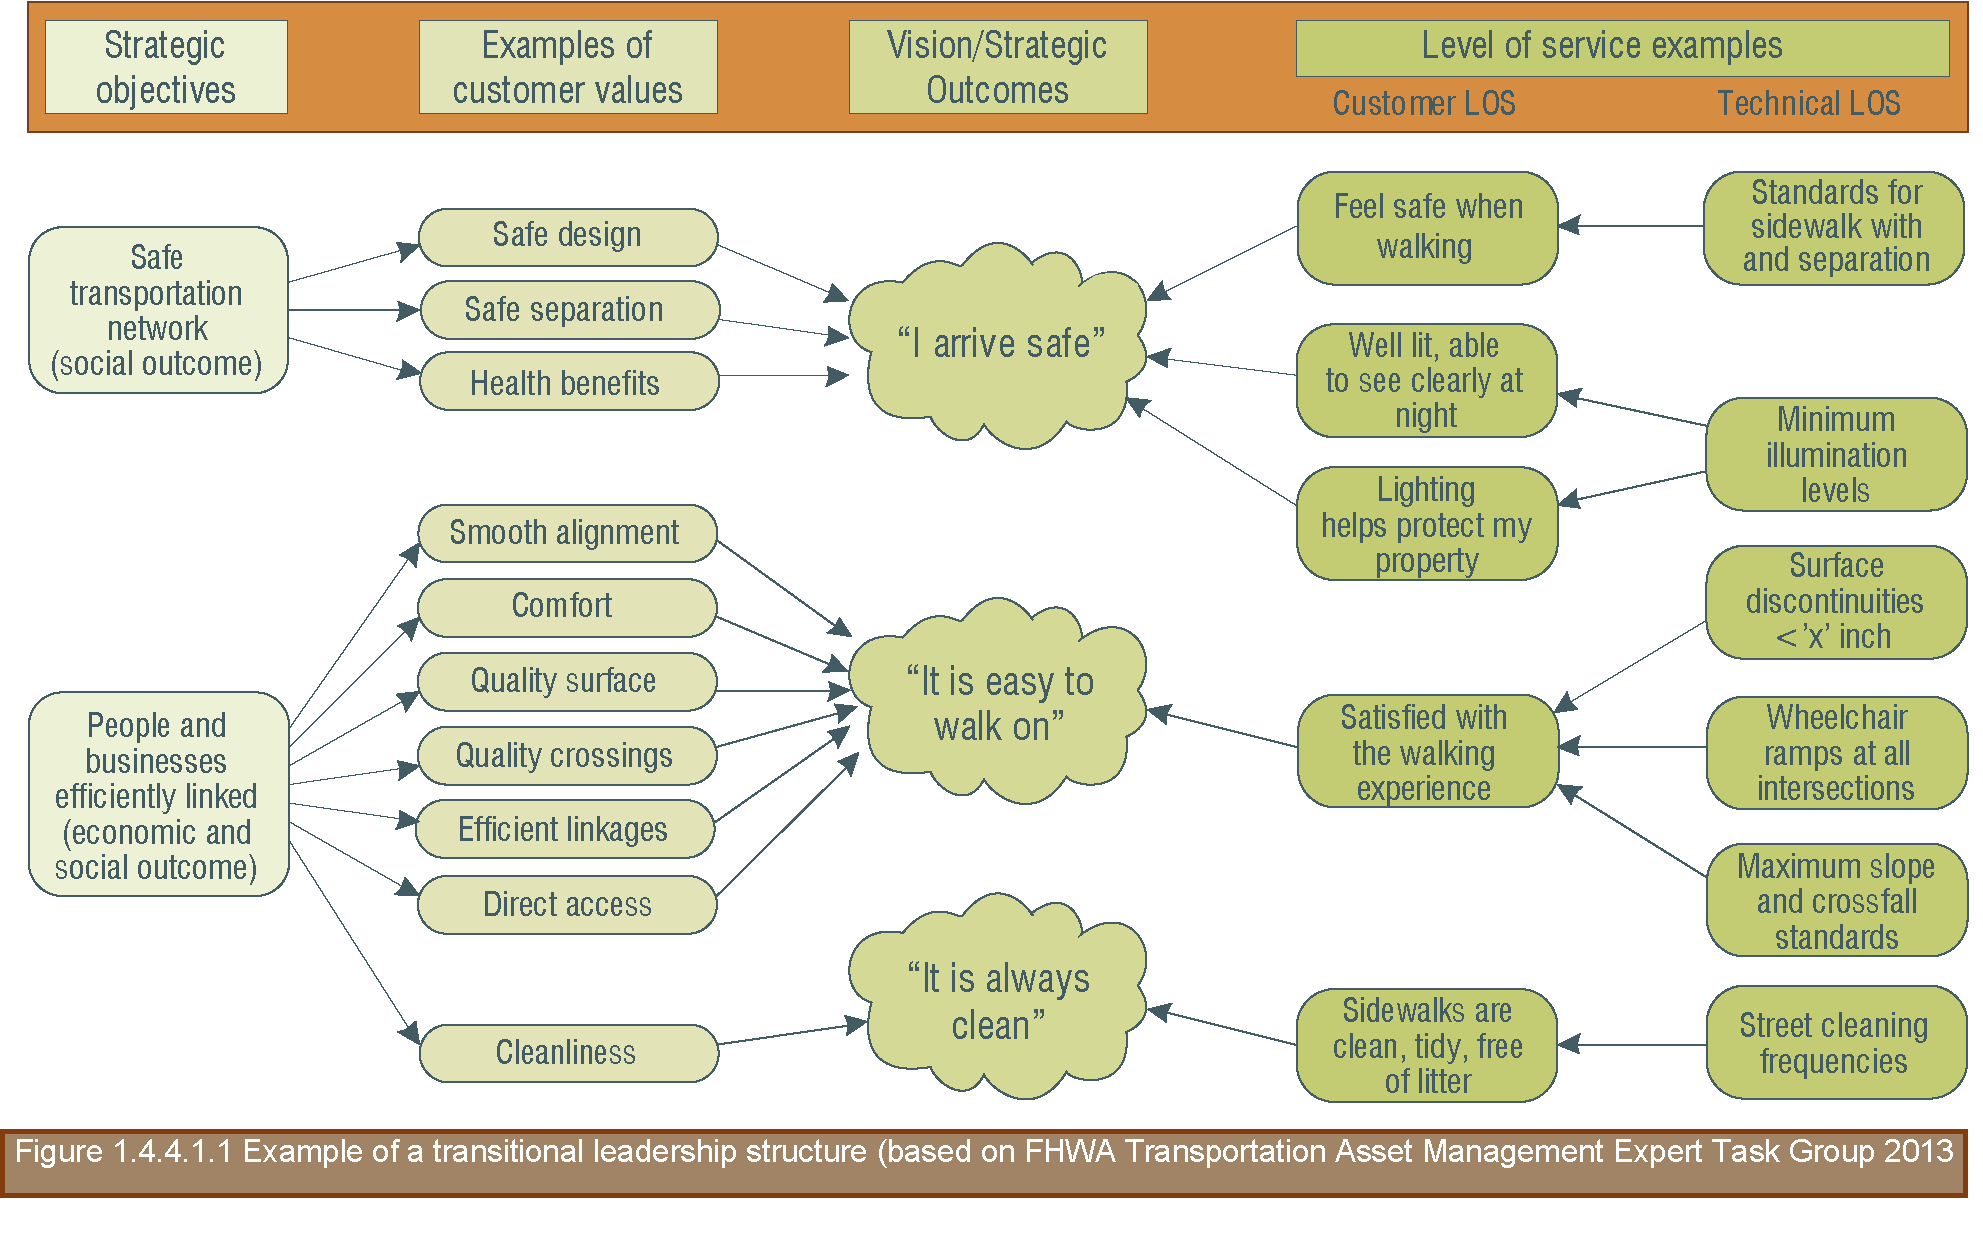
The quality of services likely to be placed in the future on the highway network should be incorporated in defining the levels of service. Therefore, levels of service are broad statements that describe the performance required for highway infrastructure assets, which are the balance between stakeholder expectations, corporate vision and available funding (see figure 1.4.4.1.1).
At the proficient maturity level of asset management, levels of service can be split into two distinct categories: customers/stakeholders and technical.
Customer levels of service relate to how the customers and stakeholders receive the service in terms of tangible and intangible measures or criteria. They are expressed in terms that customers and stakeholders can understand and comprehend. Tangibles include the appearance of facilities, frequency of service disruptions, availability of service, frequency of crashes, etc. Examples of intangibles include speed of service, staff attitude and ease of dealing with the agency.
Definition of customer level of service
Levels of service are broad statements that describe the performance of highway infrastructure assets in terms that stakeholders can understand. They should relate to outcomes and cover key aspects of asset performance such as safety, serviceability and sustainability. They should consider the performance of the whole network rather than that of individual assets
Technical levels of service support both the customer’s and the agency’s strategic objectives; they are usually expressed in technical terms used by agency personnel or contractors. At the early stages of asset management (basic maturity level), some agencies use their performance measures as level of service statements.
Definition of technical level of service
Levels of service are statements or values of a key performance indicators that describe the performance of highway infrastructure assets in technical terms and are suitable for inclusion in maintenance delivery contracts or internal service agreements. They should relate to outcomes and cover key aspects of asset performance such as safety, serviceability and sustainability. They should consider the performance of the whole network rather than that of individual assets
Each road organization needs to determine the number and nature of its own levels of service, but in any case, levels of service should be developed based on themes that demonstrate the relationship between higher level corporate objectives and any stakeholder requirements for delivery of the service, the most common aspects/themes being (see e.g. law P.L. 112-141 in USA (AASHTO, 2013)): safety, serviceability (congestion reduction, system reliability, etc.), sustainability (environmental, aesthetics), accessibility (e.g. reduced project delivery delays) , financial performance, etc.
Levels of service can be developed through workshops, focus groups, public opinion surveys, collaborative working and market survey research
It should be noted that levels of service need to be developed in a hierarchy that reflects the increasing level of detail of planning activities (see figure 1.4.4.1.2).
Strategic - To provide a snapshot of overall performance, generally for stakeholder consumption;
Tactical - To inform decision making, particularly in terms of investment;
Operational - To provide information on operational aspects of the service, such as the speed of repairs or performance of service providers undertaking maintenance activities.
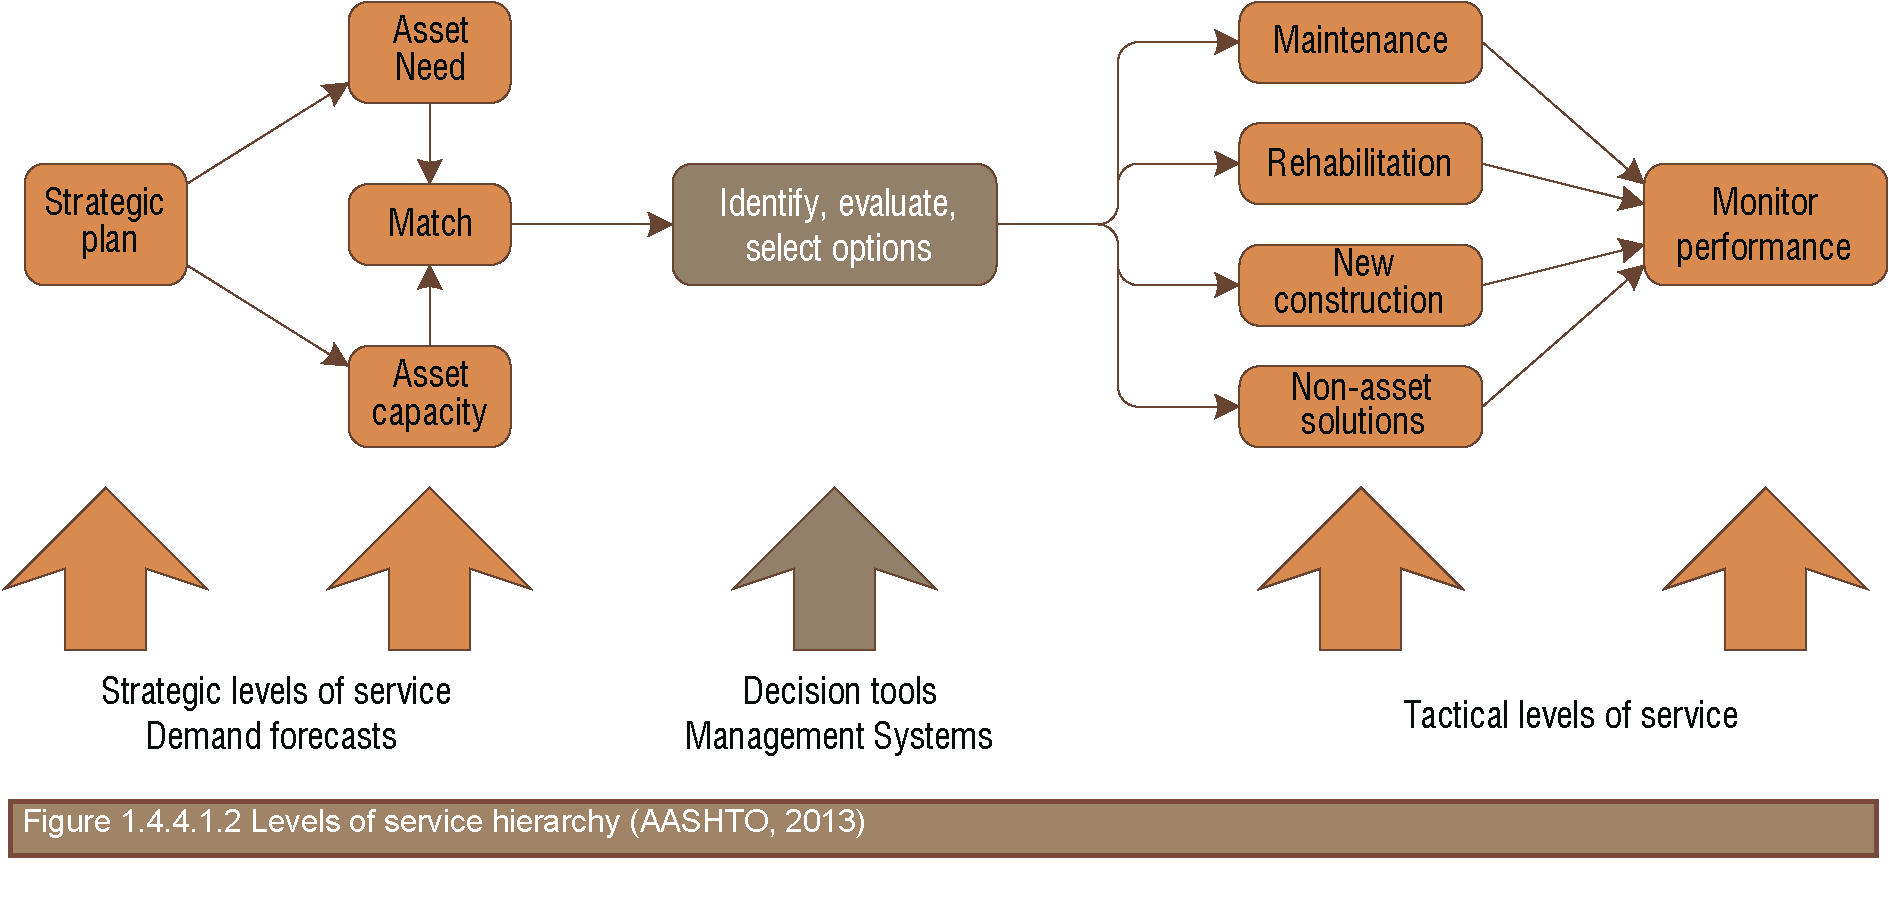
Each level of service should be supported by a set of performance measures (see figure 2), which will enable to measure both individual aspects of performance as well as the overall level of service.
Two type of measures are of interest:
It is relevant to distinguish between the condition and performance of an asset:
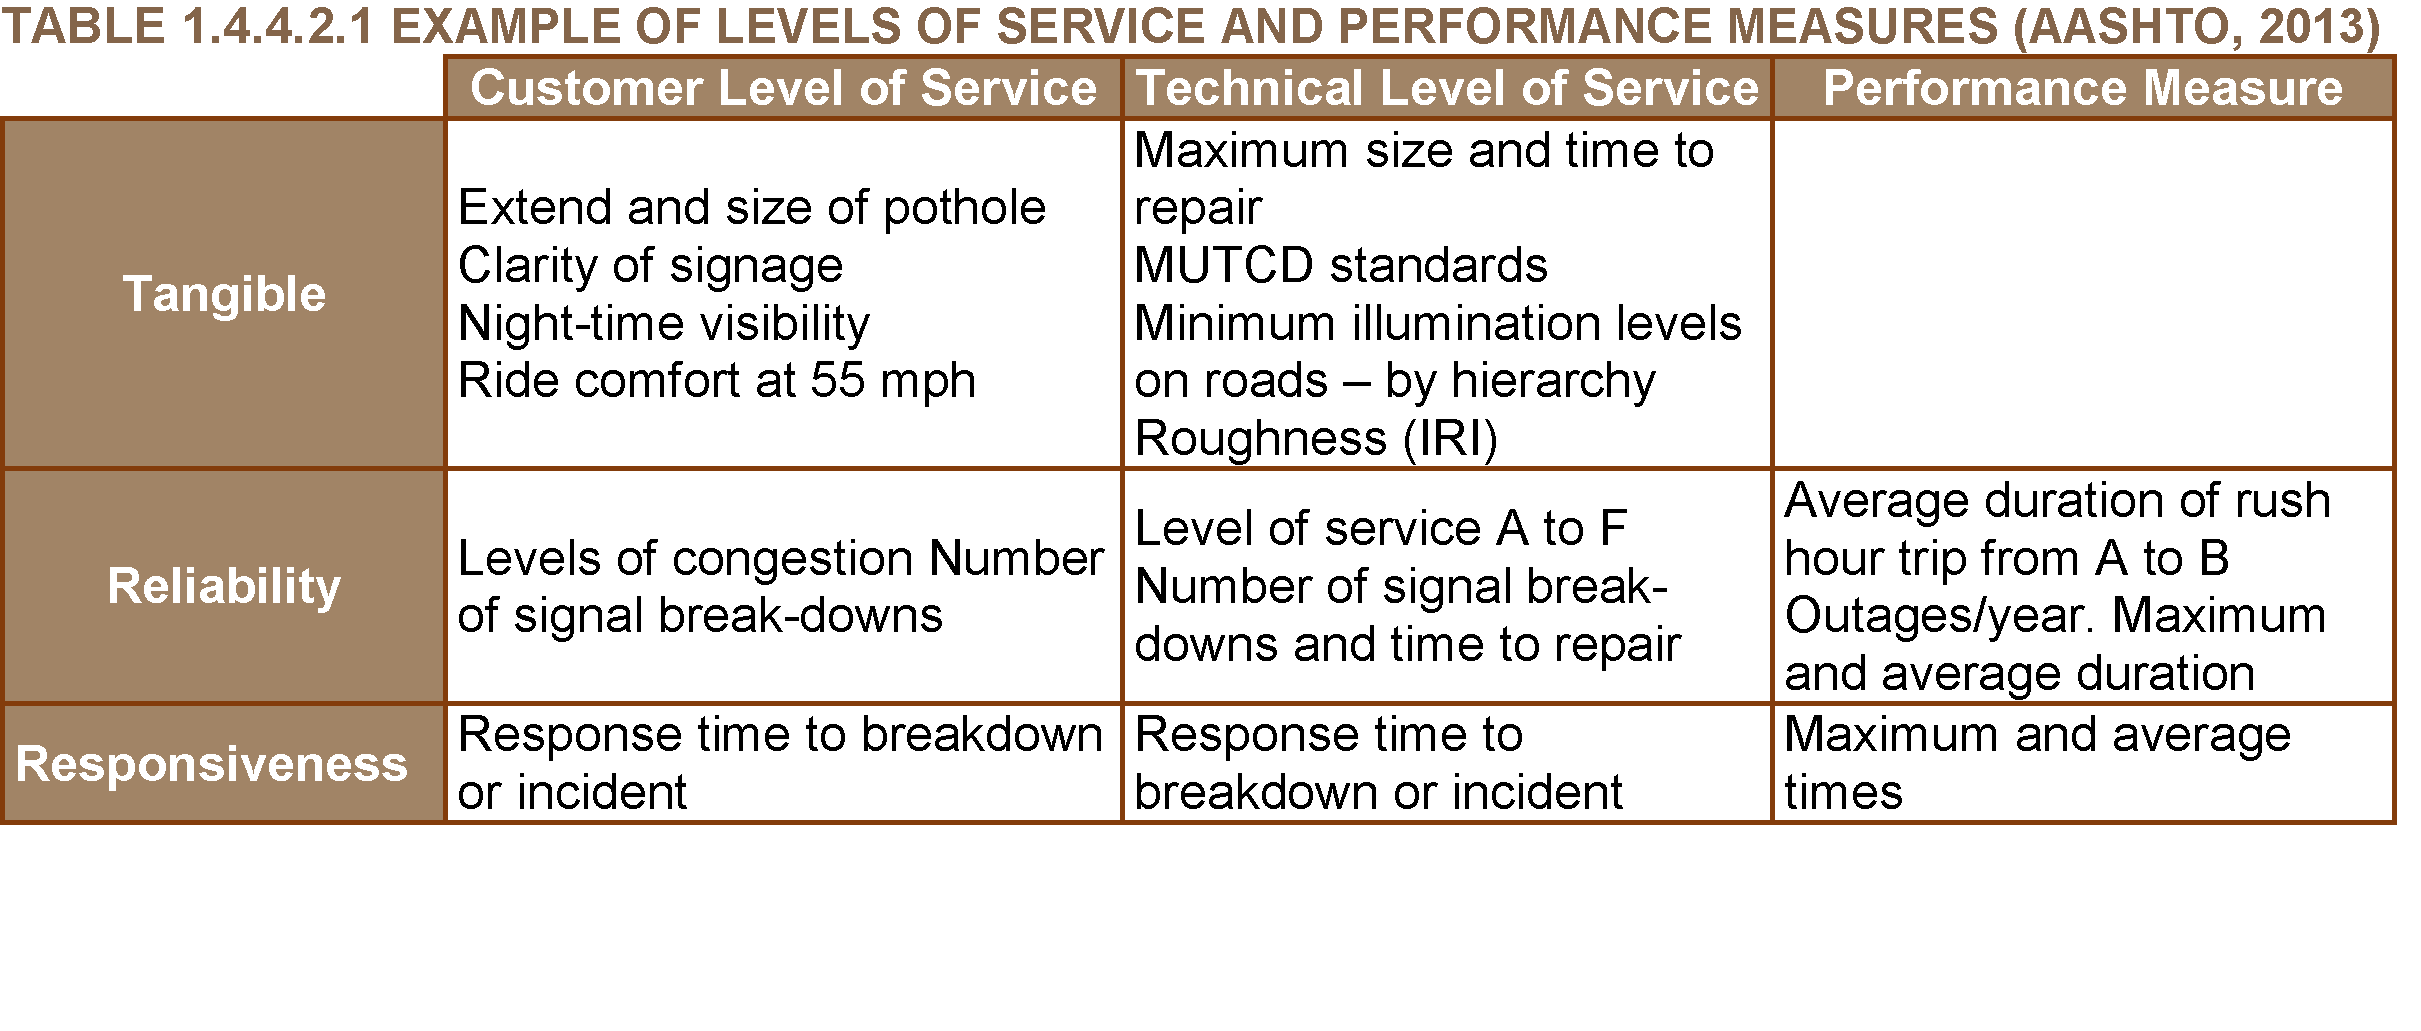
Usually, for each level of service, a number of performance measures are chosen, and the process to evaluate them generally involves the aggregation of raw data (objective and subjective, quantitative and qualitative), as shown in table 1.4.4.2.1.
Definition of Performance MeasureVarious performance measures are usually required to represent a single level of service, but they might be aggregated in a key performance indicator (KPI) to describe the level of service. It may be appropriate to use different weighting factors for each of the performance measures that contribute to a level of service or KPI (e.g. condition of footways may have a greater weighting than condition of white lines).
Performance measures are used to monitor whether authorities/agencies are meeting the levels of service and to report the actual performance. They are usually numbers or scores that have meaning to relevant staff, and are calculated transforming raw data. They may be technical and non-technical
Typically, performance measures may include both engineering and non-engineering considerations (for example based on results from public opinion surveys). There are four type of performance measures:
The steps for identifying performance measures generally include:
The logical starting point for the development of performance measures is to identify what aspect of performance is being measured.
Indicators suitable to be used as performance measures should be:
One of the basic considerations in developing performance measures is to maximize the use of existing data and minimize the need for collection of additional data.
The SMART approach may be used in selecting actual performance measures. This approach evaluates the following attributes for candidate measures:
Once performance measures are selected, it is advisable that:
Typical sources of data and other information used to define performance measures may include: public opinion surveys (letters, e-mails, calls and blogs), business reporting, operational reporting, existing inventory data, performance data (including condition) and financial reporting.
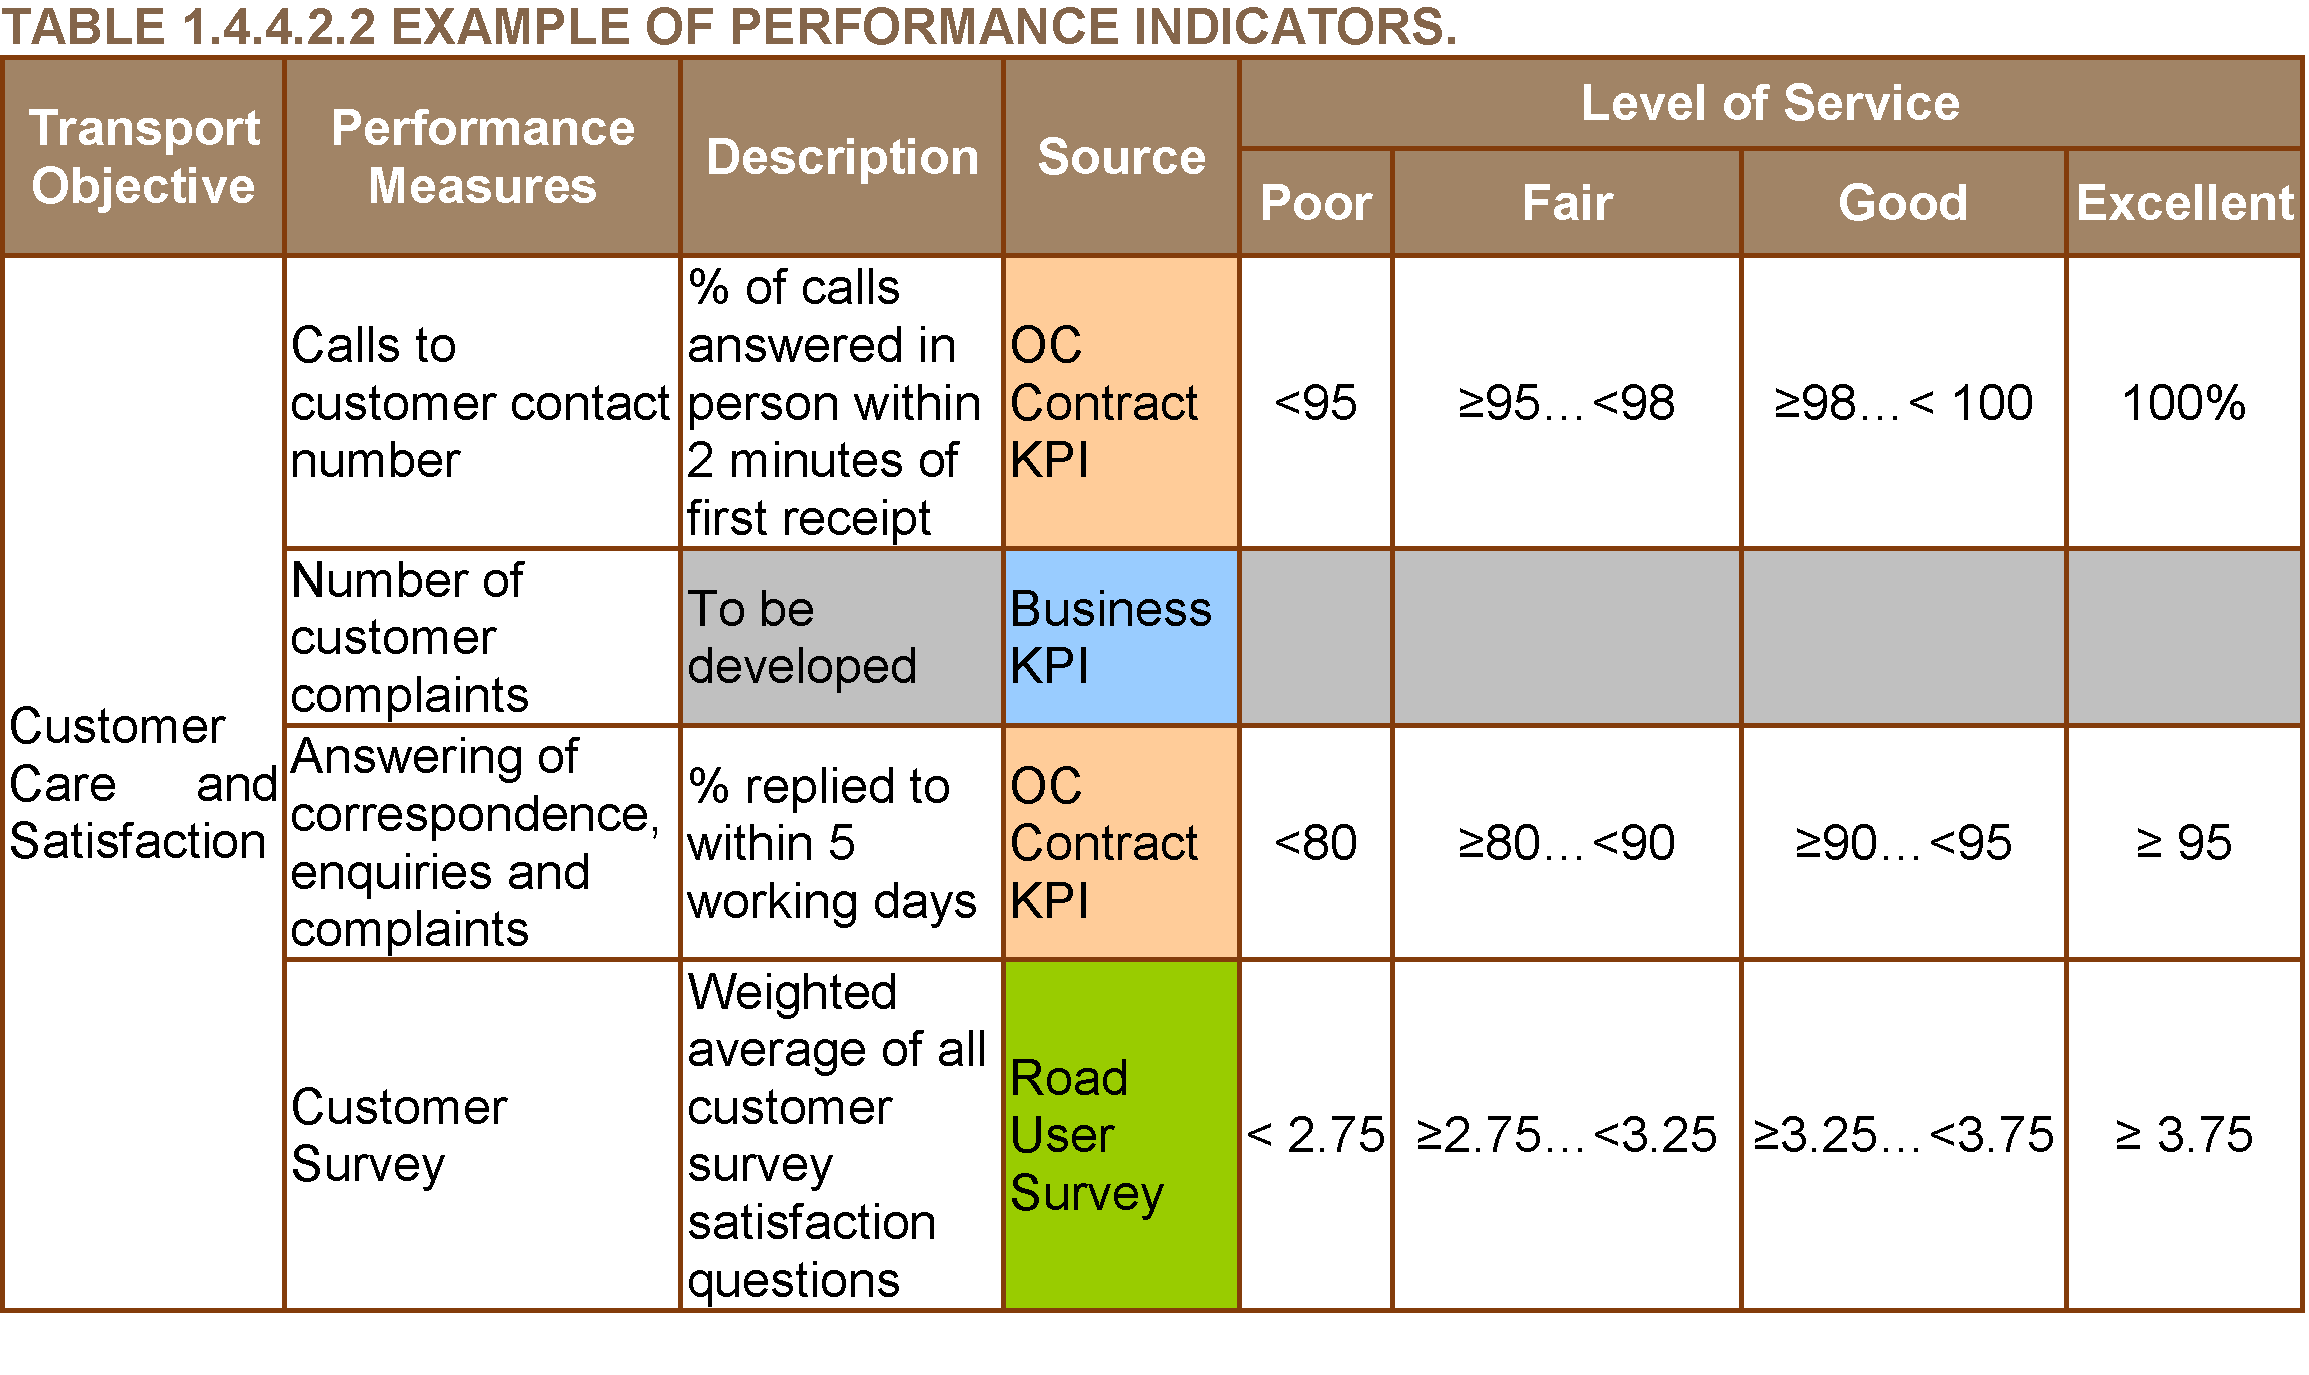
In relation to KPIs, Working Group 2 (Management Indicators) of a past PIARC Technical Committee on Asset Management (cycle 2008-2011), put some effort into identifying the existing management indicators as well as the lack of indicators when necessary (PIARC 2012). Table 1.4.4.2.2 shows some examples of the work carried out by this committee.
Progress in achieving asset management goals and objectives, as described by levels of service, is quantified by target values of the selected performance measures. Therefore, each performance measure should have a performance target associated with it over a period of time, typically up to five years.
The targets should be easily recognizable and understood by senior decision makers and/or the asset manager depending on whether they are strategic, tactical or operational.
The process of defining performance targets needs to be iterative, determining the best combination of targets against what is affordable. In this process, consideration should be given to:
Definition of targets
Performance targets define quantitatively the performance that needs to be achieved in order to reach the required levels of service. They should be set by staff responsible for asset management, agreed with senior decision makers and be achievable and affordable.
The process of setting performance targets may include steps such as the following (NCHRP, 2006):
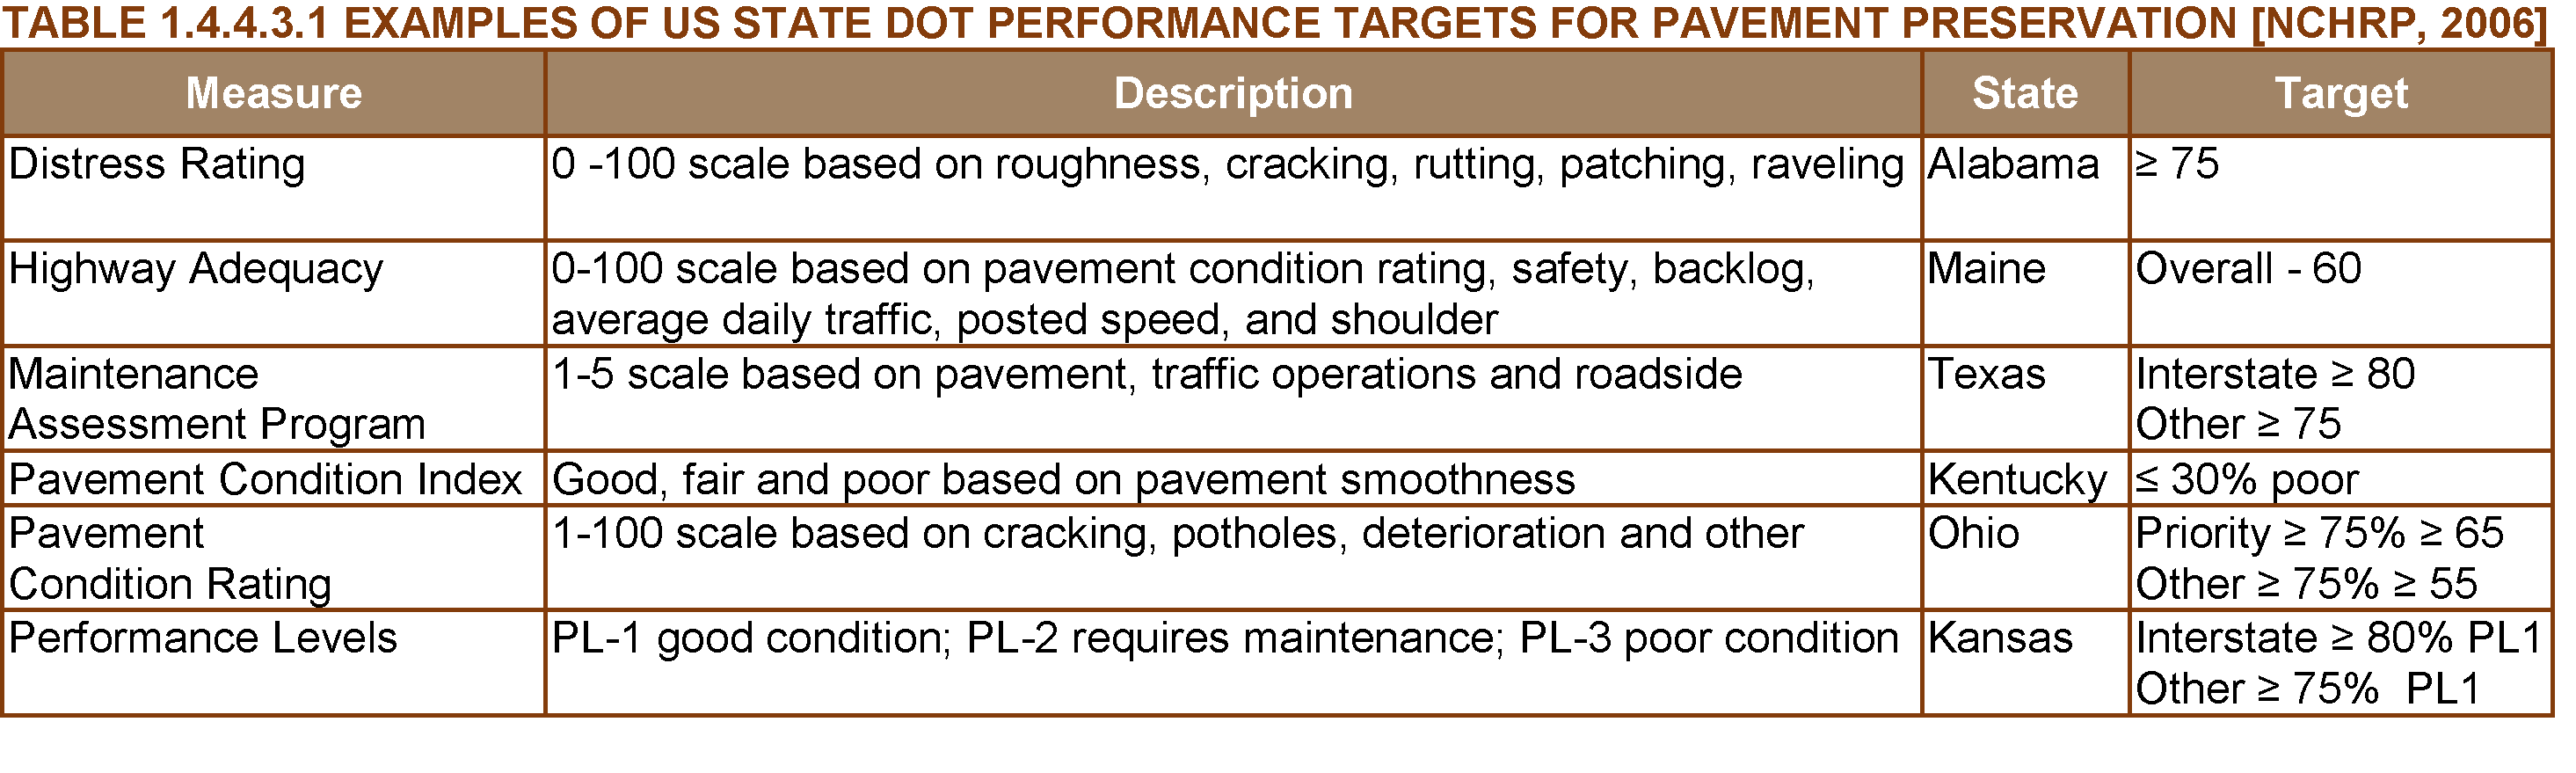
Examples of performance targets as defined by various US state DOTs are presented in Table 1.4.4.3.1 Table 1.4.4.3.2 shows examples of targets used in Romania. Both sets of examples refer to pavement preservation.
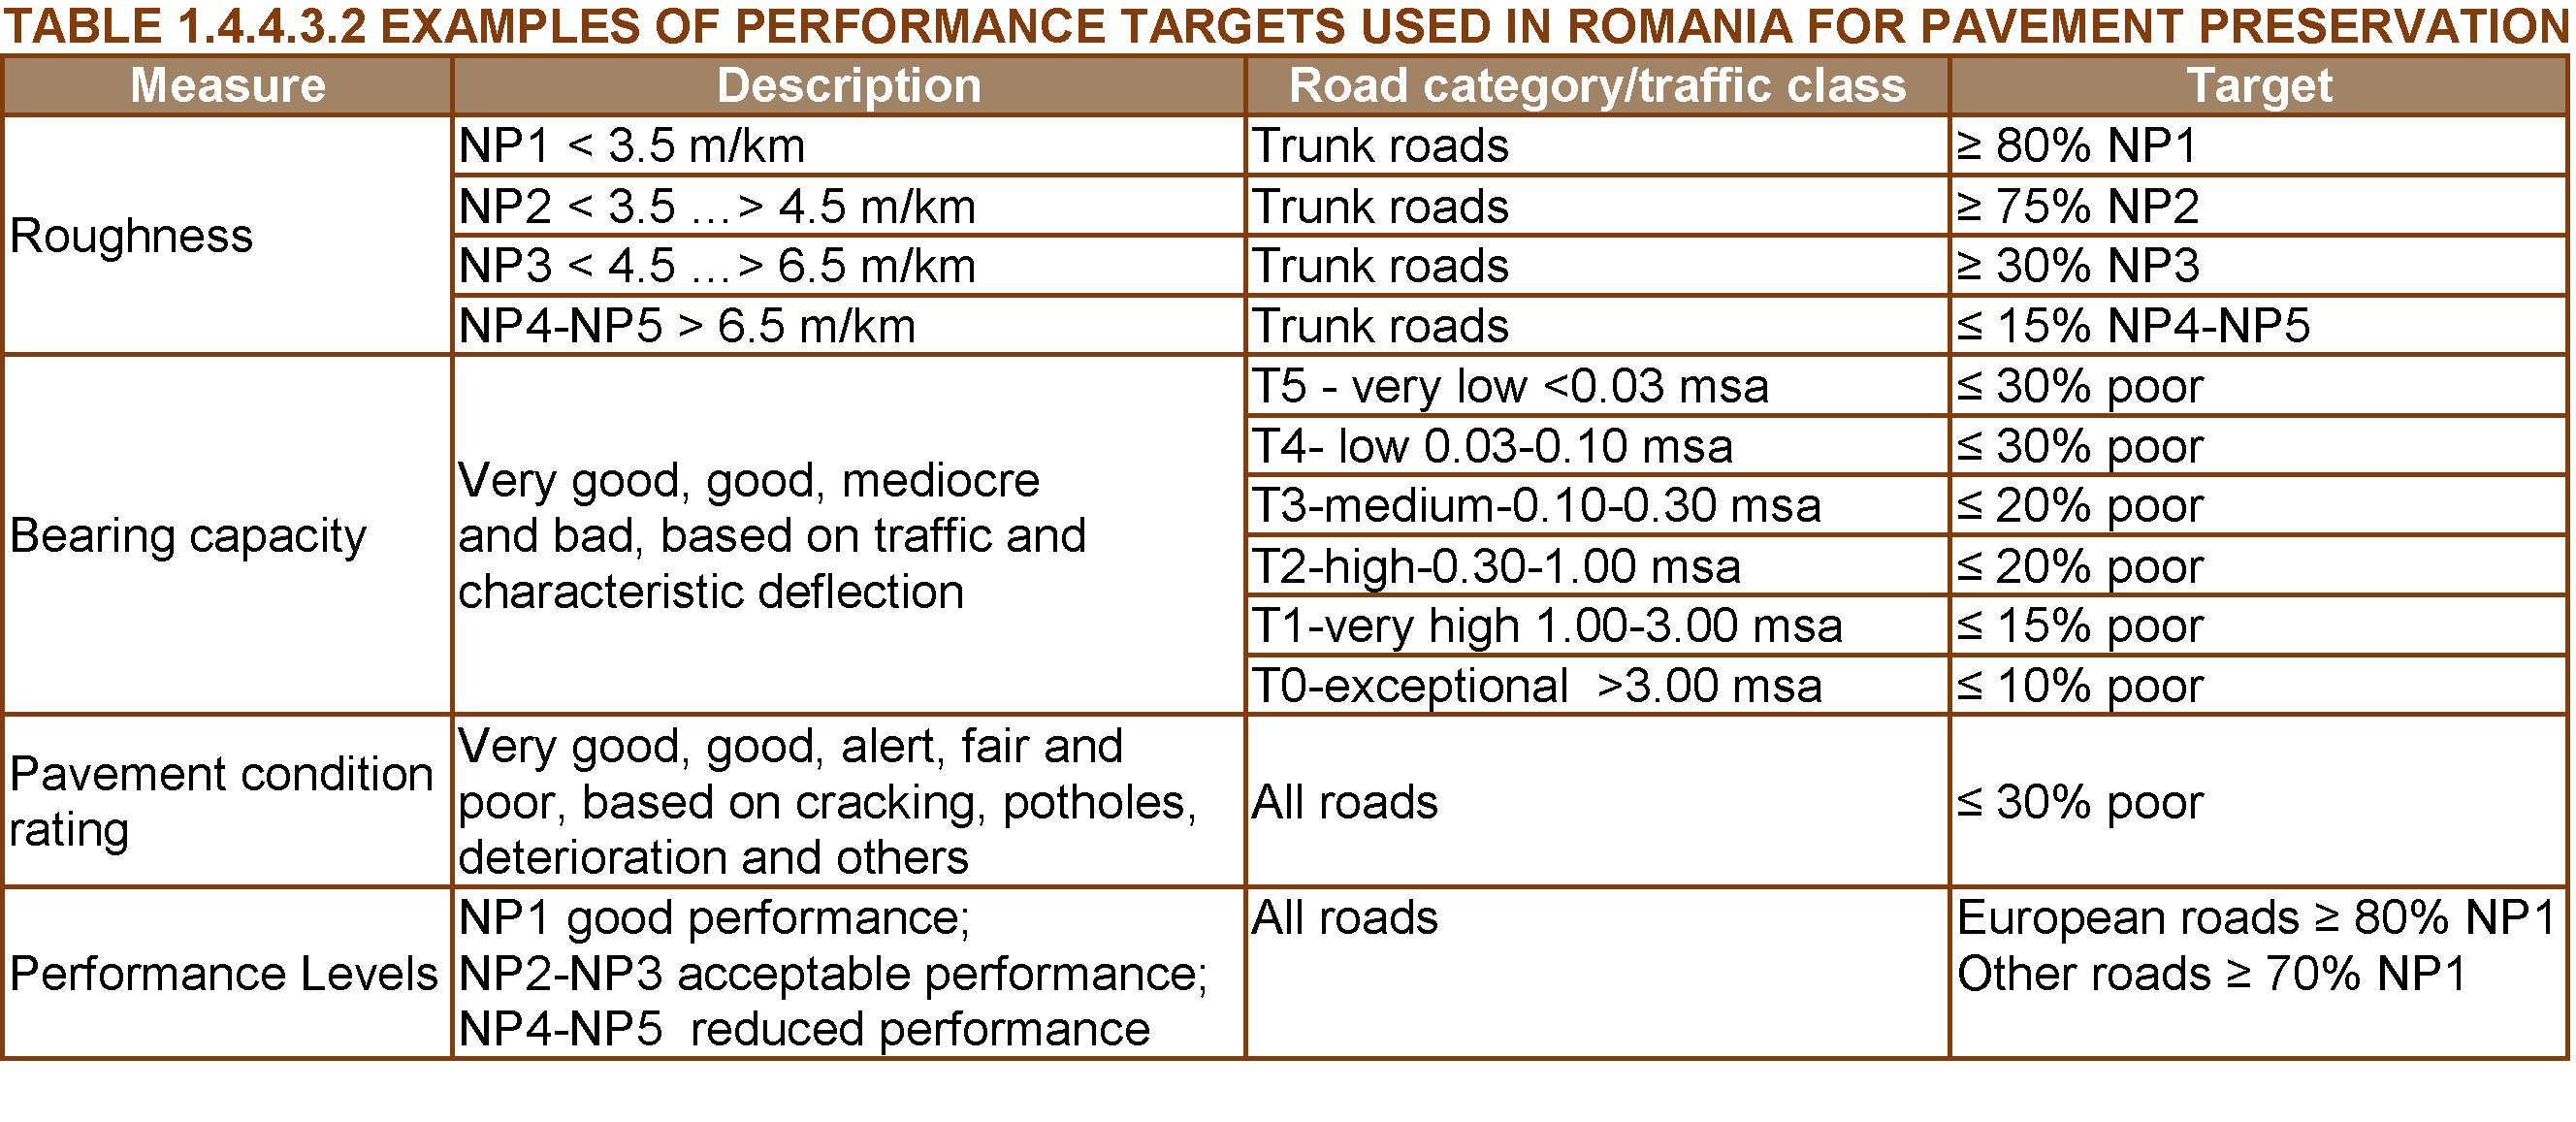
NOTES:
NP1 – very good performance;
NP2 – good performance;
NP3 – medium performance
NP4 - NP5 - poor performance
Traffic expressed in millions of standard axles (msa)
Once performance targets have been developed, they can be used to compare current against desired performance (levels of service). Any gap between the two informs about the works programs necessary to meet the asset management strategy.
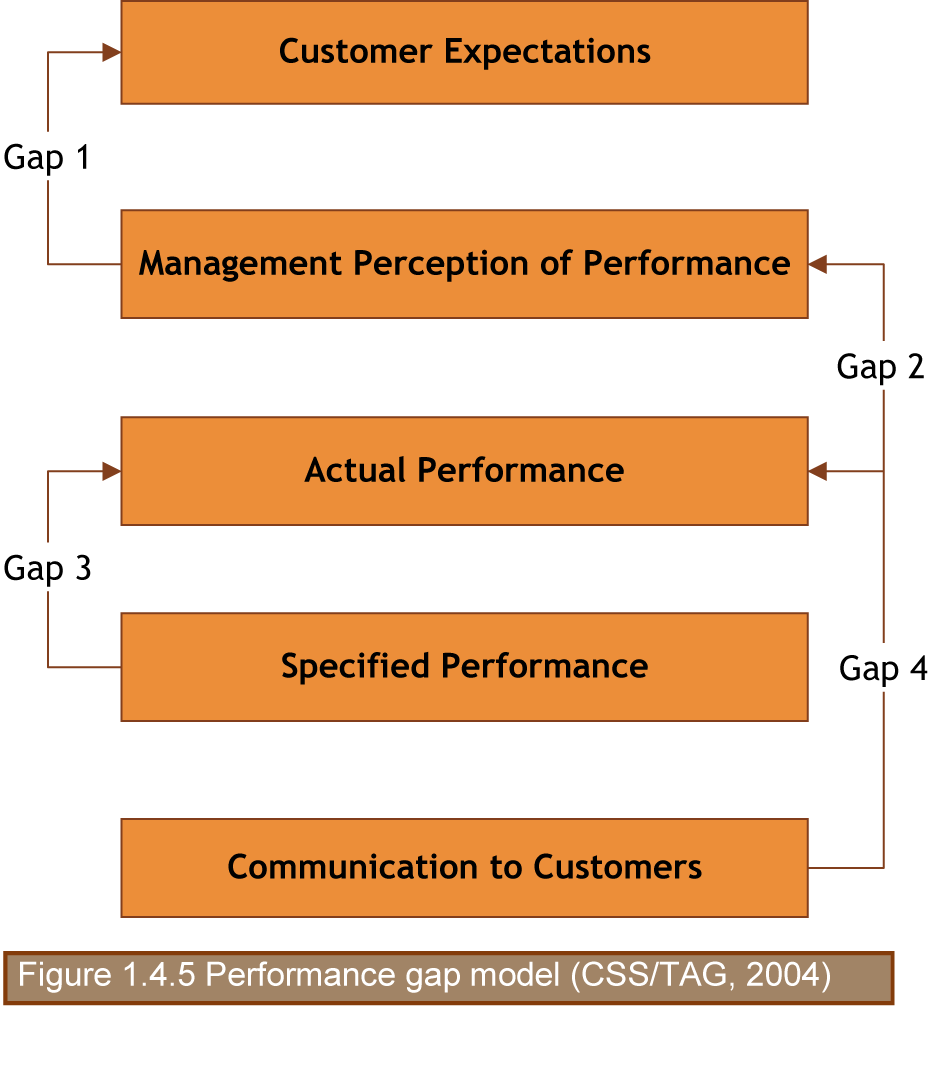
An initial evaluation of performance gaps can be undertaken by simply identifying those performance measures where the target measure has not been met. It should be noted however that a performance gap could exist for a number of reasons as follows (see figure 5):
Gap 1: Customer Expectations – Management Perception: The customer’s expectations of the service provided do not match the service provider’s management perception of what is to be provided.
Gap 2: Management Perception – Actual Performance: The management perception of the service quality does not match the actual quality of service being provided
Gap 3: Actual Performance – Specified Performance: The service is not being delivered to the quality specified in the relevant standards and/or contracts.
Gap 4: Actual Performance – Communication to Customers: There has been inadequate communication with the customers resulting in them having a skewed perception of the service delivered.
In works planning and programming, performance measures are used to structure the comparison of different options at the network and project levels.
The use of performance measures rarely makes decisions easier or automatic, but it can inform the decision – making process and communicate more effectively the consequences of investment choices.
Finally, attention should be paid to verifying that, after implementation of programs, the desired levels of service are achieved, capturing the lessons learnt from any lack of performance and including these in any revision of performance measures, targets and programs of actions/works. This is part of the approach to performance monitoring described in section 2.2.
AASHTO, 2013. Transportation Asset Management Assessment , Department of Transportation - Federal highway Administration, AASHTO Transportation Asset Management Guide: A focus on implementation — Executive Summary , Federal Highway Administration (FHWA) and AASHTO, June 2013 (http://www.fhwa.dot.gov/asset/pubs/hif13047.pdf).
Federal Highway Administration (FHWA) Transportation Asset Management Expert Task Group. 2013. AASHTO Asset Management Guide—A Focus on Implementation. Executive Summary. American Association of State Highway and Transportation Officials. Washington, DC. Last accessed July 29, 2015 (http://www.fhwa.dot.gov/asset/pubs/hif13047.pdf}.CSS/TAG, 2004. Preparation of a Model Framework for Asset Management (Plans) for a Highway Network in the UK: Stage One Report: Review of International and Cross- Sector Experience, May 2004.
HMEP, 2013. Highway Infrastructure Asset Management, Department for Transport UK, may 2013 (http://www.ukroadsliaisongroup.org/en/utilities/document-summary.cfm?docid=5C49F48E-1CE0-477F-933ACBFA169AF8CB).
United Kingdom Roads Liaison Group (UKRLG) and Highways Maintenance Efficiency Programme (HMEP). 2013. Highway Infrastructure Asset Management Guidance Document. Department for Transport, London. Last accessed July 24, 2015 (http://www.ukroadsliaisongroup.org/en/utilities/document-summary.cfm?docid=5C49F48E-1CE0-477F-933ACBFA169AF8CB).
ISO 55000, 2014. Asset management -- Overview, principles and terminology. ISO standard.
NCHRP 551, 2006. Performance Measures and Targets for Transportation Asset Management, National Cooperative Highway Research Program - Report 551, Transportation Research Board, Washington, D.C. 2006 (http://onlinepubs.trb.org/onlinepubs/nchrp/nchrp_rpt_551.pdf).
PAS 55, 2008. PAS 55: Asset Management – Parts 1 and 2. British Standards Institution's (BSI).
PIARC 2004. The framework for performance indicators, Comité technique 6 Gestion des Routes / Technical Committee 6 Road Management The Framework for Performance Indicators, PIARC Paris France 2004, ISBN 2-84060-165-6 (https://www.piarc.org/en/order-library/13485-en-The%20Framework%20for%20Performance%20Indicators.htm).
PIARC 2012. High level management indicators, Comité technique AIPCR D.1 - Gestion du patrimoine routier/PIARC Technical Committee D.1 - Management of road infrastructure assets, PIARC Paris France 2012, ISBN 978-2-84060-288-1 (http://www.piarc.org/en/order-library/17058-en-High%20level%20management%20indicators.htm?catalog&catalog-topic=33).
The following case studies are presented in this chapter:
CASE STUDY 1: GEPUR guide a single shared methodology for managing an inter-urban or an urban network
CASE STUDY 2: Footway evaluation developed by BRRC
HUGUES ODEON, CEREMA, France
In France, the IQRN method has been used to manage the national road network for about 25 years. But this method is not fit for local road networks, and there is no other simplified method available. The main purpose of the GEPUR project was to provide a single and shared methodology for managing local road networks of Eastern France (ten departments). This methodology was written by officers who are in charge of the daily management of inter-urban and urban road network; the group was led by a representative of the Cerema. The final guide is composed of two parts, the first one for inter-urban networks, and the second one for urban roads. The frame of these two parts of the guide is similar, but the urban roads have specificities that influence their behavior and lifecycle, making it necessary to take them into account.
The aim of the GEPUR project was on one hand to provide a guide available for road network managers and their contracting authorities, and on the other hand to create a group of road network managers who will be able to share their know-how.
The GEPUR project allowed road network managers to build their own methodology together, taking advantage of the experience of each of them.
The GEPUR guide provides an open methodology. Its implementation to a specify network can be different according to the contracting authorities policy, the length of the network and the financial capabilities of the department or the city.
Regarding the asset management plan, the road network manager can opt for different strategies. Usually, the network is divided in three or four classes, and the chosen strategy varies according to the classes.
First, he has to choose between different priorities:
Then, he has to define different technics for maintenance. Each of them has benefits and limits which must be taken into account. For example, the routine maintenance can only maintain the quality level of the road for a few years, a surface dressing can restore the surface characteristics of the pavement (impermeability, skid resistance) and an asphalt concrete can moreover contribute to strengthen the structure.
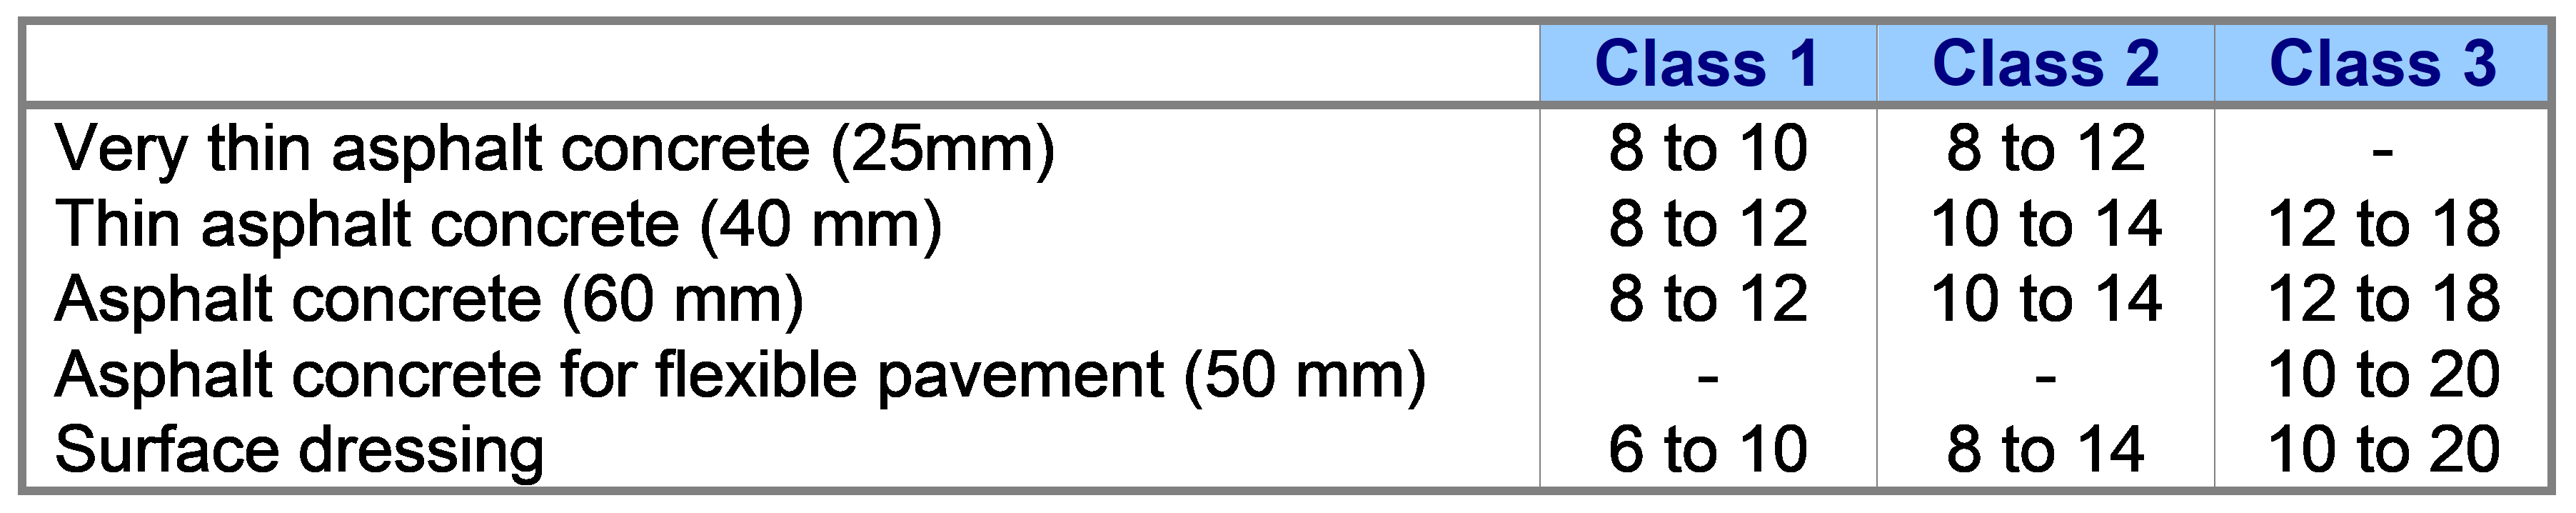
It is then possible to define which technics will be used on each class of the network, what the maintenance frequency is for each of them, and what average percentage of surface will be treated with each technic. For example (Table 1.4.7.1), on the class 1 network, it could be possible to adopt 15% of very thin asphalt concrete, 15% of thin asphalt concrete, 20% of asphalt concrete, and 50% of surface dressing. On the class 3, these percentages can respectively be 0%, 25%, 0% and 60%, with 15% of specific asphalt concrete for flexible pavement. The durability of each technic also depends on the traffic of the road, and consequently of the class (Table 1.4.7.2).
Table 1.4.7.1: Average percentage of each technics per class (%)
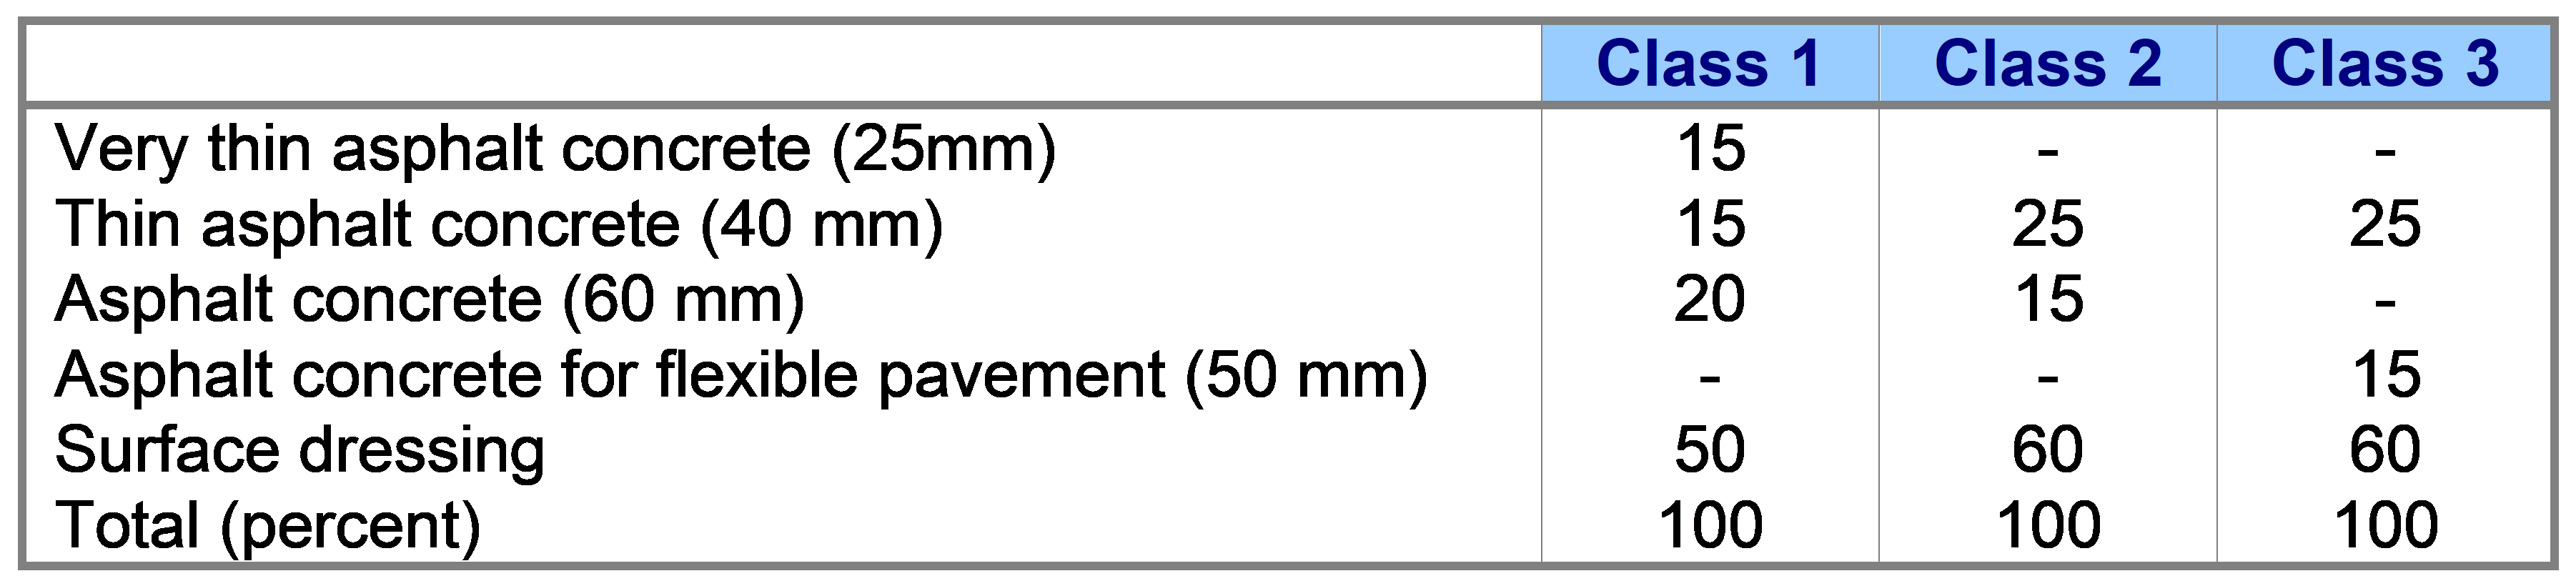
Table 1.4.7.2: Average durability of the different maintenance technics (years)
Finally, the road network manager defines an asset management plan for each class of the network (Figure 1.4.7.1), describing the type of maintenance to be applied and its average durability for a long cycle life (30 years for example). It is then possible to evaluate the global cost of this asset management plan over 30 years, and to adjust it to the financial capabilities of the department.
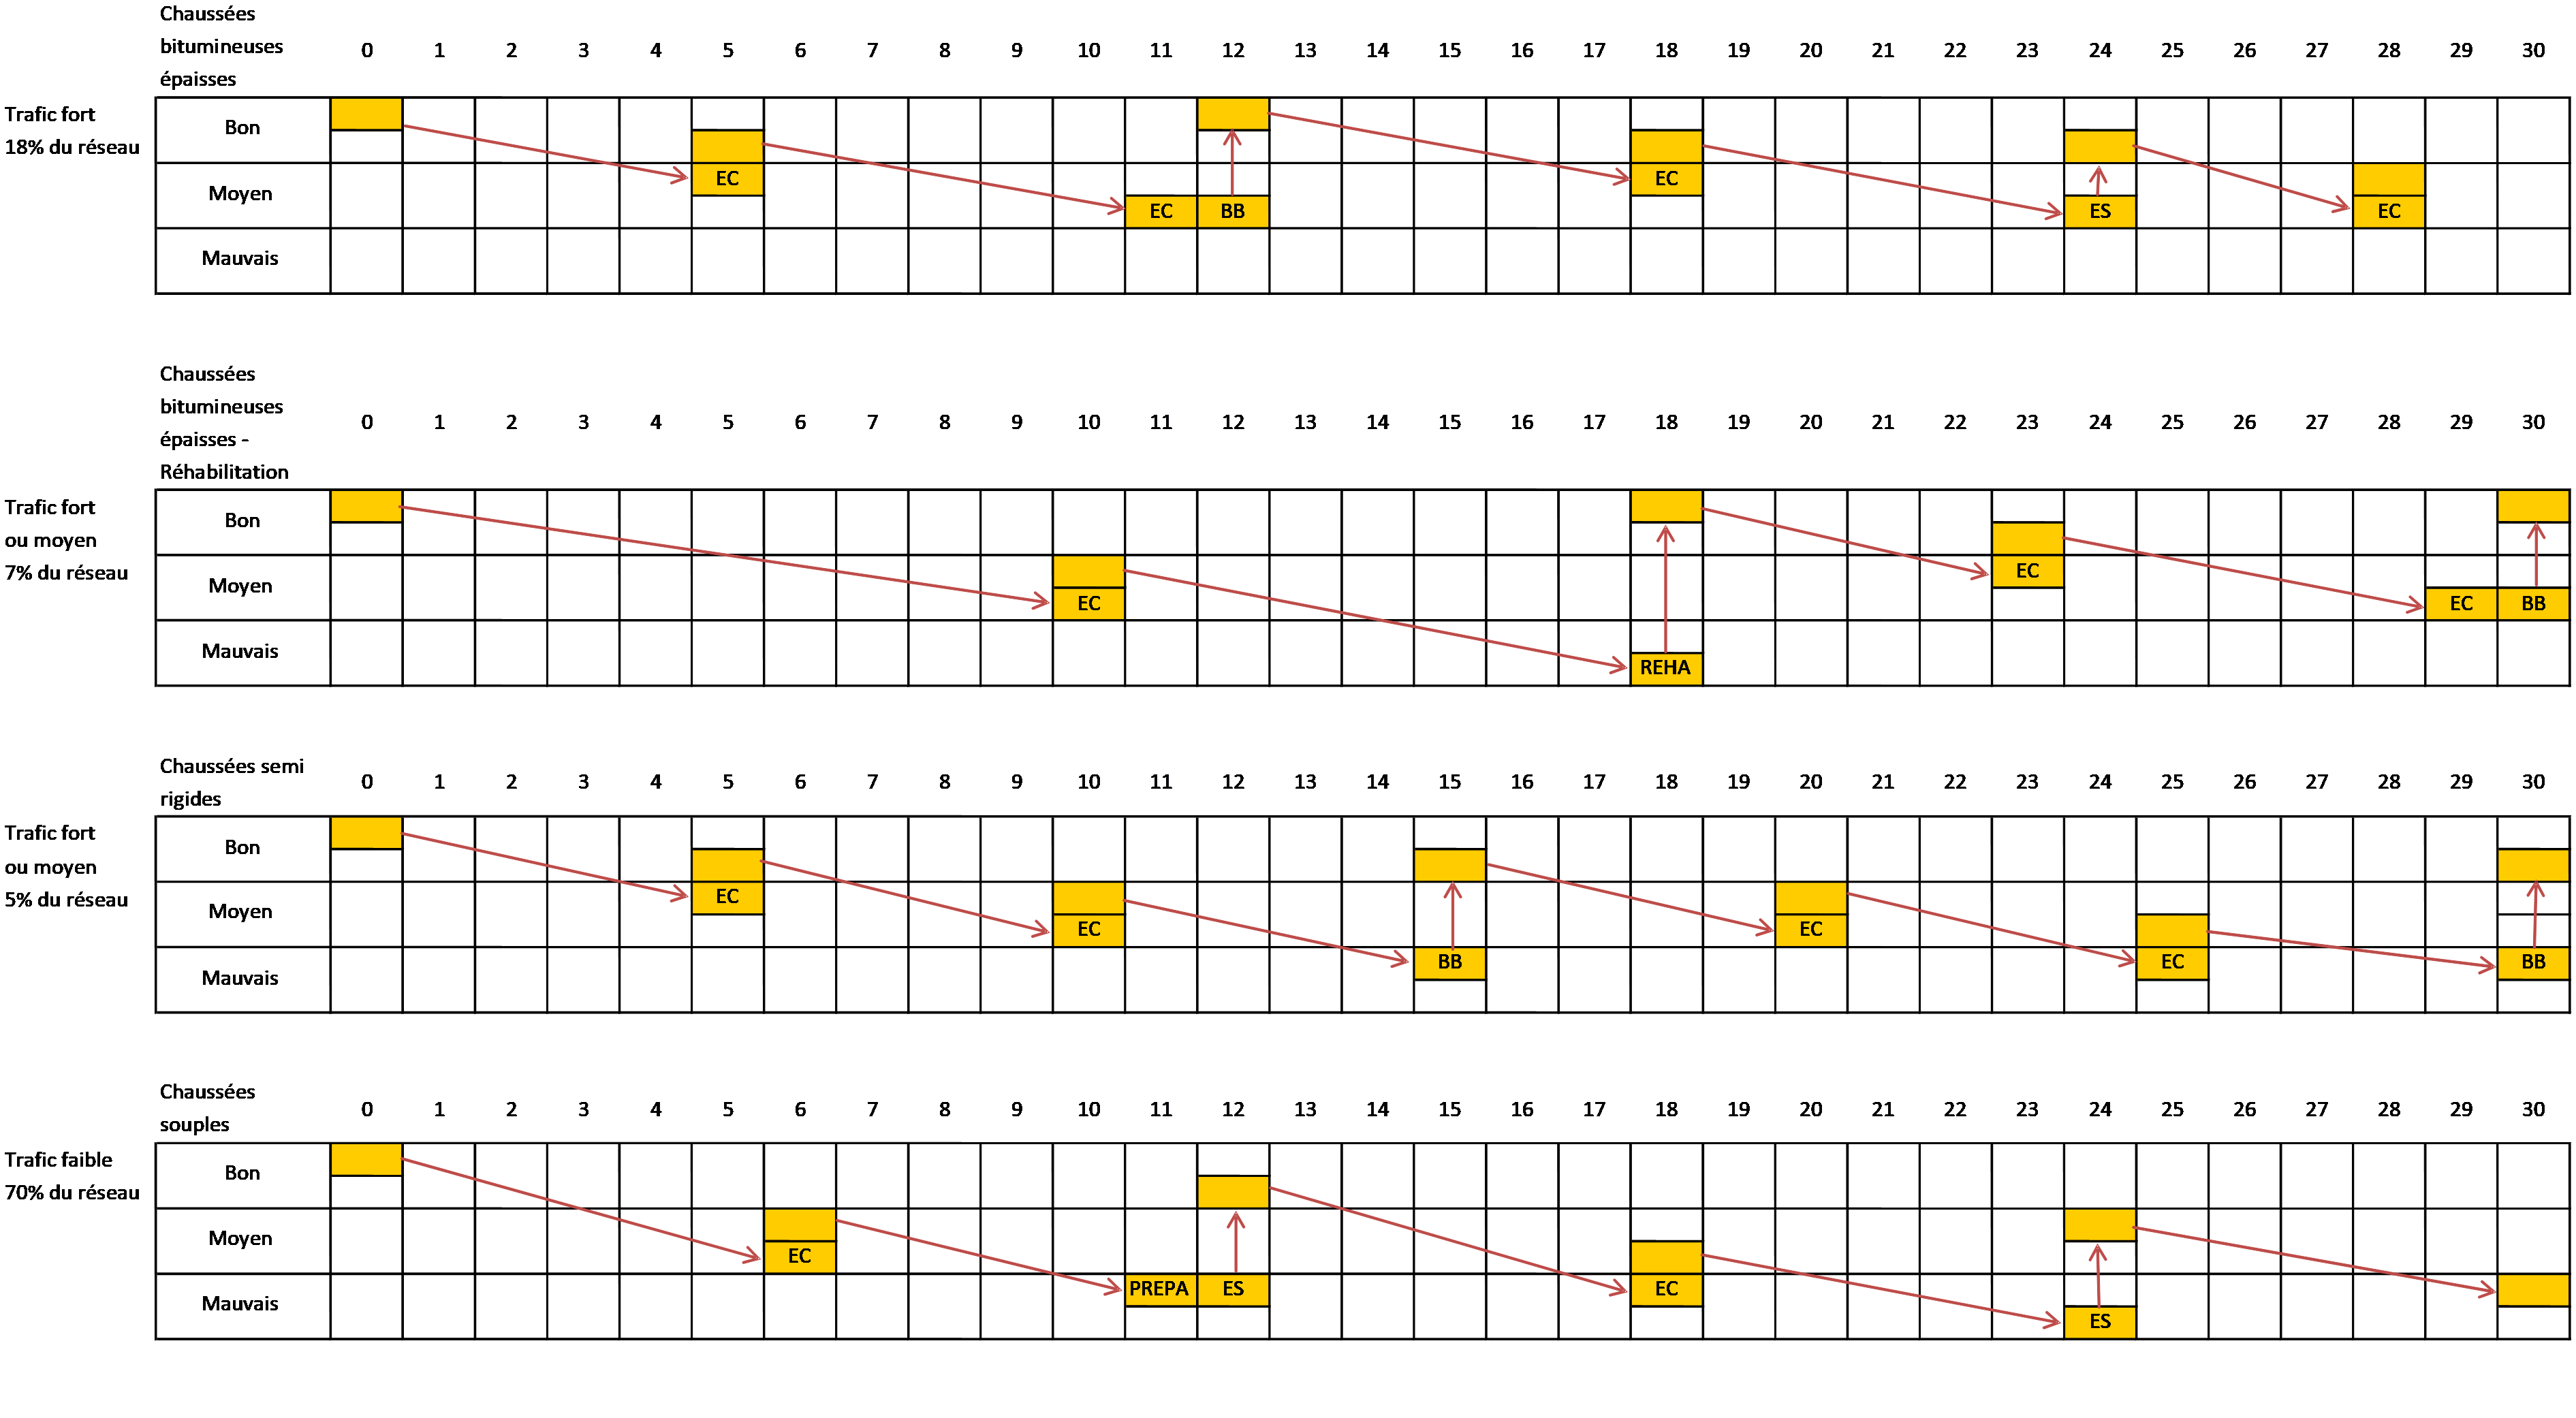
Figure 1.4.7.1: Asset management plan depending on the type of structure (flexible, bituminous, rigid) and traffic
The GEPUR guide provides a tool to the road network managers and their contracting authorities, which allows them to define their own asset management plan, according to their quality policy and the financial capabilities. This guide is in two parts, the first one for inter-urban road network, and the second one for the urban road network.
Group. 2016. GEPUR Part 1 : inter-urban network. IDRRIM. Paris (Fr), June 2016. https://www.idrrim.com/publications/4484.htm
Group. 2018. GEPUR Part 2 : urban network. IDRRIM. Paris (Fr), to be published.
Odéon H., Jung V., Schang J.P. (2015) : GEPUR, une méthode de gestion d’un réseau routier par et pour les collectivités locales, AIPCR 2015, Séoul (Corée du Sud), nov.
Odéon H., Schang J.-P., Jung V. (2017) : GEPUR : a method for managing a road network by and for local authorities, JTTE, USA, Marc-Apr, pp. 104-115.
TIM MASSART, BRRC, Belgium
Walking and cycling are green transport modes which should be given more attention in future. The quality of footways is not always very good. Maintenance planning and budgeting are mostly based on ad hoc repairs.
The problem is the lack of a complete evaluation method. We have developed an evaluation method for footways.
Our approach is based on a network analysis with a wheelchair, which is the most “sensitive” type of footway user. This wheelchair is equipped with sensors and a skid resistance measuring device. Three parameters (comfort/longitudinal unevenness in the direction of travel, gradient in the direction of travel, and crossfall) can be measured in one run, and a skid resistance measurement is made in each section of the network.
We would like to present this measuring equipment with results maintained untill now. Furthermore we would like to promote this approach and show the good relation between the objective measuring device and the subjective rating of the testpanel.
Efficient inventorying and inspection of footways.
The objective of this tool is to measure in 1 pass the comfort, crossfall and longitudinal slope of a footway in an objective way.
By measuring the 3 characteristics, mentioned above, in an objective way, we eliminate subjective complaints from citizens.
At the national and international level, there is currently no objective tool to determine this quality of pedestrian pavements continuously, quickly and cost-effectively. The concept is all too often approached subjectively, on the basis of the feeling that we get as a traffic participant in a public space. That is why the Belgian Road Research Center decided in 2015 to develop a measuring instrument to assess pavements on three criteria that are fundamental for pedestrians: flatness (comfort), skid resistance (resistance to slipping) and slope (transverse and longitudinal).
Relevant technical parameters to be collected for footway evaluation are the following:
Footway width
Different users need different footway widths. In this concept we use a wheelchair. We assume that people with impaired mobility are the most “sensitive” users of a footway. If people with a wheelchair, baby car or other vehicle can travel in an acceptable way, the criterion is met.
Longitudinal unevenness / comfort
The feeling of comfort on a footway varies widely with the type of user. In the concept proposed in this article, we will measure comfort with a wheelchair equipped with an accelerometer. This evaluation is objective and stringent, because a wheelchair user suffers the most from lack of comfort on a footway.
Crossfall / gradient
Crossfall should normally be lower than 2 %. This parameter will be measured continuously in the concept proposed below.
Basic concept (V0)
After analysing the available tools and the way inspections are made in other countries, we found that no existing device can measure all the relevant characteristics at an affordable price. That is why we are suggesting the concept described below. (This measurement method remains to be refined and the measuring equipment still needs to be developed.)
The basic component of the method is a wheelchair. We propose to convert it into a measuring vehicle. The chassis of the wheelchair as well as the wheels and the load (weight in the wheelchair) will be determined experimentally, as a first step. It seems interesting to choose the chassis and wheels so as to minimize suspension and damping, with a view to obtaining a highly sensitive measuring device.
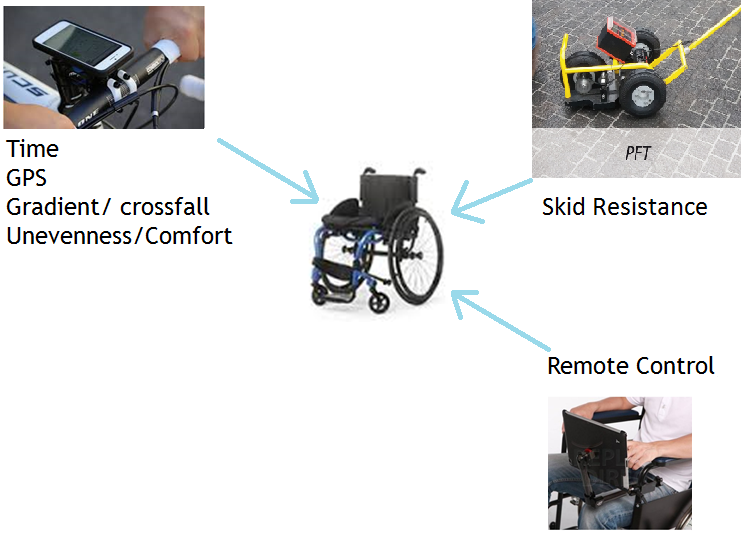
Figure 1.4.7.2: Basic concept (Source: BRRC)
A smartphone is fixed onto the chassis and the following parameters can be measured:
In 2016, a first prototype (V0) was developed by the CRR. This was materialized by a wheelchair on which smartphones containing a GPS and an accelerometer had been fixed (equipment integrated by default in all smartphones). This equipment provided figures concerning the comfort of the coating (rating out of 10). This comfort is evaluated via the accelerometer which will measure the vertical accelerations generated by the surface of the coating on the wheelchair and therefore in fine on the user. In order to measure also the adhesion of the coating, a complementary tool available to the BRRC has been used: the Portable Friction Tester (PFT - more information available on www.brrc.be/fr/article/f1301_06 and www.vti.se/en/Publications/Publication/road-marking-friction_669533).
At the end of 2016, surveys were carried out with this prototype and the PFT tool on eleven "test" sites located in the city center of Brussels, each with a different coating: two asphalt, two concrete and seven natural stone .
In April 2017 and in collaboration with Brussels Mobility, the adherence and flatness of these eleven sites were then evaluated by different users during a morning organized by the CRR. The objective of this approach was to verify if the results obtained by the measuring equipment, reflected the feeling of pedestrians. In total, twenty-eight participants took part in this field exercise: eighteen valid pedestrians and ten people with reduced mobility (people in wheelchairs, people walking with difficulty, people with visual impairments). A test sheet was completed by each participant and for each site.
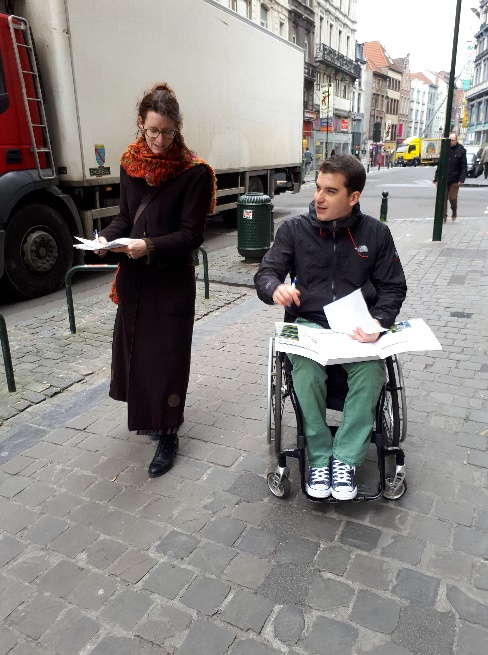
Figure 1.4.7.3: Evaluation of the footway by user (Source: BRRC)
At the end of the analysis and as illustrated in the graph of Figure 1.4.7.4, a classification of the sites according to the comfort of the coating perceived by the users was carried out. The classification obtained from the subjective data collected by the twenty-eight users (light blue on the graph), compared to that obtained with the encrypted data collected by the prototype (dark blue), shows that a correlation exists on this notion of comfort.
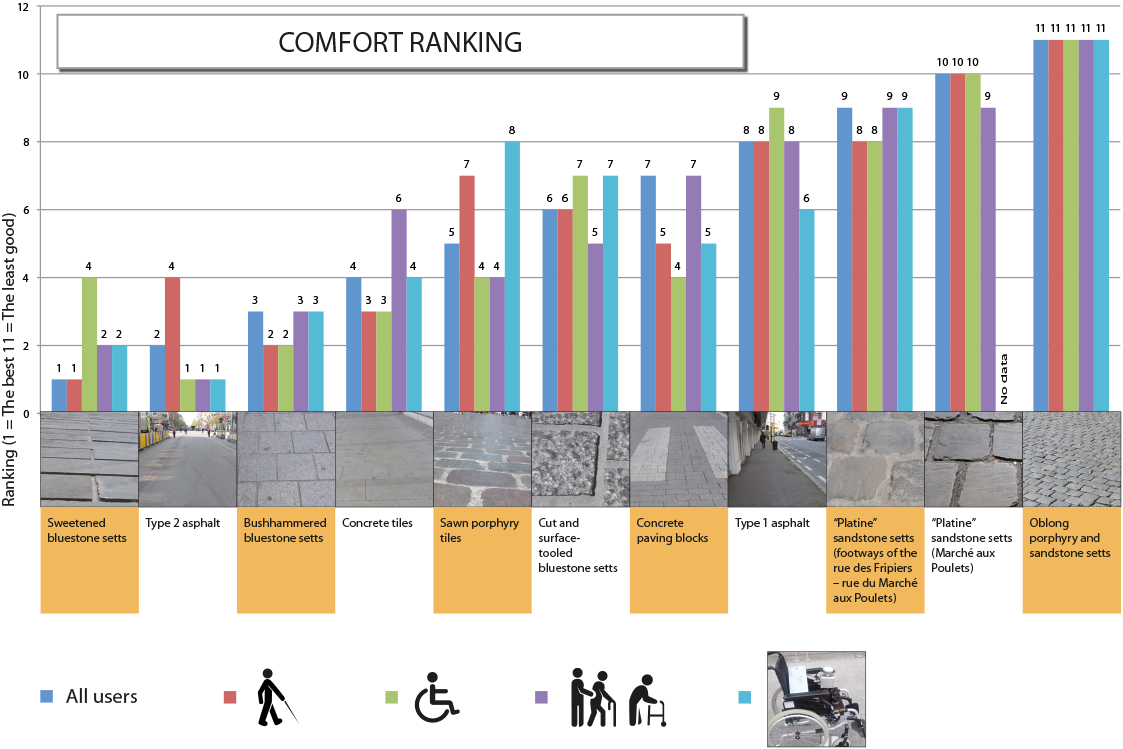
Figure 1.4.7.4: Comfort ranking (Source: BRRC)
Encouraged by this encouraging observation, the BRRC decided during the summer of 2017 to develop a second prototype (V1) with several objectives:
Presented in preview on the stand of the BRRC at the Belgian Road Congress in Brussels at the beginning of October 2017, this equipment allows to measure continuously and in a "geolocated" way the comfort and the longitudinal and transversal slopes of the sidewalks and other pedestrian spaces. The measurement of adhesion can currently not be performed by this equipment and always requires the use of additional equipment (PFT tool for continuous measurement (tests in progress), SRT pendulum (Skid Resistance Tester for point measurement). This second prototype and the sensors that compose it are shown in Figure 1.4.7.5.
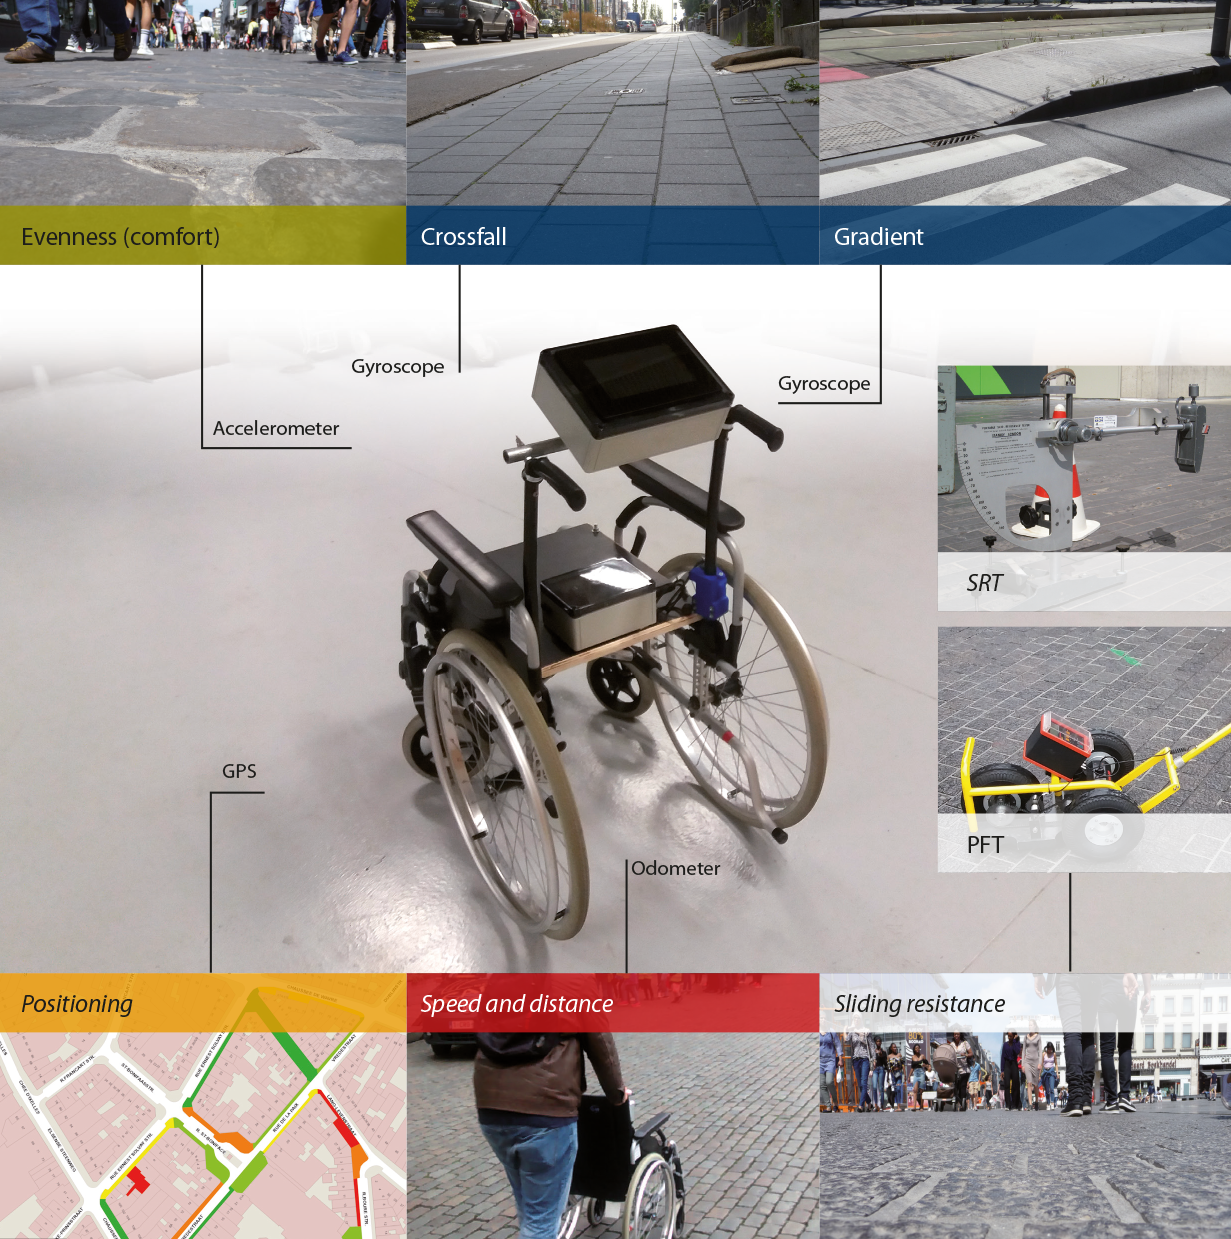
Figure 1.4.7.5: Second prototype (Source: BRRC)
In summer 2018 we have surveyed a complete city center in Belgium with the measurement equipment. In the map beneath, you can find the results on the comfort of the footways for the complete city center.
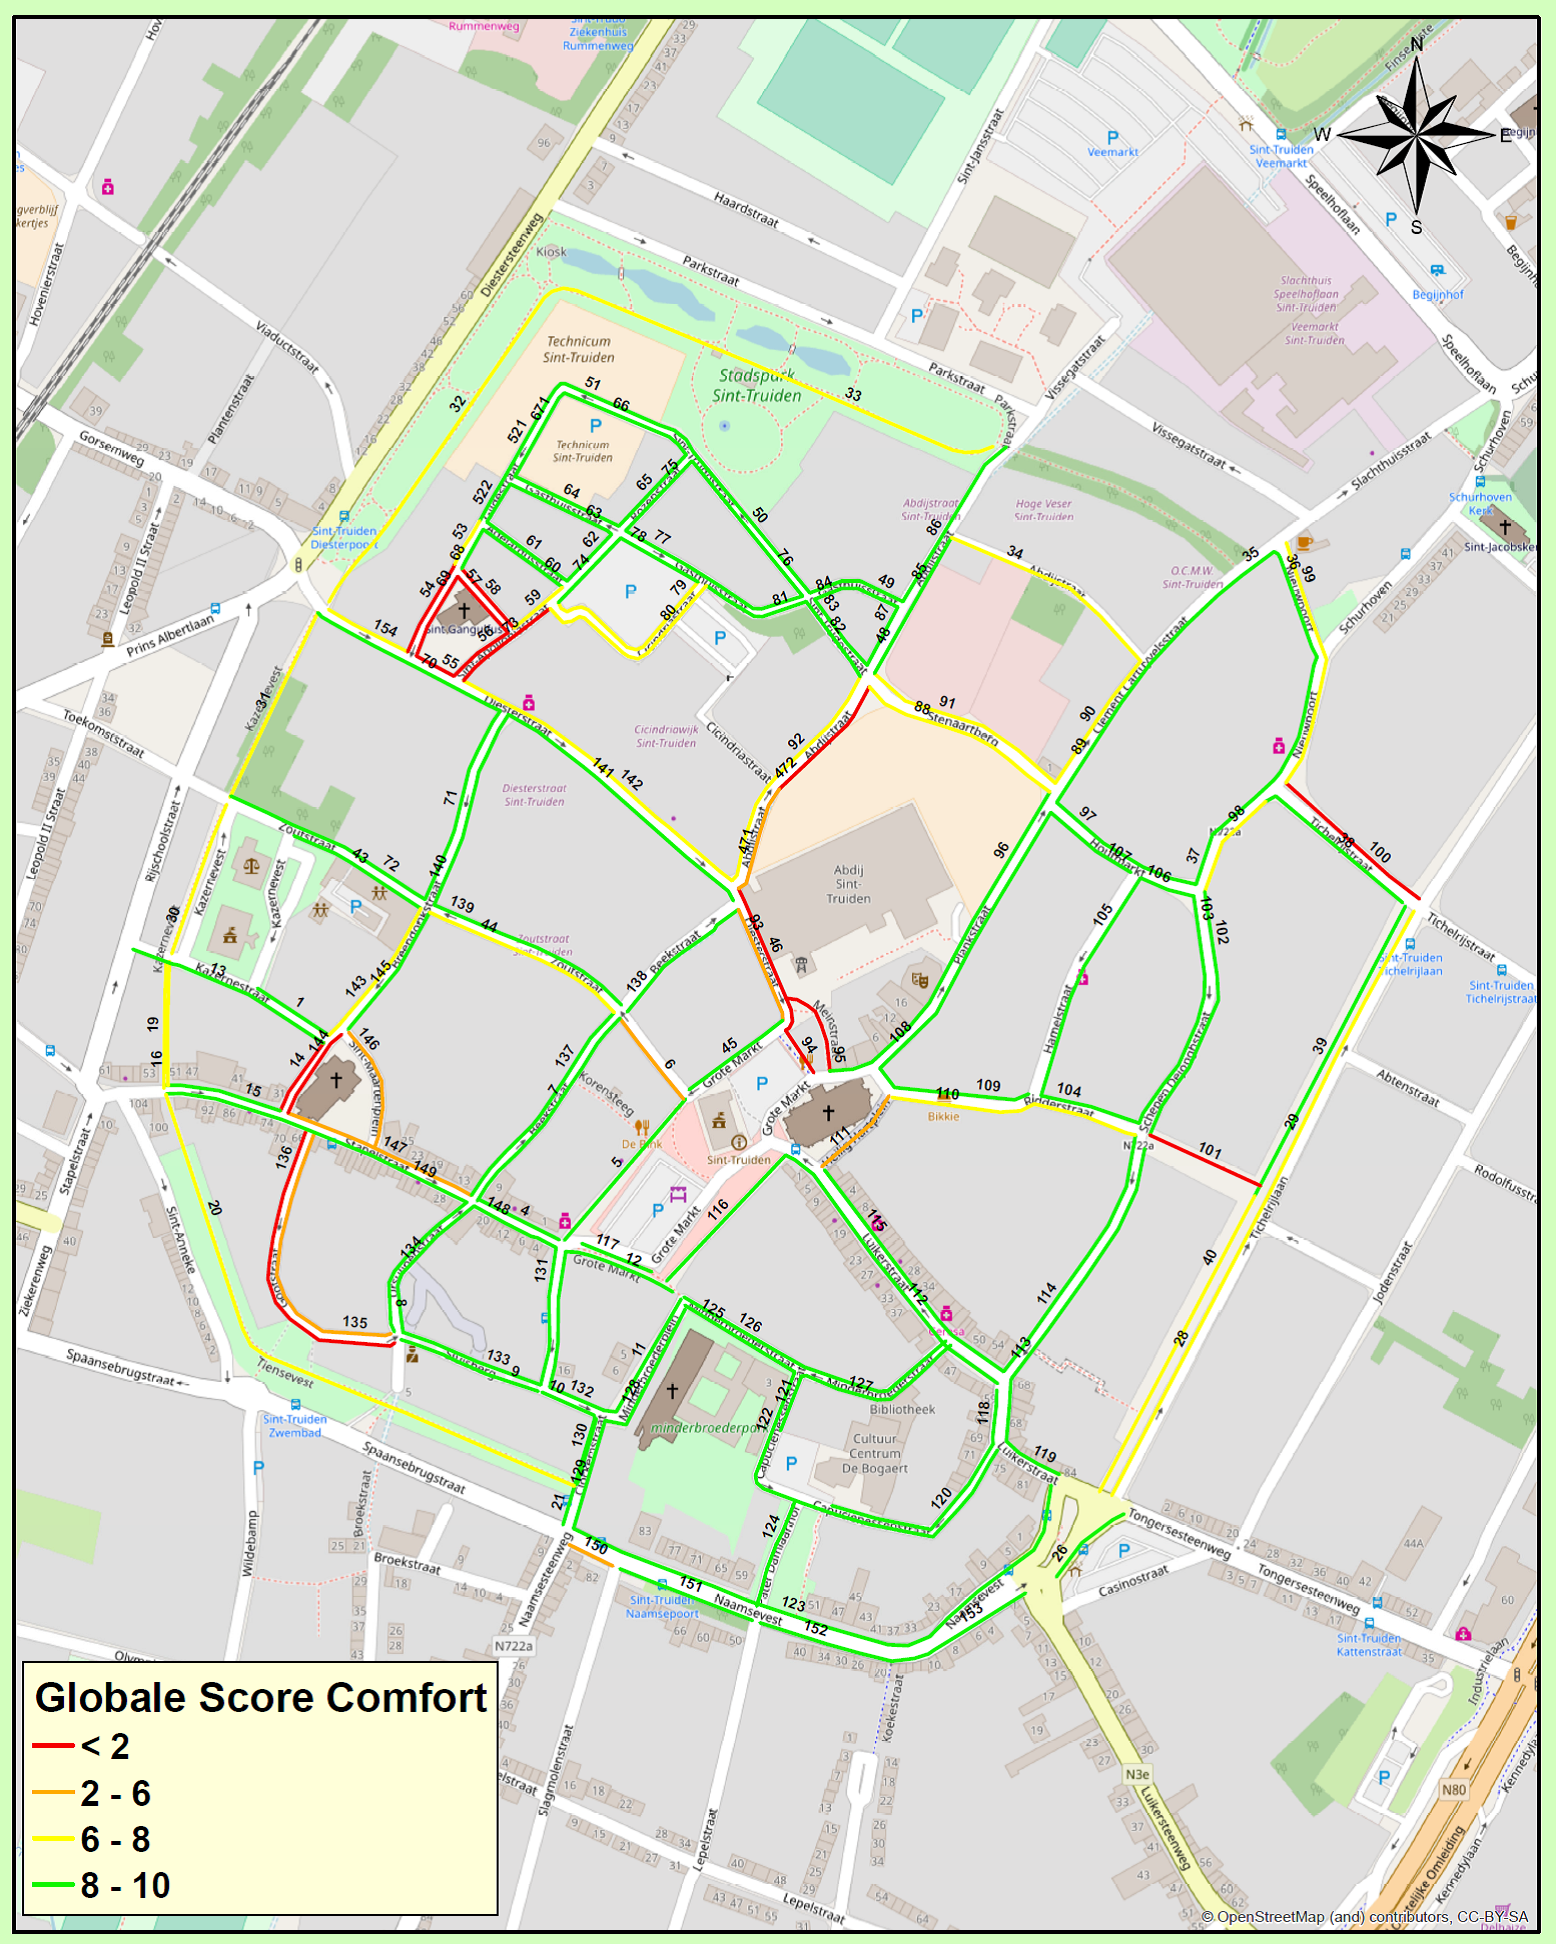
Figure 1.4.7.6: Comfort assessment for a whole network (Source: BRRC)
This functional equipment is now integrated in the family of roadside inspection equipment available at the BRRC. It can be used to respond to external technical assistance specifically oriented to the quality of use of pedestrian coatings.
The road administrator will be able to categorize different pedestrian coatings based on comfort (wheelcair equipment) and adhesion measurements (PFT). The following figure shows a decision grid that can be used to trigger an intervention. In the green area (VG Very Good) we have a pedestrian coating with very good scores on comfort and adhesion. In the red zones we have at least one problem (adhesion or comfort). Based on this we can choose a substantiated measure.
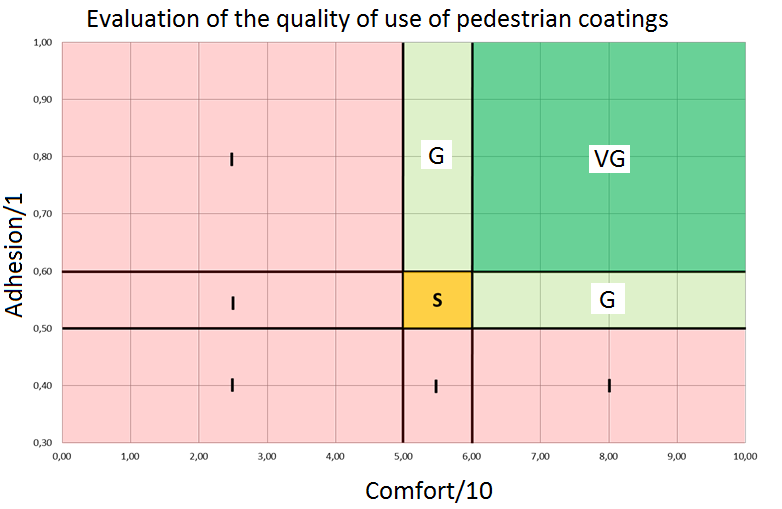
Figure 1.4.7.7: Evaluation grid for footway coatings (Source: BRRC)
The concept presented above has been tested in actual practice. We will explore different strategies to get this equipment on the market.
Walking and cycling are green transport modes which will get more attention in future. The quality of footways is not always very good. In most cities, road managers have difficulties in estimating the quality level of their footway network. Maintenance planning and budgeting are mostly based on ad hoc repairs. With this complete evaluation method administrators will be able to manage this asset in a more efficient way and with a well determined approach.
After this inspection, the administrator will have a good overview of the quality of his footway network. He will easily find those footways who need a maintenance. On the other hand, experience will be gained for different types of pavements for footways. With this experience, the administrator will be able to decide wich type of pavement is suitable for which footway.
Tim Massart, 2018. The Belgian Road Research Center strives to develop a Tool that measures the usability of pedestrian surfacing/ Routes/Roads n°377 – 2nd quarter 2018. Location.