
This first section of the manual deals with some of the core components and enablers of asset management an organization should take into account when considering the adoption of a formal asset management approach. The section is made up of four chapters: Implementation, Organization, Strategy and Performance Management.
The initial chapter sets the context for the application of asset management, and describes the recommended procedure for its implementation. This procedure comprises the following steps: a) Establish the organization goals and objectives; b) Undertake a self-assessment and gap analysis; and c) Identify improvement actions. Linked to self-assessment, the chapter mentions some of the maturity models that can be used as a reference to evaluate the road organization competencies.
A successful implementation of asset management requires the road organization to have a proper structure and capacity to allow for the required work and information flows. The above is discussed in chapter 1.2, which includes various topics related to adapting the organizational structure to support asset management, namely leadership and culture, a further description of self-assessment, asset management champions, asset management roles and competency requirements.
Asset Management is a long-term, strategic process of managing road assets effectively during their life-cycle. Therefore, the development of an asset management strategy is one of the key activities involved in adopting the asset management framework. Chapter 1.3 explains what an asset management strategy is, the range of aspects it should cover, how it can be prepared, and who should be responsible for this activity within the road organization.
Finally, chapter 1.4 describes another core component of asset management: the performance management framework. This component is needed to determine if the road organization is in the path to achieving the objectives set out in the asset management strategy. As described in this chapter, development of a performance management framework involves translating the organization objectives into the required levels of service, and linking the above with performance measures and targets for monitoring progress in reaching the desired outcome.
The management of the road infrastructure assets is a big challenge for many road organizations. The implementation of asset management and asset management tools will help them to fulfill the current and future requirements in a repeatable and sustainable way.
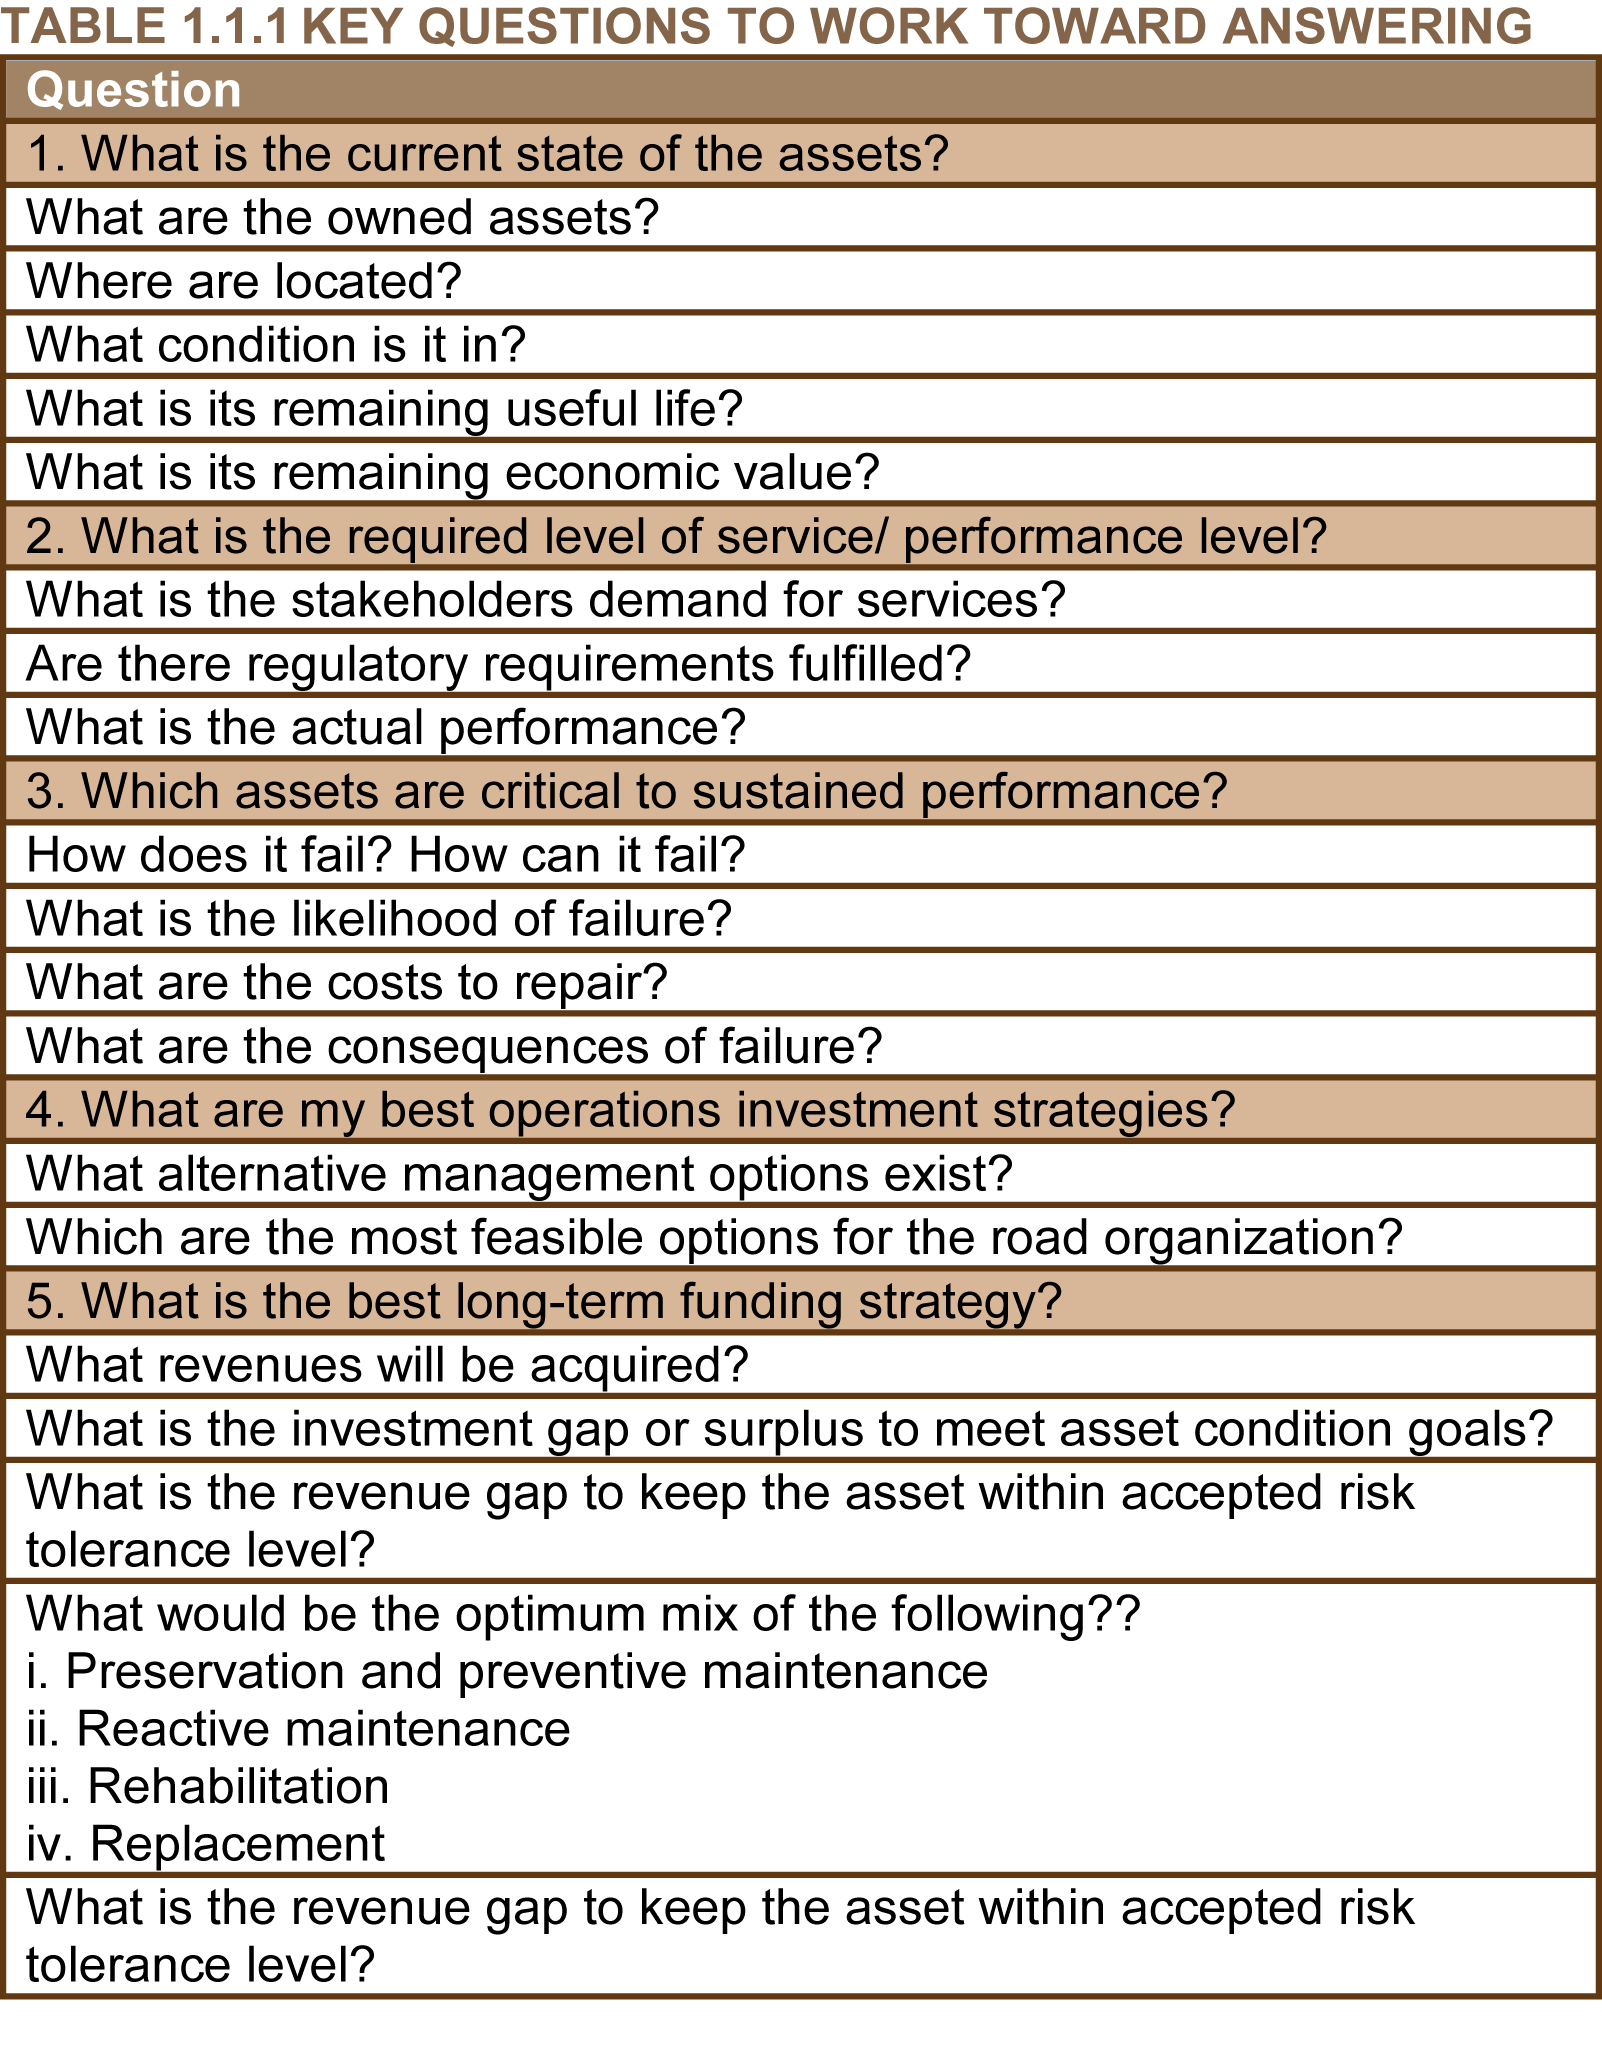
There are different questions to be answered in the different management processes, like “What is the current state of assets, the level of service and performance? What are the best maintenance strategies? What are the necessary funding strategies to achieve the goals? ”. The benefit of having a holistic asset management approach is manifold, including different aspects like financing and investment, planning, environmental impacts, assessment of maintenance needs, etc.
For a successful implementation different steps are suggested. This includes the establishment of goals and objectives in line with the vision and the expectations of the different stakeholders, the self-assessment and gap analysis, and, of course, necessary steps for an improvement of the current situation.
Road organizations are facing many of the same challenges and could benefit from the adoption of asset management principles. These challenges include increased demand from stakeholders, reduced budgets and greater challenges to deliver value for money and transparent and auditable processes for investment. However, many organizations lack the resources and/or experience to initiate and grow an asset management program. Therefore, PIARC has developed this manual to support road organizations in their implementation of asset management
There are many factors influencing the way road organizations make decisions about managing their road assets. The traditional way of doing business, which postpones repair activities until major deterioration occurs, is no longer sustainable. It is too expensive and it erodes the value of these important assets. As the costs of operating and repairing roads continue to increase and available funding decreases, it has become more difficult for governments to meet the demands of an aging infrastructure while dealing with public expectations to provide the same level of service for less money. The public also demands transparency and accountability from road organizations, requiring justification for decisions and responsibility taken for results. The typical way of doing business, which frequently relied on repairing the worst roads first after extensive deterioration has occurred, does not work. It is an expensive and ineffective way of maintaining road assets. It allows road to depreciate, resulting in a loss of asset value as well as asset conditions far below those expected by the traveling public. Therefore, in today’s economic environment, organizations need to approach the management of road assets differently than in the past. There can be substantial consequences associated with continuing to manage assets ineffectively, including not providing safe and efficient movement of people and goods, all of which will ultimately cost the public more.
No matter the size of the road organization, the size of the road network, or the maturity of the road organization with regard to data, analysis and tools available, an asset management framework will support a road organization in effectively managing its assets. Asset management is sometimes confused with pavement management and bridge management computer systems. It needs to be stressed that asset management is not a computer program, nor is it a rigid protocol. It is a set of business processes for decision making that encourages continuous improvement in infrastructure management. Asset management provides to road organization a framework to communicate its approach to its workforce, to external stakeholders including politicians, to the media, to its external partners and to the public. Asset management is a framework leading to improved management of infrastructure assets and improved decision making based upon quality information and decision making.
This manual will focus on various levels of a road organizations maturity in undertaking the activities that comprise the asset management framework. The levels of maturity focus on the following:
No matter the size of the road organization, its inventory, or the information and data it has concerning its assets, asset condition and network, the road organization should get started with the information it has.
Step 1: Establish the asset management goals and objectives that align with the agency’s mission, desired outcomes and business strategy. If the road organization does not have a written mission that identifies desired outcomes and a business strategy, this should be developed and shared with stakeholders. It is important to set goals and objectives outside of individual asset classes in order to obtain the broader perspective from stakeholders, including elected officials and the public. (For example, the goal for pavement condition involves those responsible for pavements, but the goals of the condition are developed or supported by politicians and the public.) Getting started, questions to ask may include the following:
Step 2: Undertake a self-assessment and gap analysis to determine the road organization current position across a range of asset management practices and then prioritize areas that need to be addressed to meet the desired position. The most basic self-assessment can be based on the five core questions above; more complex questions pertaining to data, analysis and the use and availability of this information can also be addressed. This information can be used to prioritize weak areas that need to be addressed.
Step 3: Scope the specific improvement actions. It is important to take a holistic view of how asset management relates to the organization’s mission and strategy. Key issues to be addressed include identifying the scope of assets to be included, the framework for decision making, internal business processes, capabilities, data needs and benefits and costs. Road organizations need to look at the way they do business and undertake a self-assessment and gap analysis to assess where they are and what they need to do to better manage their network. This may be a need for additional data, or better sharing of the data, or enhancing processes within the organization. Questions to ask are the following:
Maturity models
The measurements of the degree to which organizations have implemented asset management principles can support organizations in identifying their strengths and weaknesses in relation to their intended goals.
Maturity models can be viewed as a set of structured guidelines that describe how different domains or expert fields of an organization are able to contribute to a set of predetermined organizational outcomes (Volker et al., 2011).
A clear and repeatable definition of the maturity levels is essential for the whole assessment procedure. It is strongly recommended to use a unified scale or categorization within the whole road organization because this enables the managers to benchmark the different asset management sectors and their processes. Of course, the number of categories and the scales should be in coincidence with already existing successful assessment procedures. The referenced literature (e.g. AASHTO, ISO 55000) introduces a 5- to 6-level scale/classification, which requires detailed information about the different processes. Not all road organizations will be able to collect and assess the necessary information. Thus, and as a starting point a minimum of 3 maturity levels should be used.
This Manual introduces a matrix to measure the maturity level of an asset management organization, which offers 3 maturity levels for the following asset management dimensions: management (organization, strategies and performance), data and modelling (inventory, monitoring, risk and lifecycle planning), planning (management and financial plan, asset evaluation and programming) and application (management tools and communication). The maturity levels are described briefly in the following table 1.1.2 while the following section includes a more detailed description of each dimension.
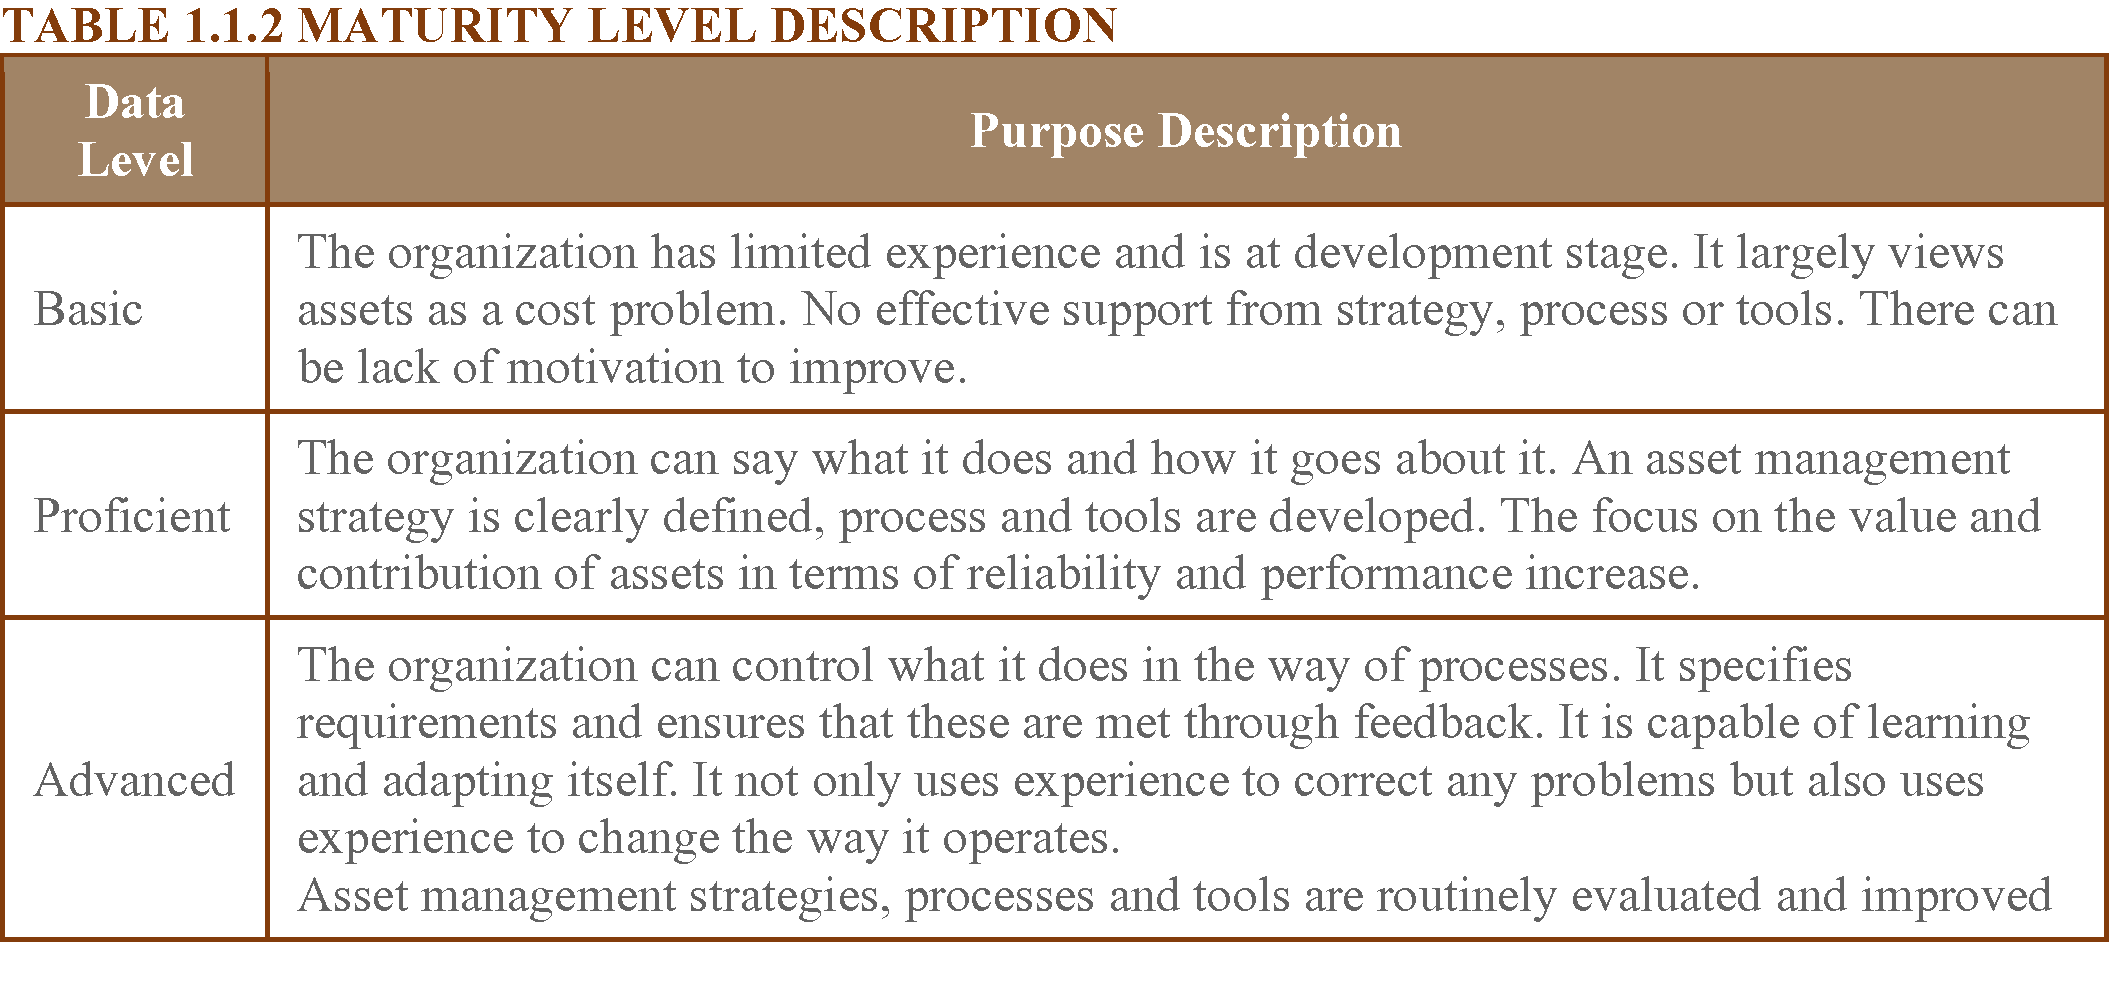
The 3 maturity levels of this manual can be extended easily subject to the availability of necessary input information.
- The Self-Assessment Methodology Plus, IAM Institute of Asset Management, June 2015, https://theiam.org/knowledge/Knowledge-Base/sam/
- AASHTO Transportation Asset Management Guide—A Focus on Implementation, American Association and Transportation Official, June 2013, http://www.fhwa.dot.gov/asset/pubs/hif13047.pdf
- Volker, L.; Van Der Lei, T. E. & Ligtvoet, A. Developing a maturity model for infrastructural asset management systems. In: Beckers, T. & Von Hirschhausen, C., eds. 10th Conference on Applied Infrastructure Research - Infraday 2011, 7-8 October 2011 Berlin. TU Berlin. http://www.infraday.tu-berlin.de/fileadmin/fg280/veranstaltungen/infraday/conference_2011/papers_presentations/paper---volker_vanderlei_ligtvoet.pdf
- Scott, R., Plano, C., Nesbitt, M. (2016). Transportation Performance Management Capability Maturity Model. U.S. Department of Transportation, Federal Highway Administration Office of Transportation Performance Management, Washington, DC. https://www.tpmtools.org/wp-content/uploads/2016/09/tpm-cmm.pdf
The following case studies are presented in this chapter:
CASE STUDY 1: Successful implementation of a Road Assets Management tool for the roads of Madrid Region
CASE STUDY 2: Learnings from implementation of Road Asset Management System in Assam, India
CASE STUDY 3: Asset management gap analysis and self-assessment effort of the US Federal Highway Administration (FHWA)
CASE STUDY 4: Self-assessment using the IAM toolkit
MIGUEL NÚÑEZ, Consejería de Transportes e Infraestructuras de la Comunidad de Madrid, Spain
Reliable data and sound analyses are necessary to manage a road network in a cost-effective manner. Nowadays, appropriate systems and equipment are available for gathering data and analysis. Based on sound analyses, properly financed road improvement plans can be estimated. It is possible to outline different improvement scenarios on the basis of given priorities, e.g. reduction of fatal accidents, and financial constraints. The process should blend managerial and technical perspectives, as is shown with an empirical illustration from the road network of the Madrid Region in Spain.
For a civil engineer the key motivation, in regards to his expertise, is undoubtedly to put it at the service of companies and public organisations, but the main goal is ultimately the service provided to the citizen. This would, no doubt, be envisioned in the case of road network maintenance. Clearly, our work must be done with care and perseverance in order to achieve the best possible results.
What it is set out below reveals the integrated vision that the Department of Communications and Transport of the Region of Madrid has followed in developing different type of contracts in order to obtain the best results, both technically and economically.
So, the real case of the Madrid Region will be described to exemplify how the technical and economic/administrative perspectives can be arranged in order to achieve the best viable result in view of the specific challenge that is road assets management. There has been a significant reduction in the budget for new infrastructures in recent years, with investments allocated to the conservation of the existing ones. We have a highly developed infrastructure network thanks to the heavy investments in previous years.
The new construction activities focus on obtaining improvements in road safety, through remodelling of intersections, construction of roundabouts, elimination of sections of accident black spots, improvements of links, improvements of routes, construction of bus stops, improvements in pedestrian crossings, etc.
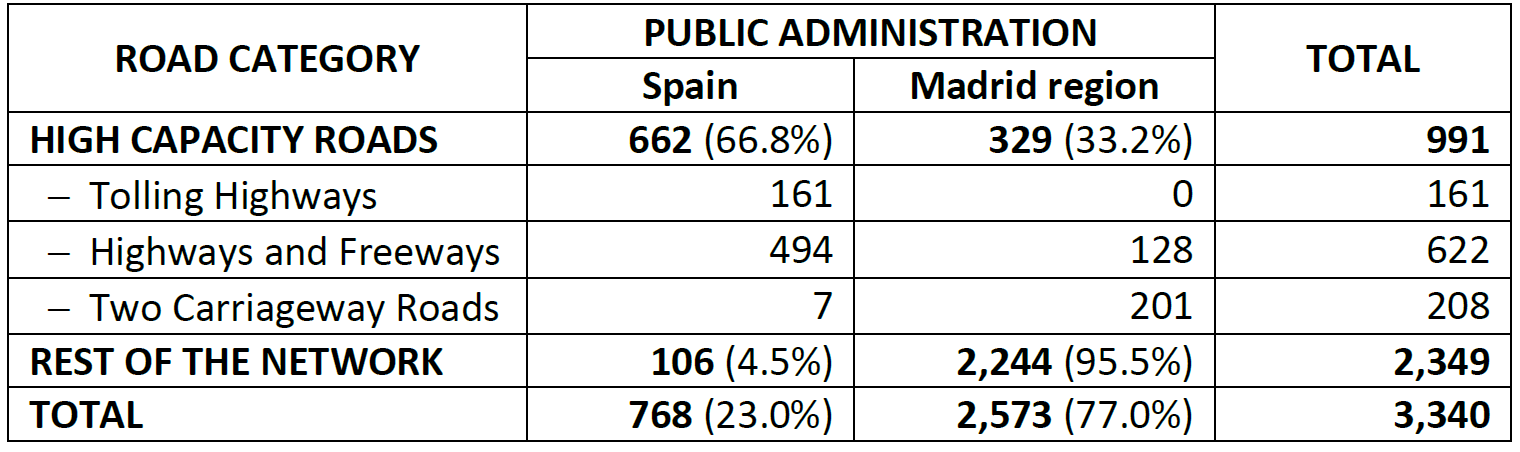
The road network of the country of Spain and the Region of Madrid is divided as follows:
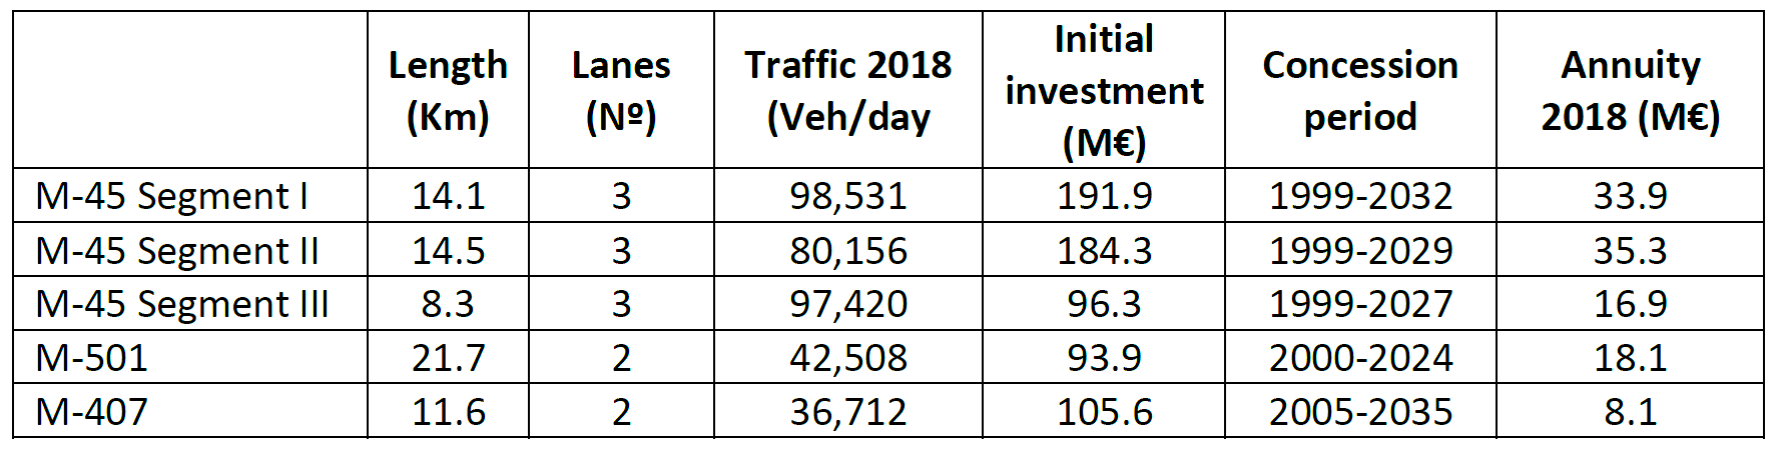
Table 1.1.4.1: Description of Spain and Madrid networks
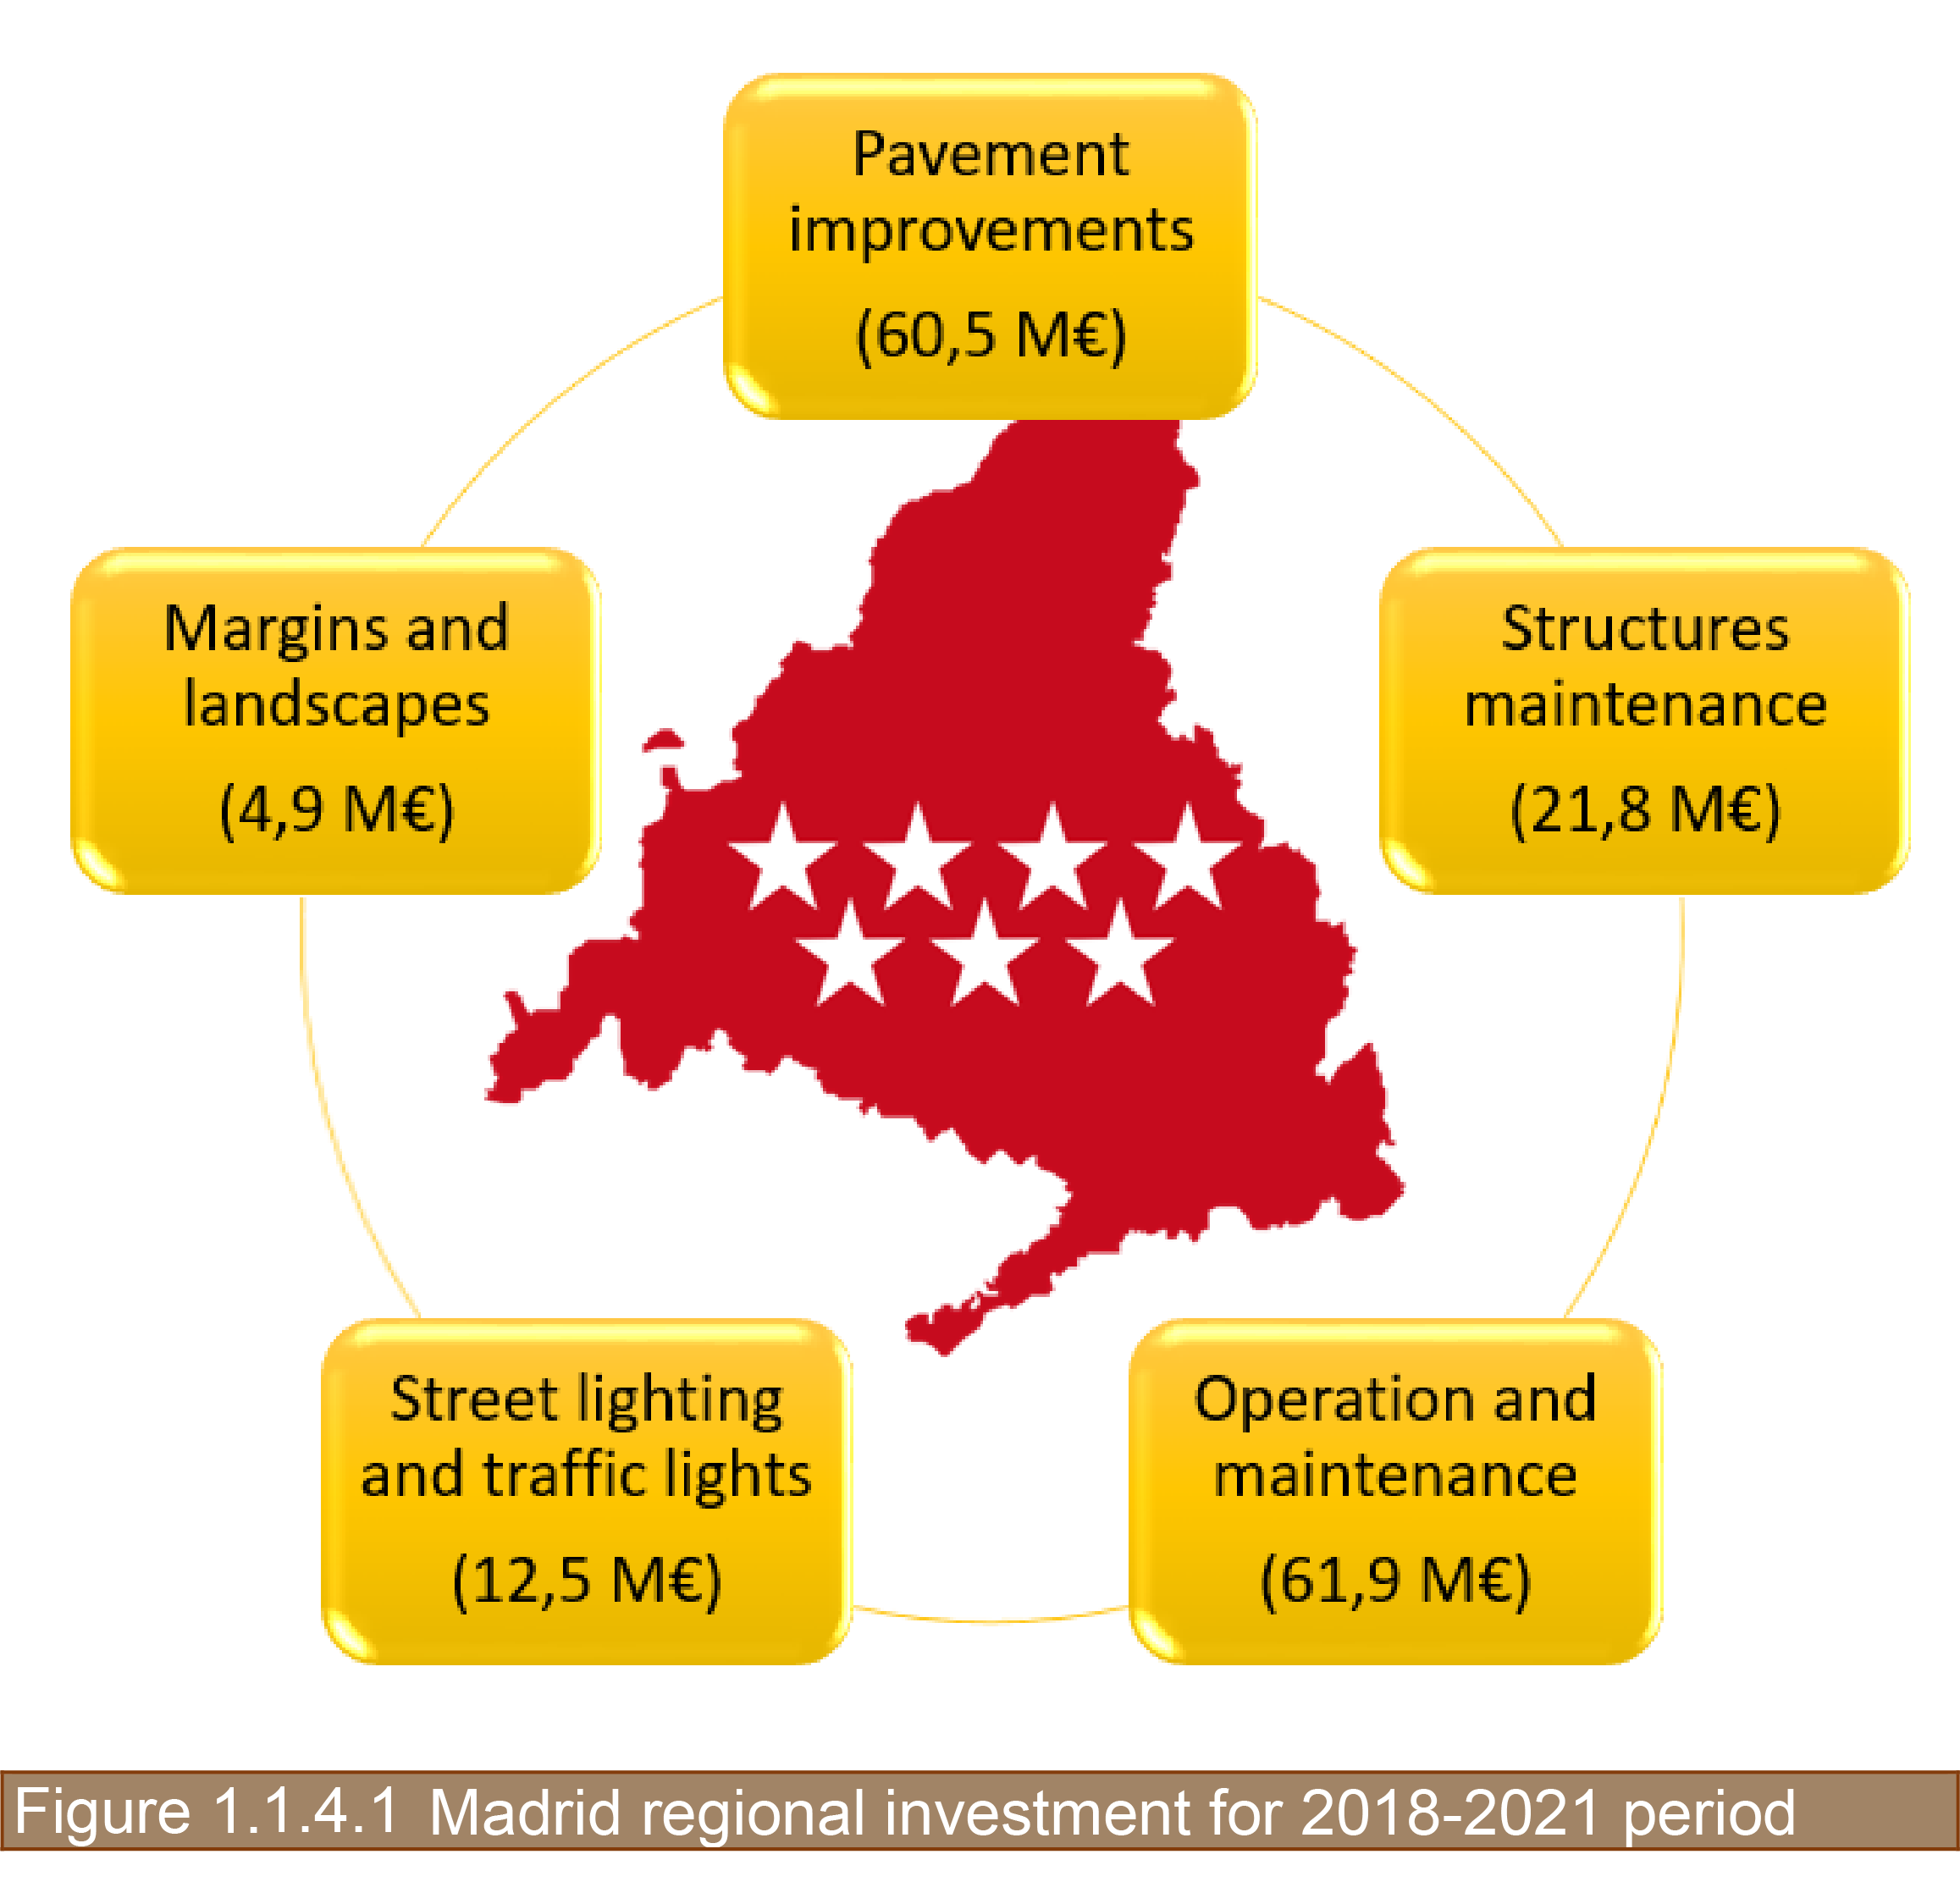
The Roads Maintenance Strategy in Madrid region has allocated more than 160 million euros during the 2018-2021 period, divided into five main items:
With regard to improving the pavements, two contracts are being implemented. One entails the visual inspection of the entire network and a second contract includes the survey of the pavements using high-performance equipment.
The entire road network of Madrid region managed by the Department is classified into:
By means of the first contract, the visual inspection of the entire network, metre by metre, is being carried out and its level of cracking defined in terms of:
The surface state of the network is classified by analysing these aspects, taking five cracking levels into consideration. Thus, the Madrid Region's network has been classified as follows:
These are:
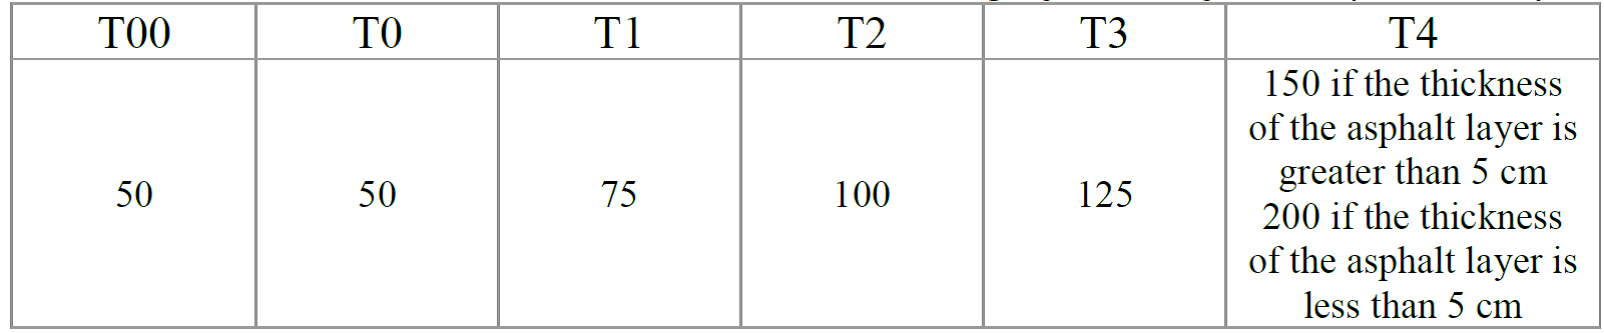
Table 1.1.4.2: Limit values for deflection based on the category of heavy traffic (in mm/100)
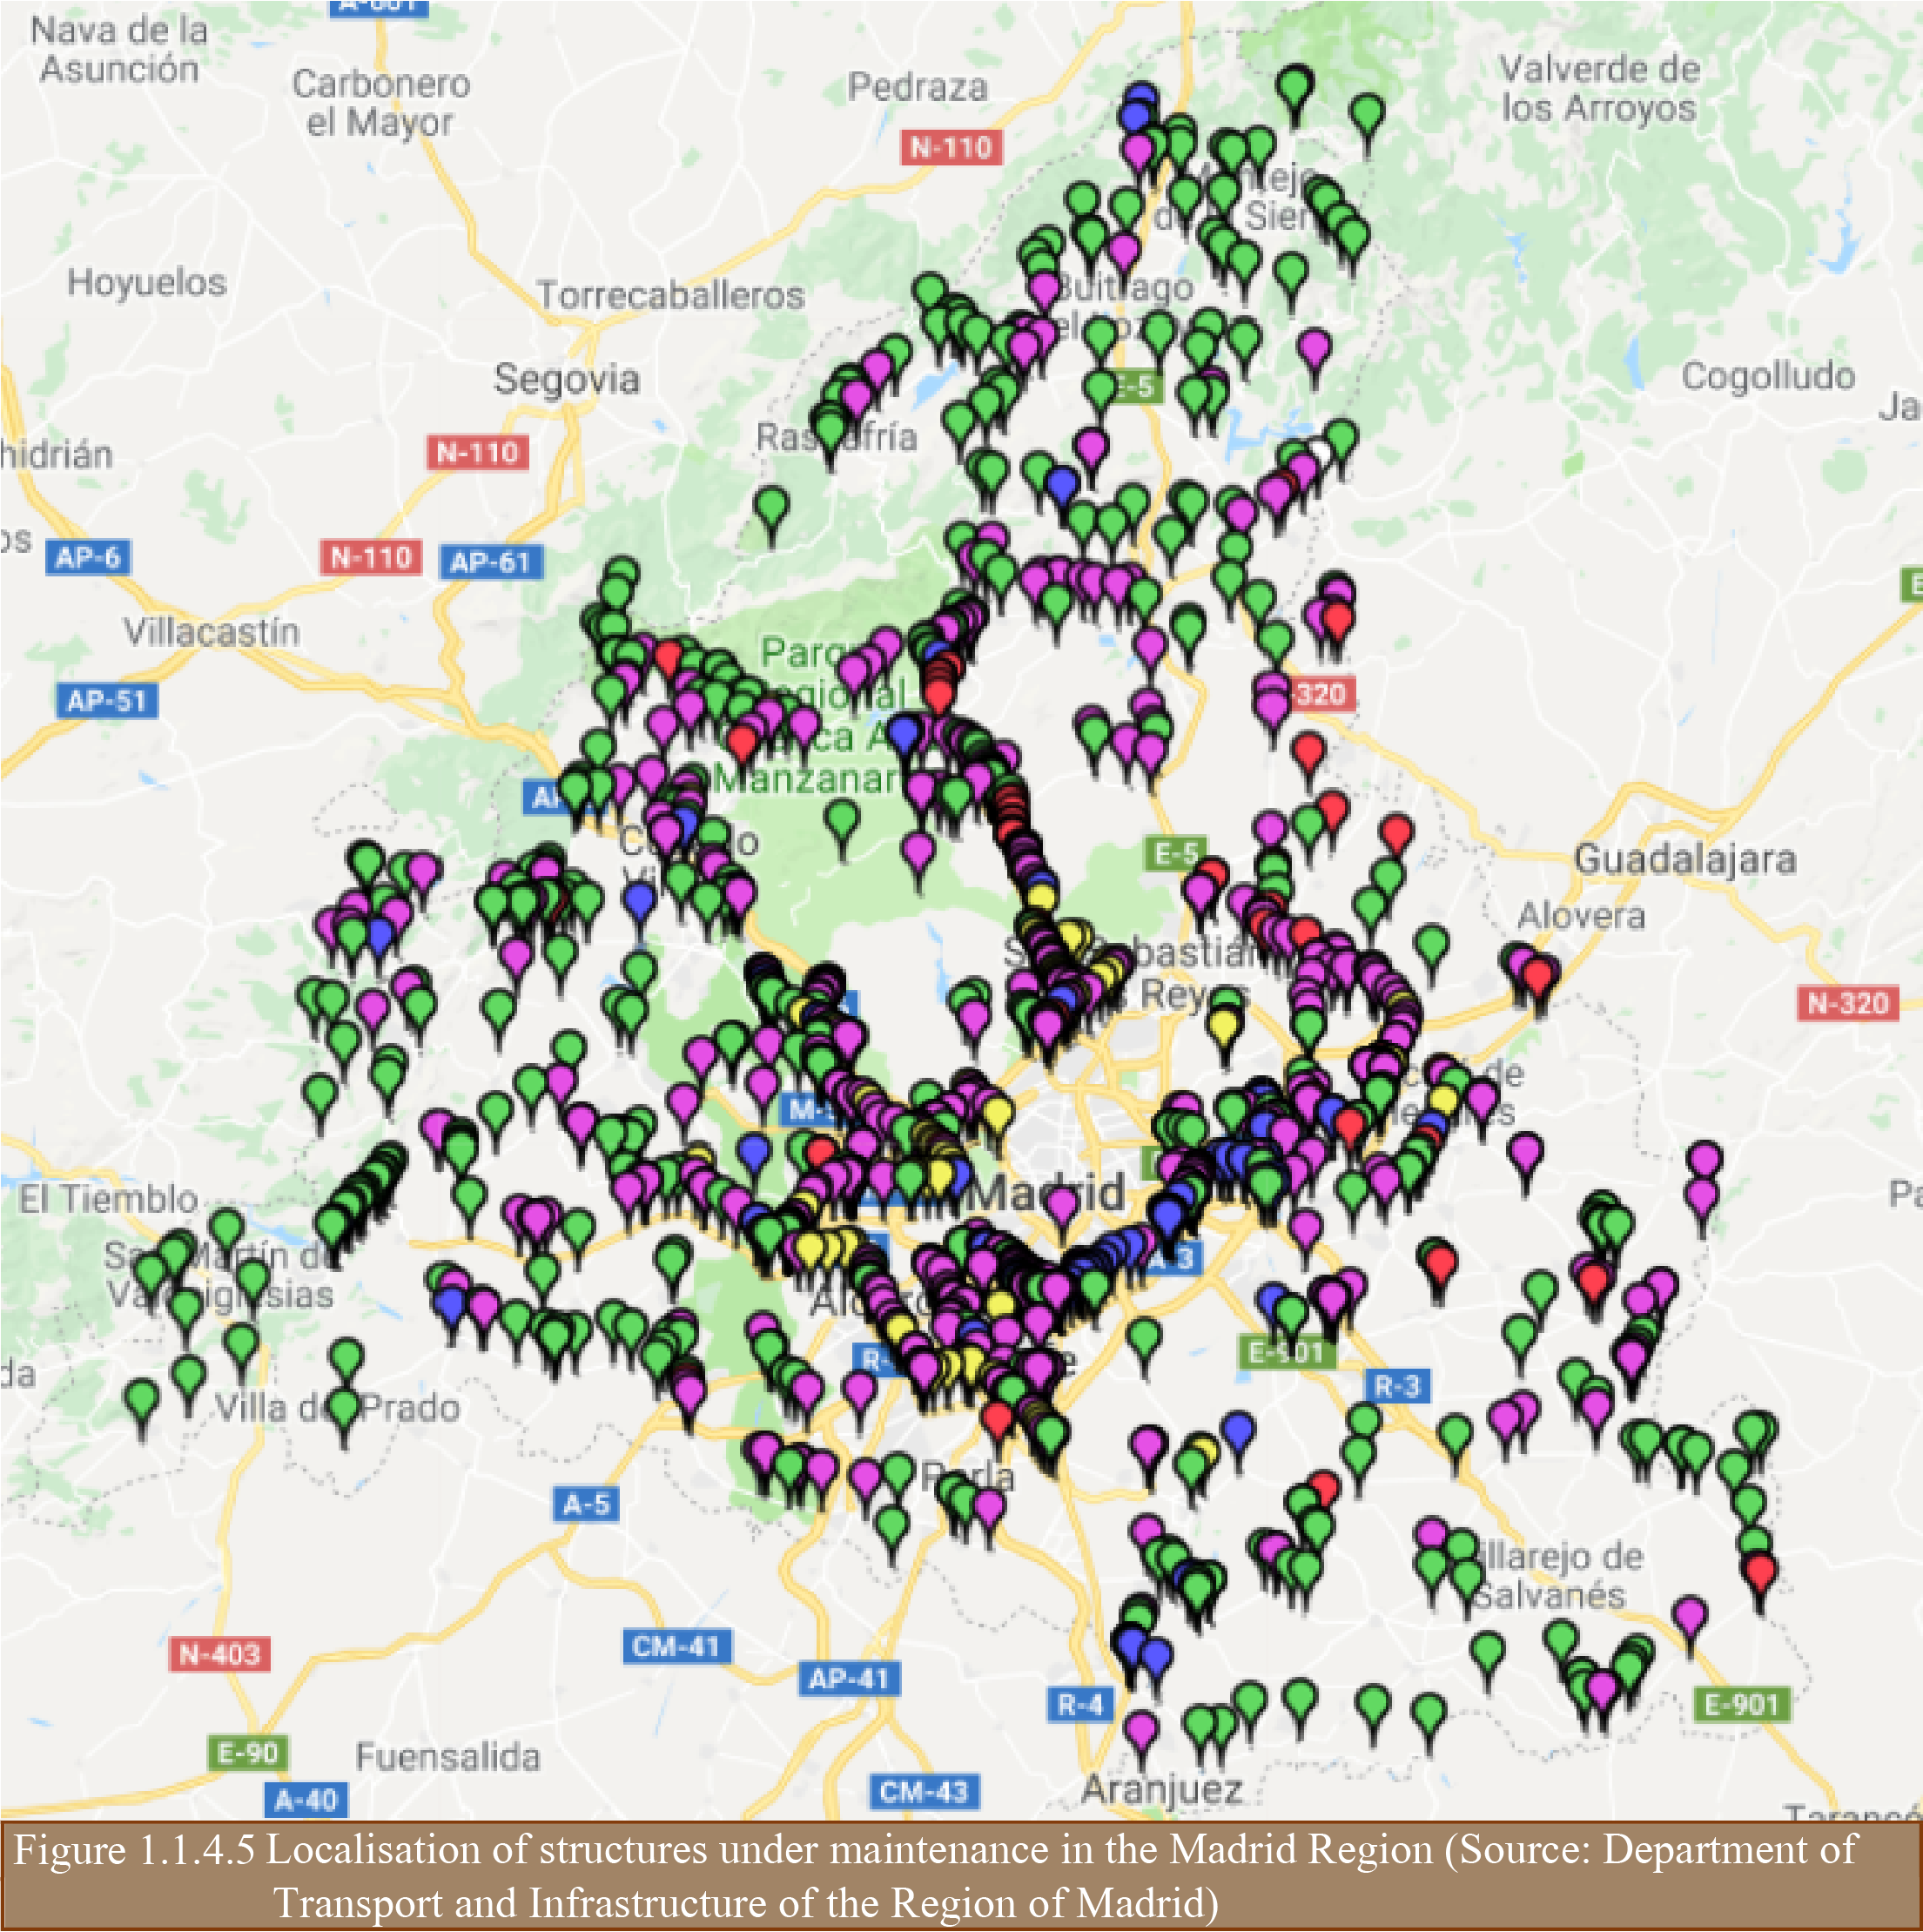
The information obtained in the condition survey contract, as well as the information resulting from the visual inspection contract being carried out parallel to the condition survey contract, will be recorded in the management system used by the Department since 2006 for managing the information on its road network. This system, called ICARO, is an effective and easy-to-use tool that allows both the technicians and Department managers to efficiently manage the available resources, with the main objective of carrying out preventive conservation of the Madrid Region’s road network.
To achieve this objective, it is absolutely necessary that the information to be analysed is accurate. For this reason, before loading the survey data into the management system, the company RAUROS is carrying out the coherence analysis described previously. This way, by disallowing the invalid survey data, the information ultimately used by the Department's technicians and managers to take decisions is completely reliable.
These activities are:
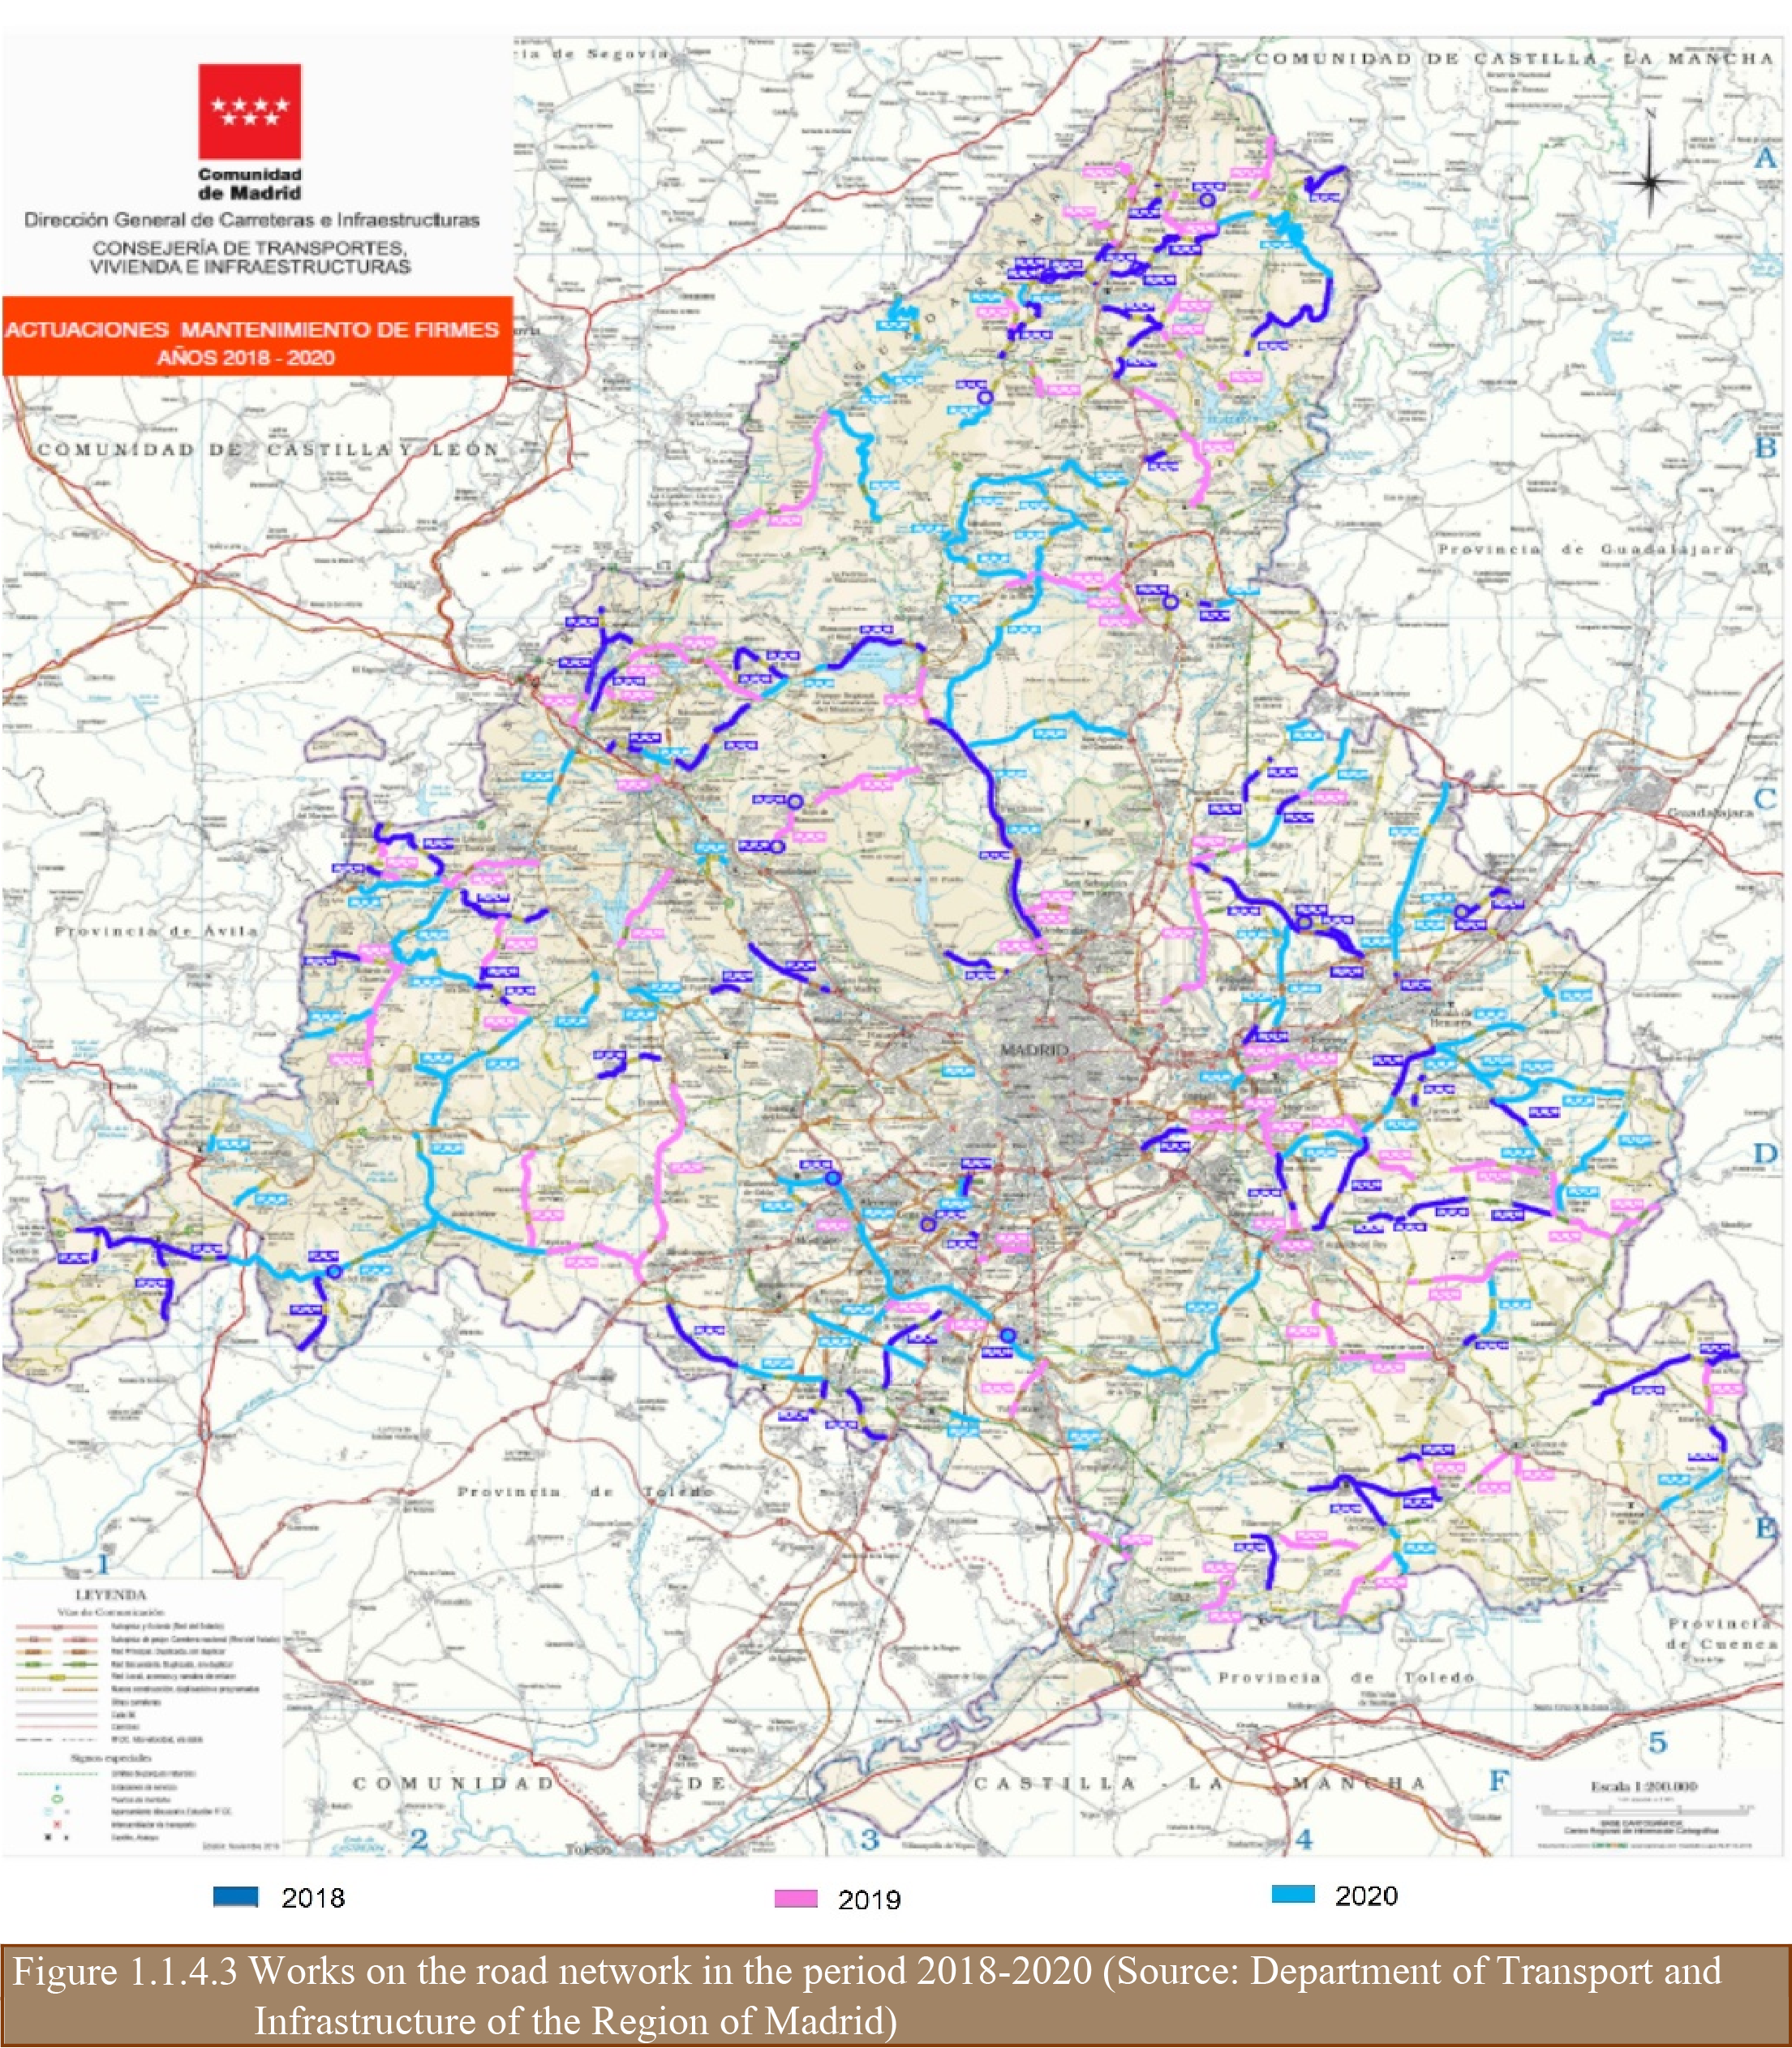
Thus, the work carried out or planned to be carried out in the 2018 to 2020 period is reflected in Figure 1.1.4.3.
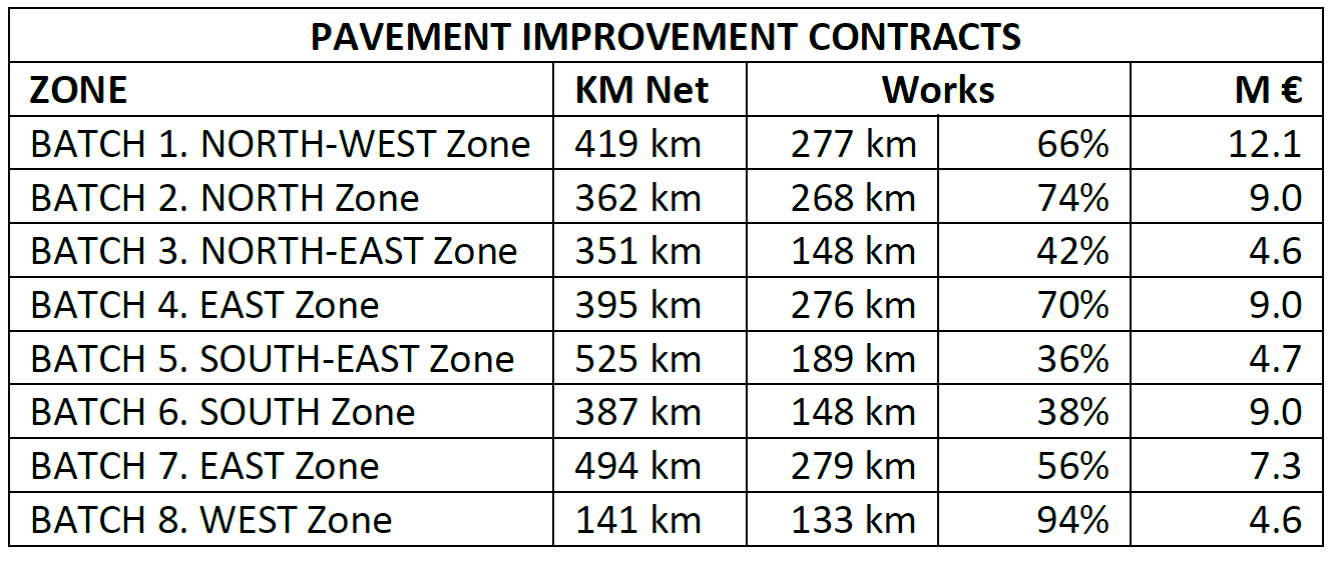
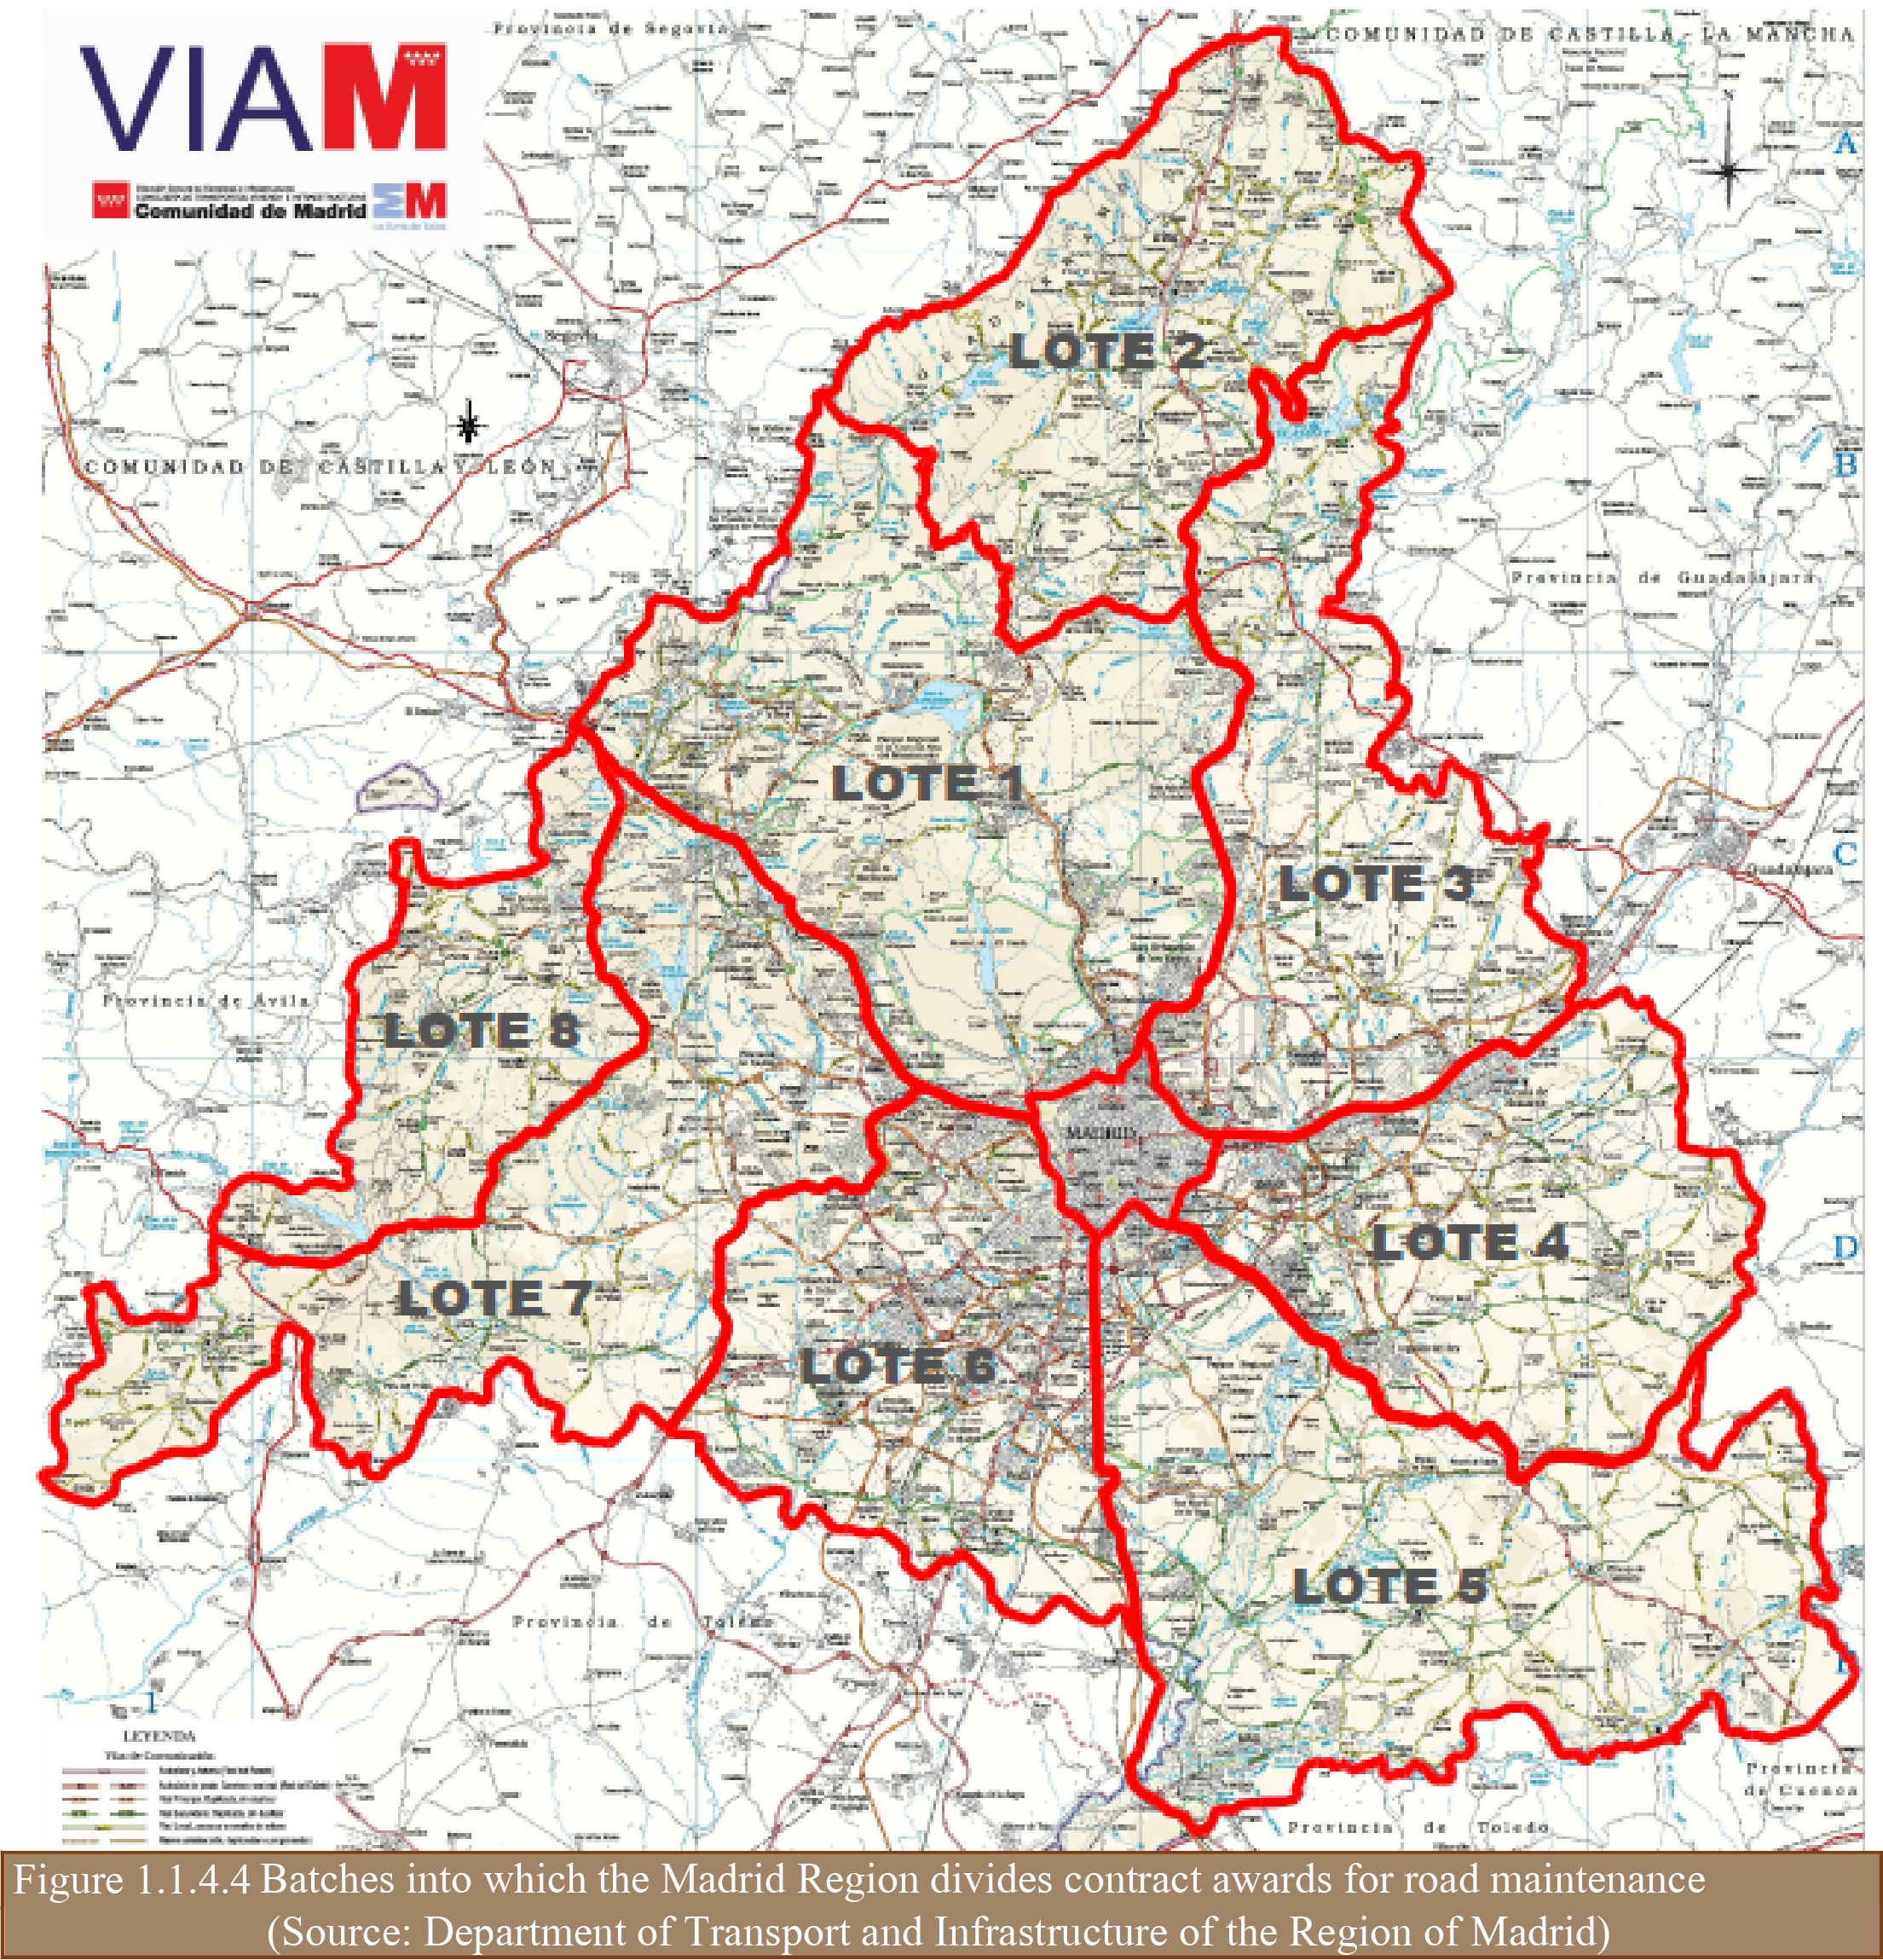
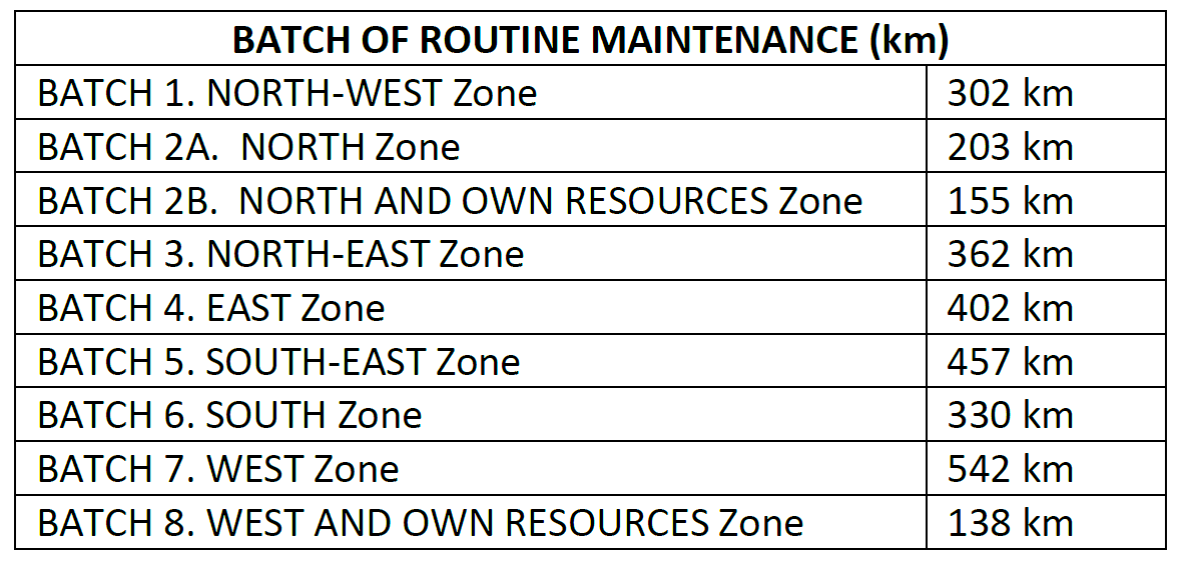
This work is awarded by tender in contracts for the rehabilitation services contracts by batches, awarding a maximum of two batches to the same rehabilitation company.
These batches correspond to the eight zones into which the Region of Madrid is divided in terms of road maintenance. Table 1.1.4.3 describes the length at which action must be taken and the budget allocated for each of the batches.
Table 1.1.4.3: Pavement improvement contracts
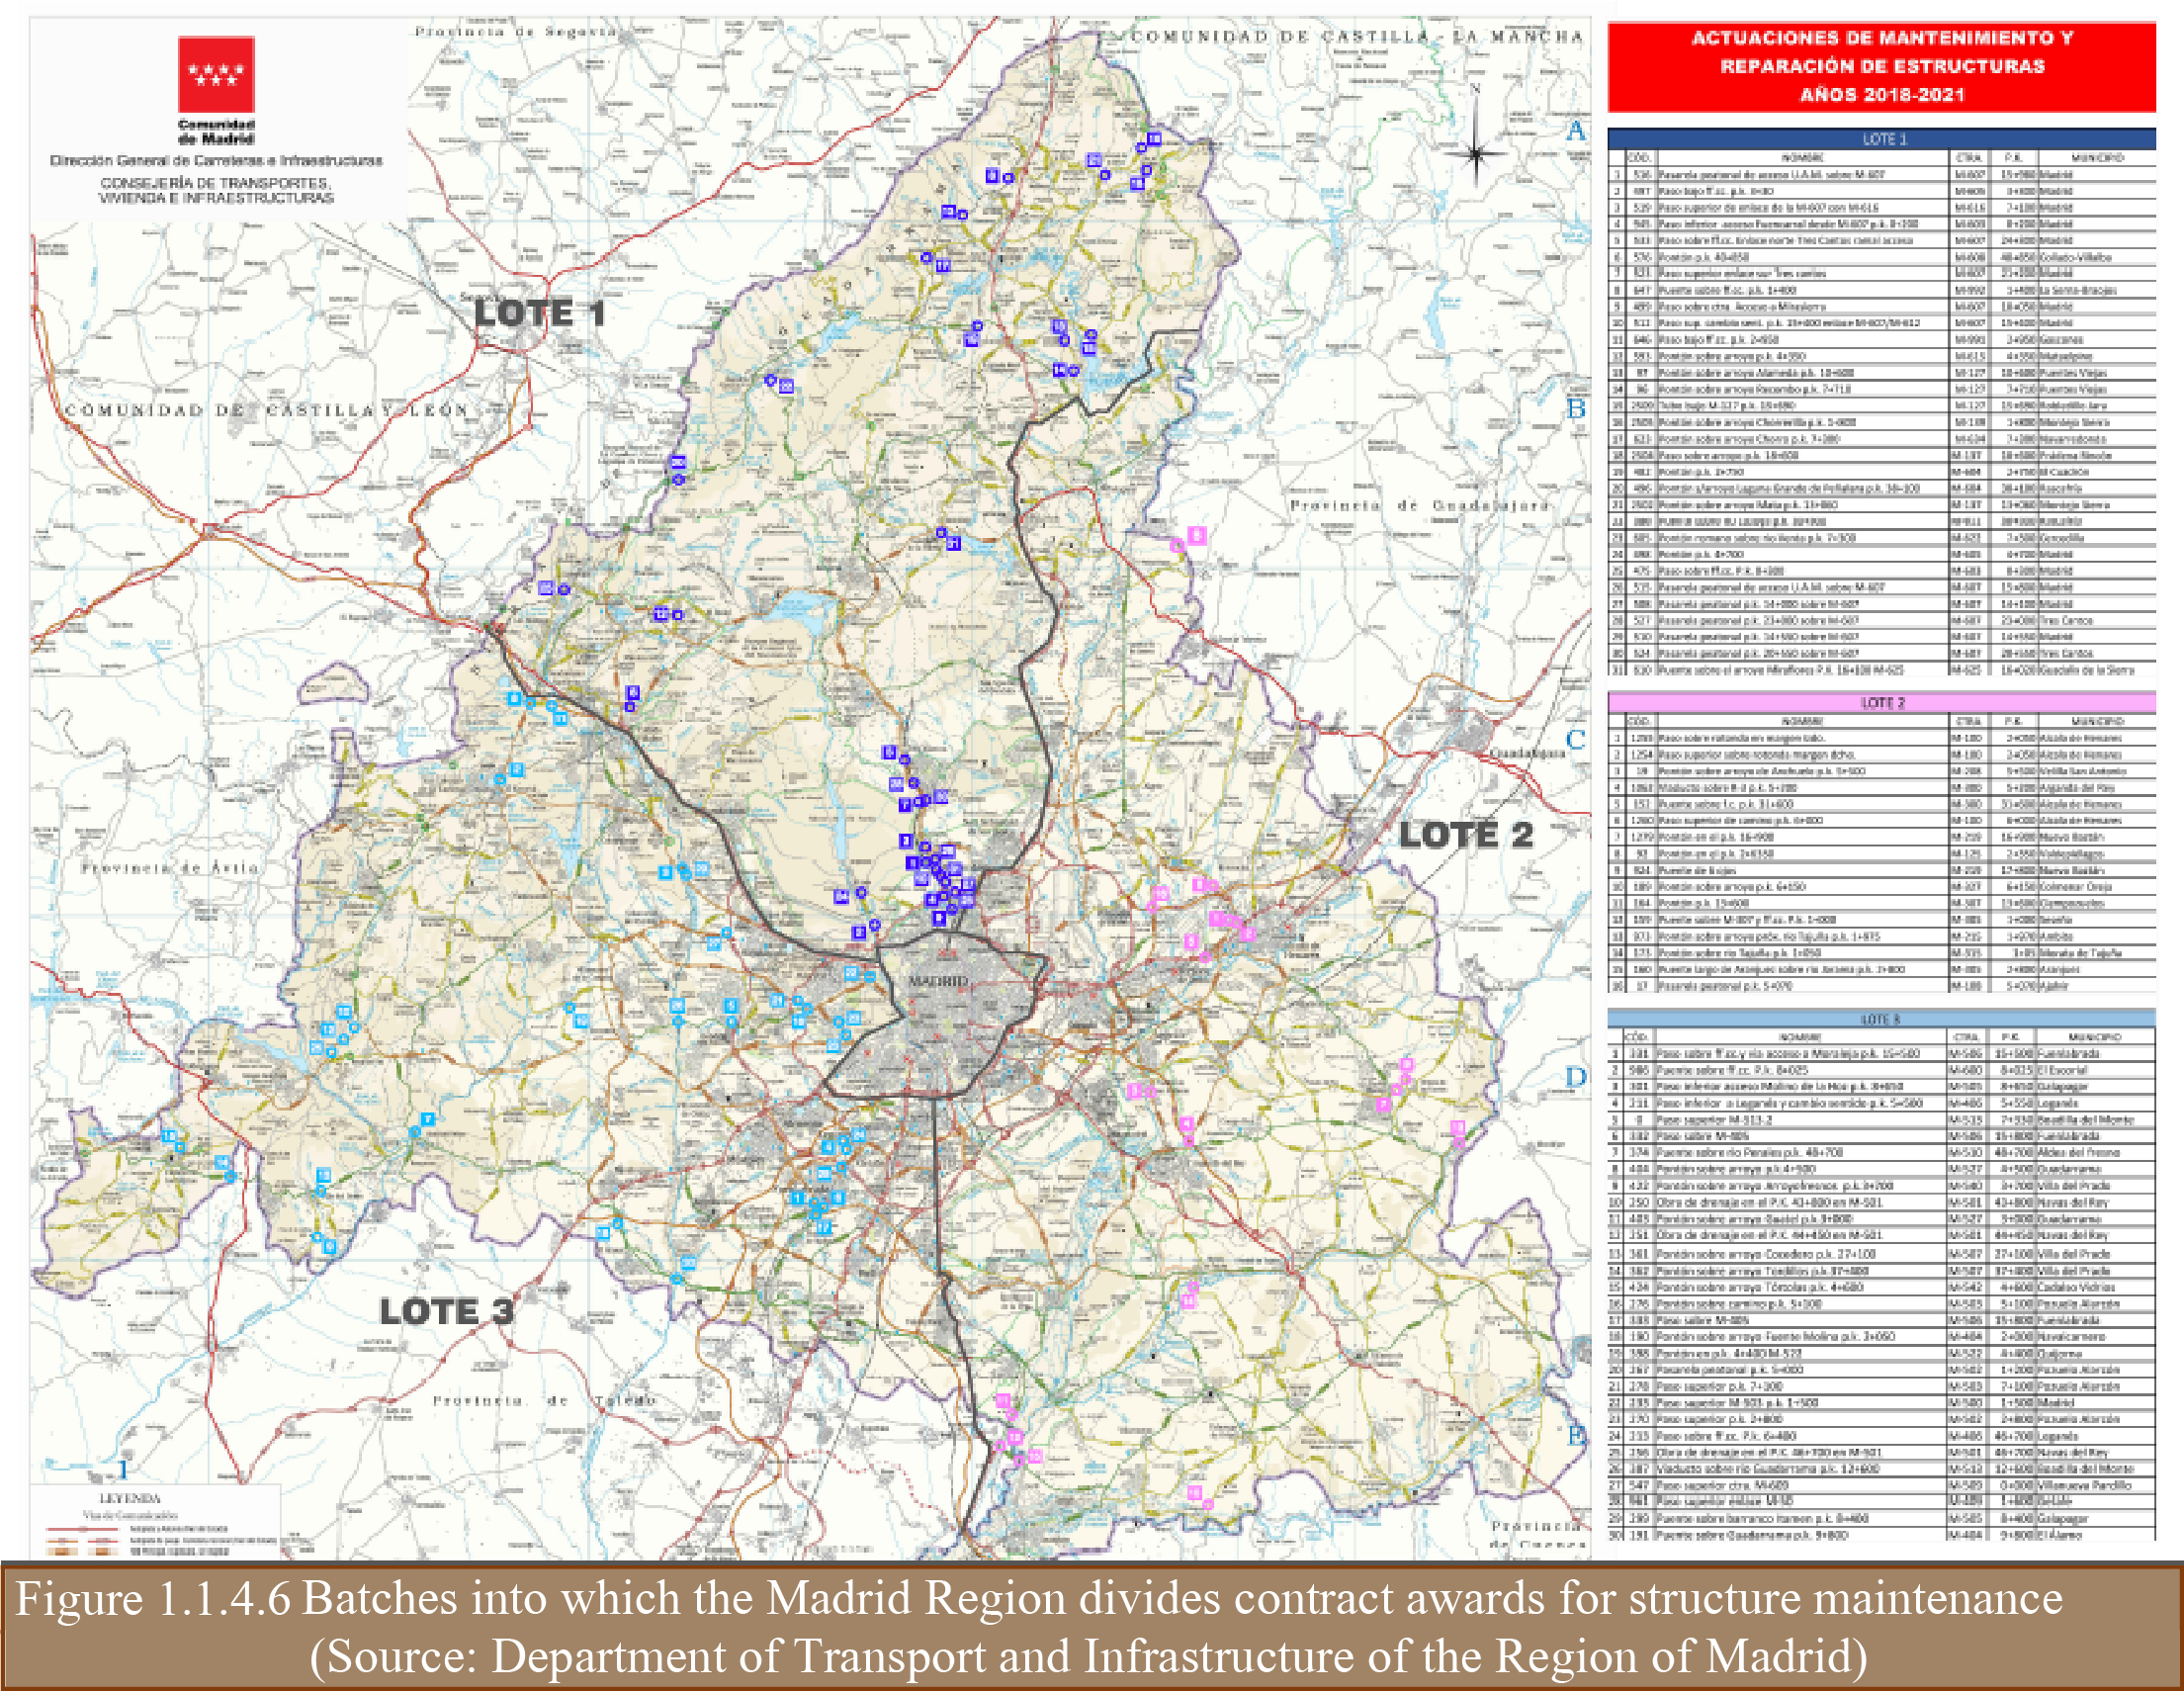
With regard to the maintenance of the structures, the department is currently implementing the “Contract for the inspection and oversight of bridges and structures in the Madrid Region road network (2016 - 2019)".
The department is currently responsible for maintaining 1,122 structures spread throughout the region.
This analyses the trends of different indices that indicate their condition:
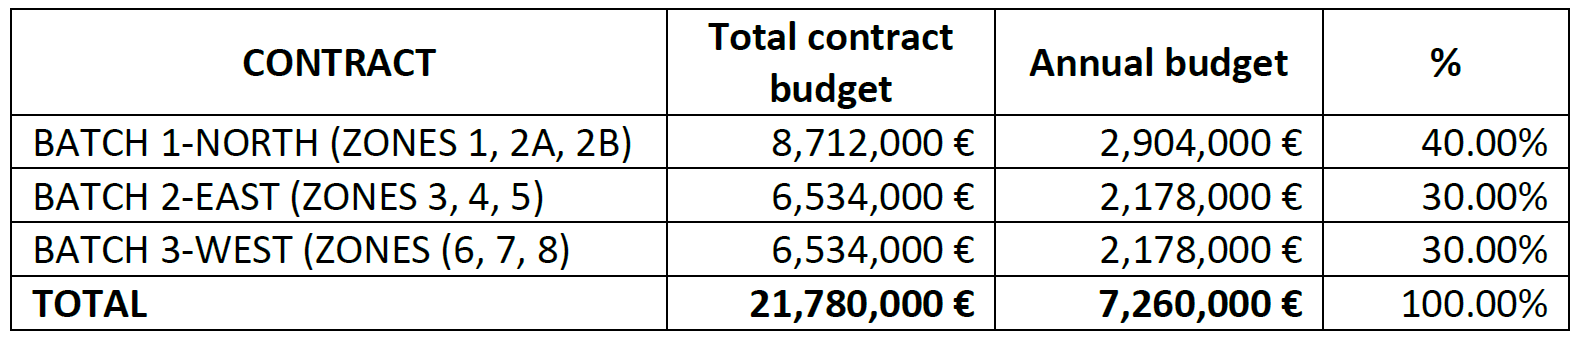
Thus, priority has been given to the necessary actions by dividing them into three contract award batches: North, East and West (dark blue, pink and light blue in Figure 1.1.4.6).
The investment planned to be made in the 2018-2021 conservation period is shown in Table 1.1.4.4.
Table 1.1.4.4: Budget for bridge maintenance
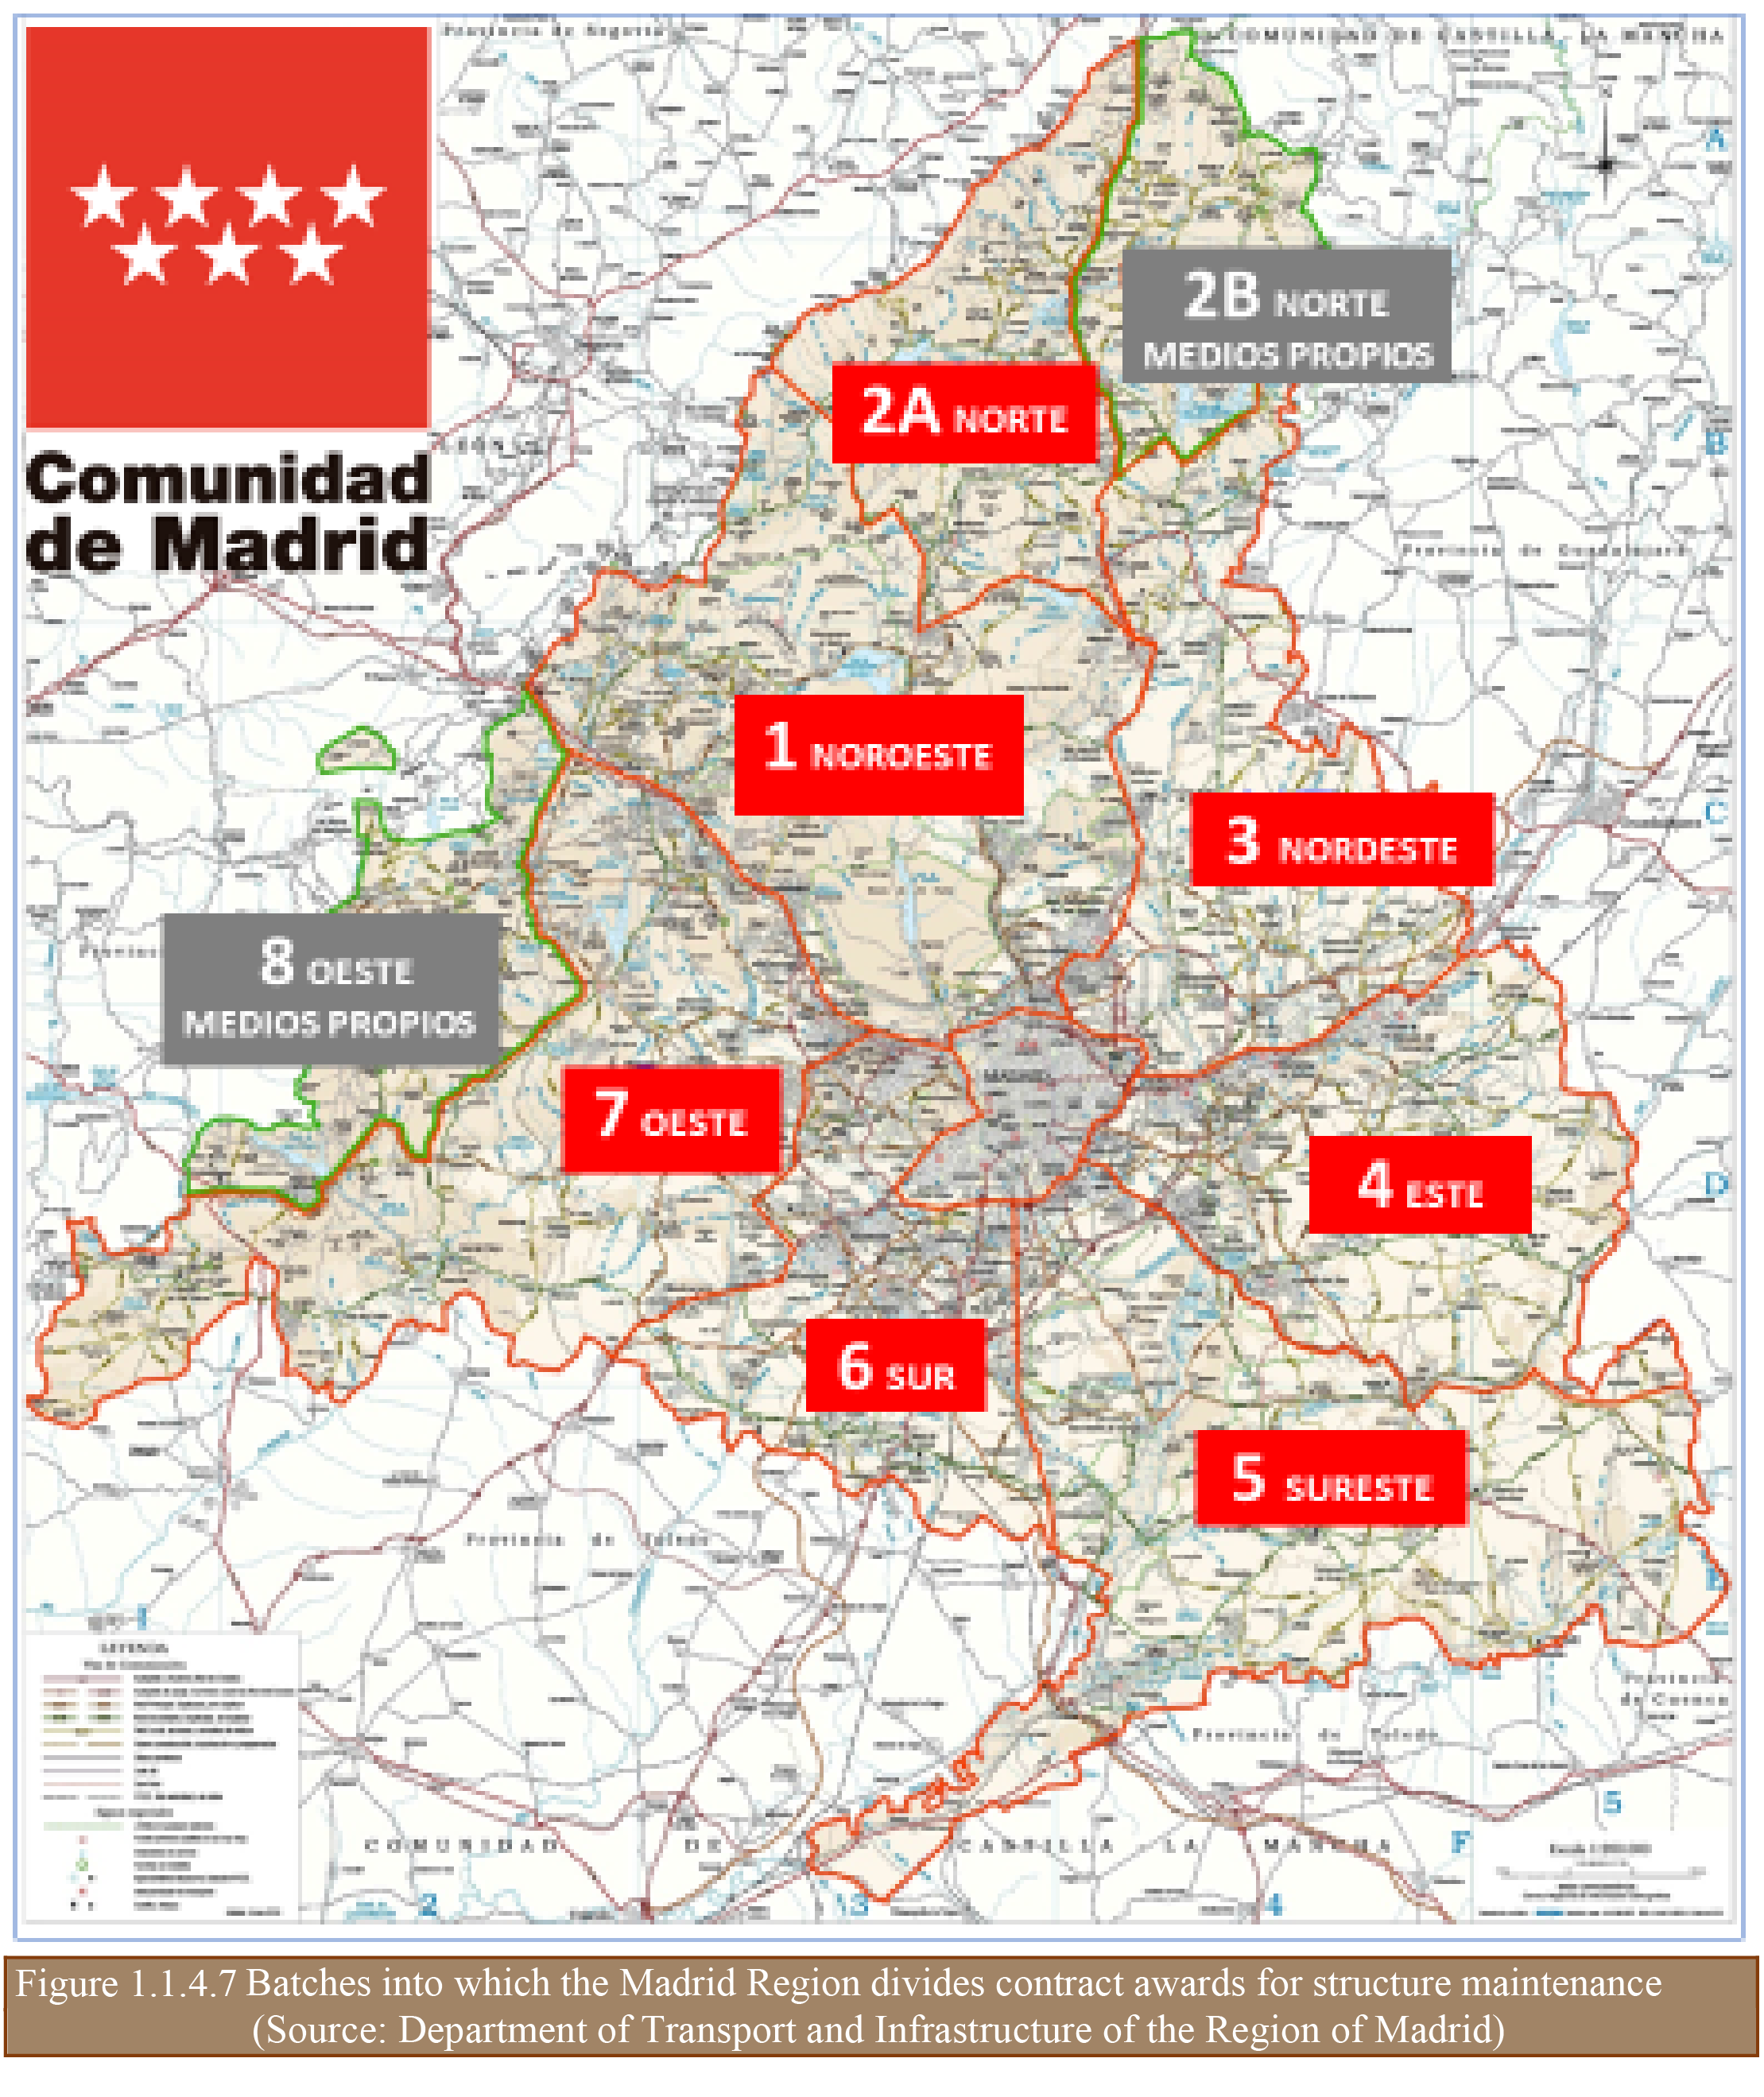
With regard to operation and maintenance, management thereof has also been divided into nine batches, seven of them awarded to different contractors (a maximum of two batches per contractor), and the remaining two managed with Region of Madrid resources, as indicated in Table 1.1.4.5 and Figure 1.1.4.7.
Table 1.1.4.5: Operation and maintenance costs
Payment of these contracts is based on service contracts for the operation and maintenance of the roads under their responsibility based on three types of activities:
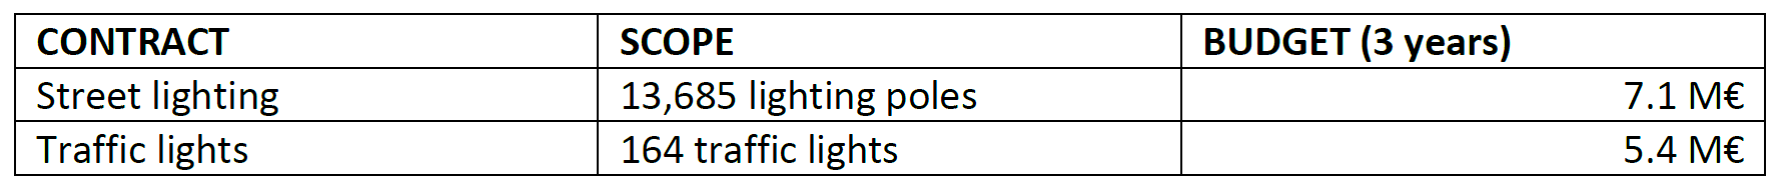
The maintenance of these aspects of the network is done in two separate maintenance contracts during three years.
Table 1.1.4.6: Lighting and traffic light installation maintenance contracts
To carry out the maintenance of margins, crossings and islands, there is a contract that includes:
In addition to the contracts mentioned above, there are five shadow tolls for roads which are subsidised for road users. This subsidy is returned to the concession-holder.
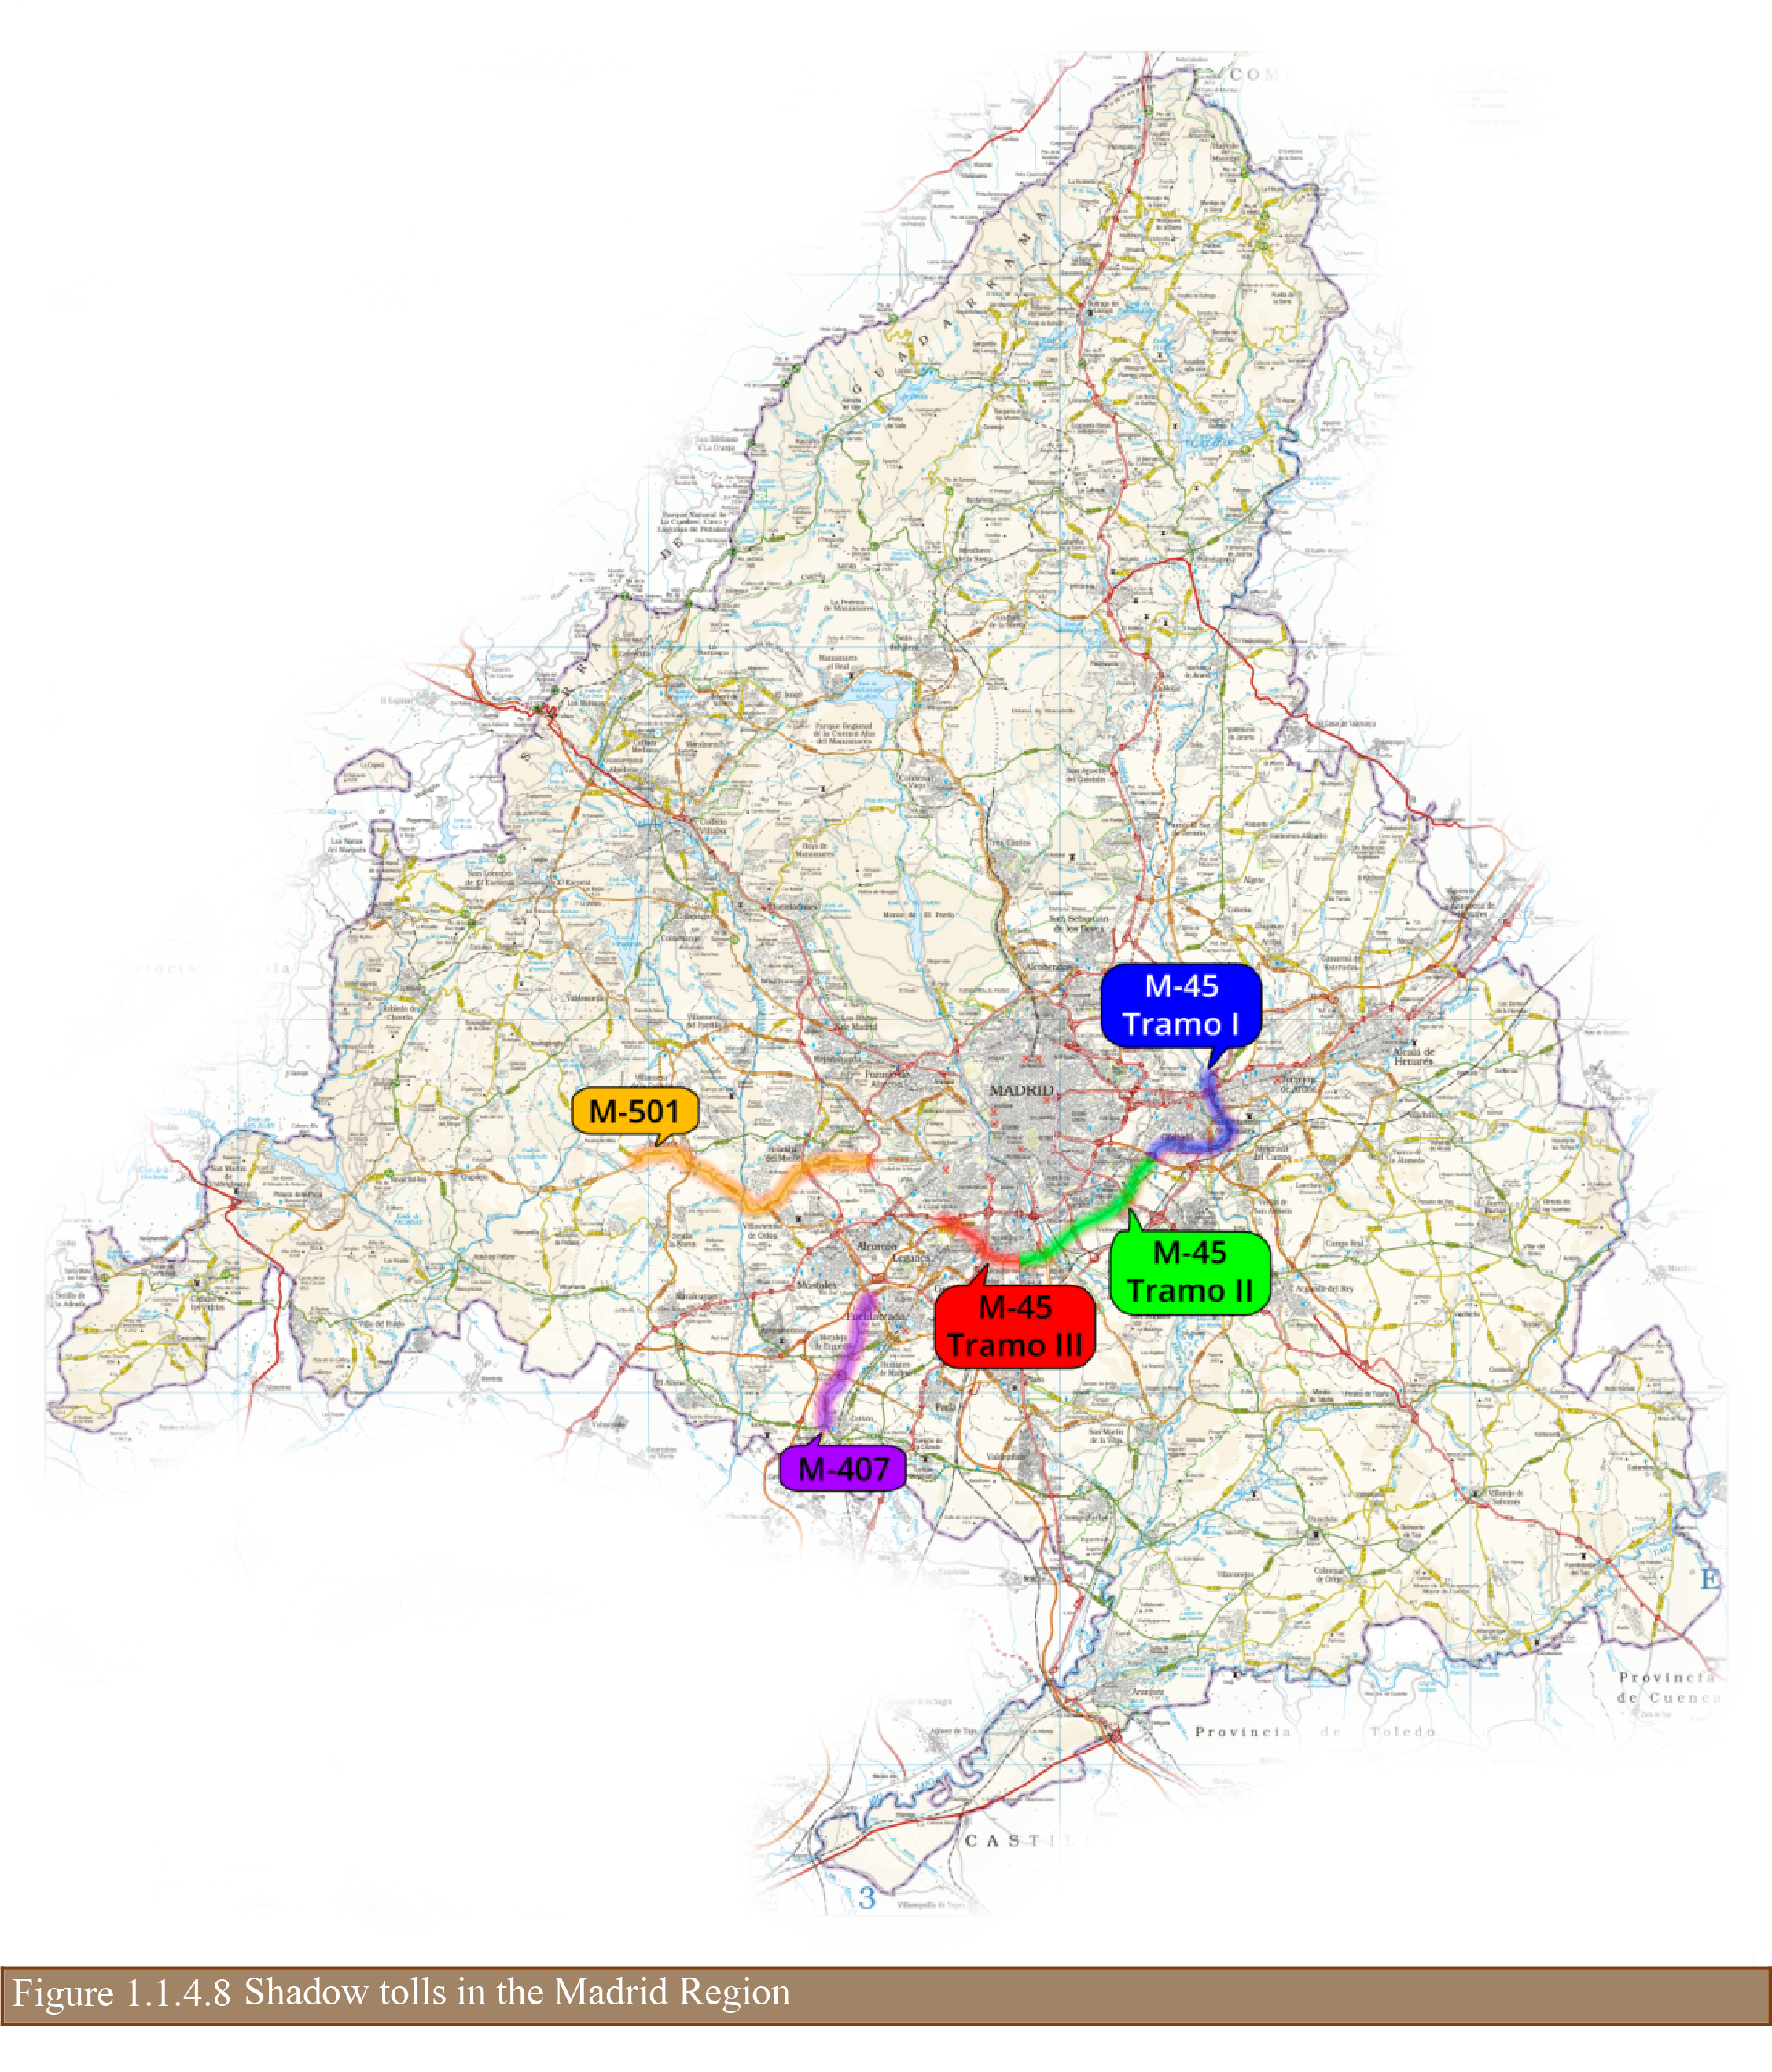
The payment to the concession-holder is done with an annual subsidy corresponding to the traffic during the yearly period that has just ended, multiplied by the rate for the yearly period updated with the IPC. The amount is calculated each yearly period and the monthly subsidy to the concession-holder is one-twelfth thereof. Payment to the concession-holder has an annual limit that cannot be exceeded, regardless of the increase in vehicles travelling on the road. This is the risk of the concession.
Table 1.1.4.7: Details on the concessions currently being implemented in the Madrid Region
As described, the maintenance and conservation model of the Madrid Region's road network is a model based on the different needs of the assets and the different possibilities for maintenance and conservation, and selects the most appropriate, both technically and economically.
The Department of Transport and Infrastructure works constantly to achieve the highest quality standards in its road network and thereby provide users with the tools to attain a level of development in the area.
RAJESH KEMPRAI, Commissioner and Special Secretary to Government of Assam, Public Works Roads Department, India
DIGANTA GOSWAMI, Assistant Executive Engineer, Public Works Roads Department, Government of Assam, India
Public Works Roads Department (PWRD) is the agency responsible for managing the secondary, urban and rural road network in Assam. To boost infrastructure development, it had initiated several projects in the state and Assam State Roads Project (ASRP) being one of them. The State Government of Assam (GoA) through the Government of India (GOI) has received a loan from the International Bank for Reconstruction and Development (IBRD) for implementation of Assam State Roads Project. Development and implementation of a computerized road asset management system (RAMS) for the maintenance and management of the state road network is one of the key mandates of ASRP. Consequently, such a system was developed and implemented during 2015-18 to meet the needs of PWRD and is called Assam Road Asset Management System (ARAMS). The ARAMS application is envisioned to assist the PWRD to rationalize and aid the decision-making for planning / programming of road maintenance and rehabilitation activities and to estimate the long-term funding requirement for preserving the road assets at an acceptable service level, thereby safeguarding their asset value. It is intended to reflect the state-of-the-art technology and best international practices, in a way that suits the local needs and conditions. To achieve this, PWRD retained LEA Associates South Asia Pvt. Ltd. (LASA), India in joint venture with LEA International Limited (LEA), Canada in association with Geo Info Space Private Limited (GIPL), India. This report offers insights to the project tasks and major findings / learnings for PWRD from the Project.
The principal objective of the project was to establish and implement a road asset management system (RAMS) for PWRD. The project envisaged following tasks under its scope of work:
The major benefits expected from the project to PWRD are manifold. A few of them are listed below:
Assam is the largest state among the North Eastern states of India and acts as gateway for the entire North Eastern (NE) states i.e. Arunachal Pradesh, Manipur, Meghalaya, Mizoram, Nagaland, Tripura and West Bengal and two countries viz. Bangladesh and Bhutan. Its fiscal and economic situation has been improving since last decade, efforts of the government has helped the state to accelerate its Gross State Domestic Product (GSDP).
Its geographical location demands huge thrust on the development of road infrastructure in the region for enhancing the region’s economy. As road infrastructure assets are the key factors of economic development, mobility and social equity for any region or nation. They are not only costly to build but also expensive to maintain in order to adequately meet the public expectations. The key issue is how to manage existing assets in an optimum way and deliver maximum benefit to public, taking into account limited financial resources. The solution is Road Asset Management System (RAMS) which offers a comprehensive and structured approach to deliver benefits to the community benefits through management of road network. It is defined as a systematic process of maintaining, upgrading, and operating road assets cost-effectively. PWRD, under the assistance of the World Bank has developed a web based Road Asset Management System (ARAMS). It is a comprehensive system developed for the road network under PWRD jurisdiction mapped on a GIS platform. It is intended to improve the technical capacities, skills and management capabilities of the PWRD and other road agencies associated with road management and maintenance, thus improving the ability of the Government of Assam (GoA) and its subordinate agencies to manage efficiently and cost-effectively road maintenance and improvement activities.
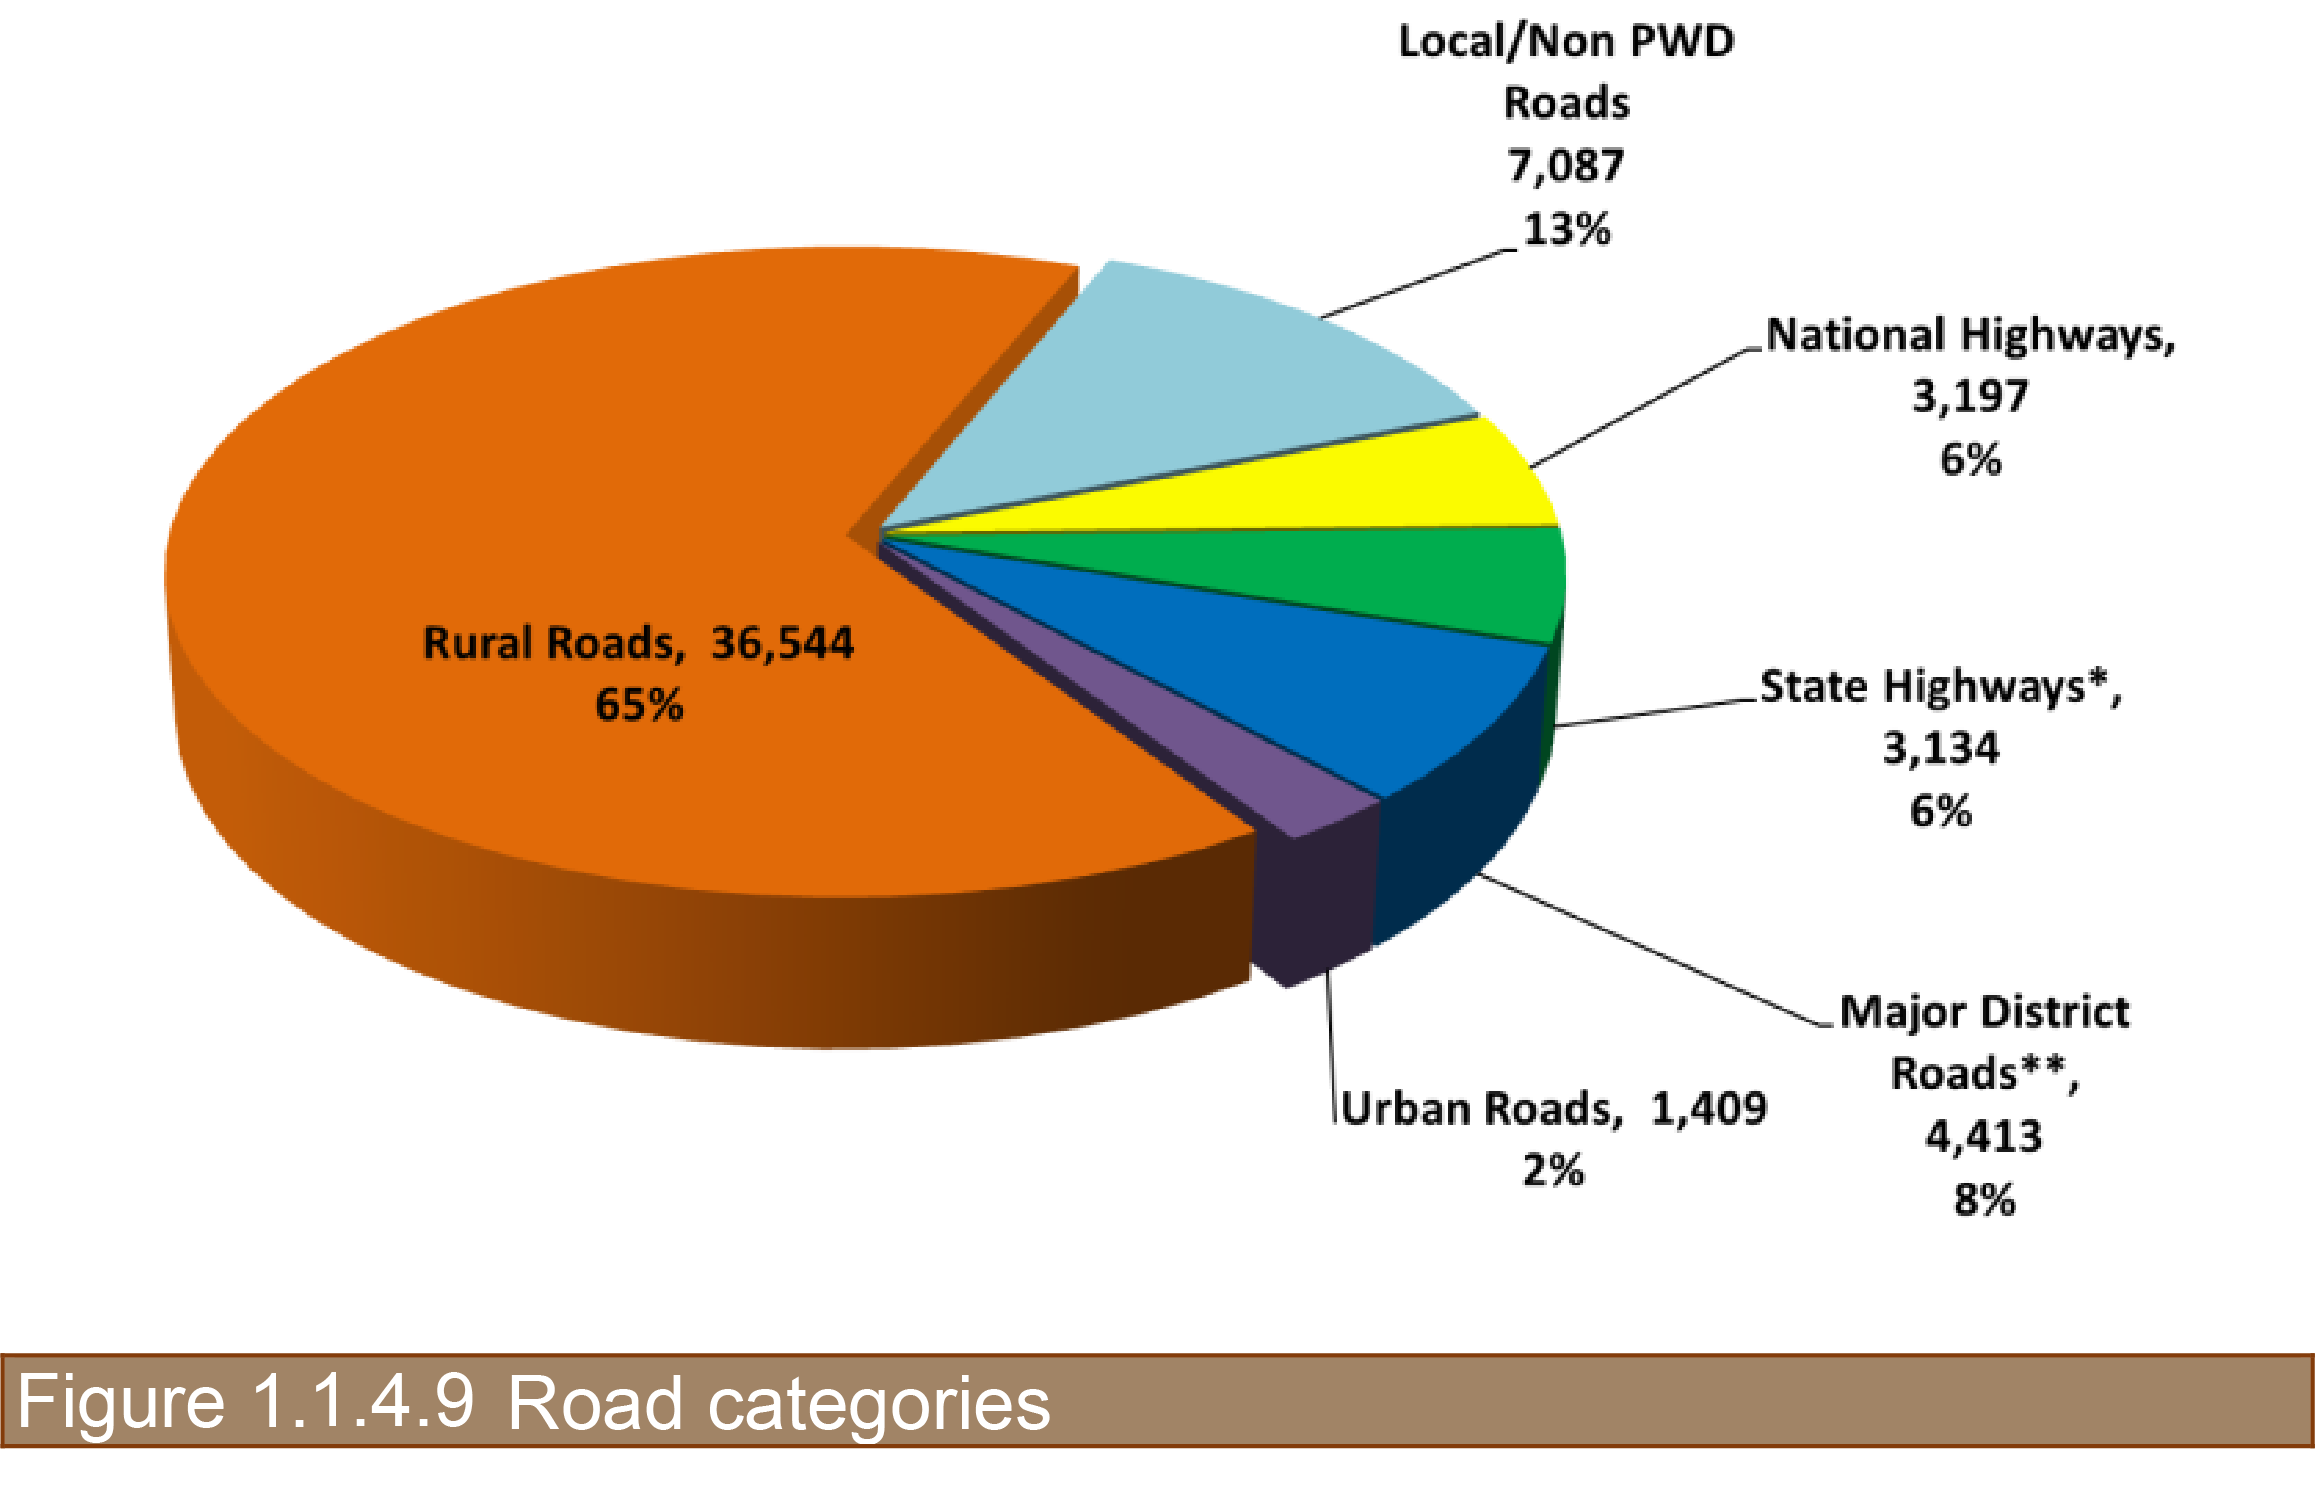
The capital Assets of road agencies in Assam comprised of the road network and assets created thereon such as pavements, bridges, culverts etc. The current road assets in the state are represented in the table. While the National Highways (3,197 km) is managed by a number of agencies (NHAI, PWD-NH & Buildings, BRO, Railways), the Public Works Road Department (PWRD) in Government of Assam manages secondary and tertiary state road network of 44,862 km. The secondary network is classified into State Highways, SH, 3,134 km; and Major District Roads, MDR, 4,413 km, Urban Road 1,409 km and Rural Roads, 36,544 km. The length of rural roads is expected to be around 47,000 km as per RAMS consultant’s estimate, thereby making the total road network under PWRD to about 56,400 km to be managed by the RAMS. About 604 km of SH and 34 km of MDR are taken-up as NH post 2012-13, thereby making total NH as 3835 km.
This case study mainly focuses on the secondary road network i.e. SH and MDR under PWRD which comprises of about 15% of the entire road network of Assam. Of the 7500km of SH and MDR network, about 87% paved road network comprise of bituminous, cement concrete and paver blocks and the remaining 13% is unpaved which also included about 6% (411 km) inaccessible network due to dense forest cover, breached river sections, etc. as represented in the table below:
Table 1.1.4.8: Road network included in case study

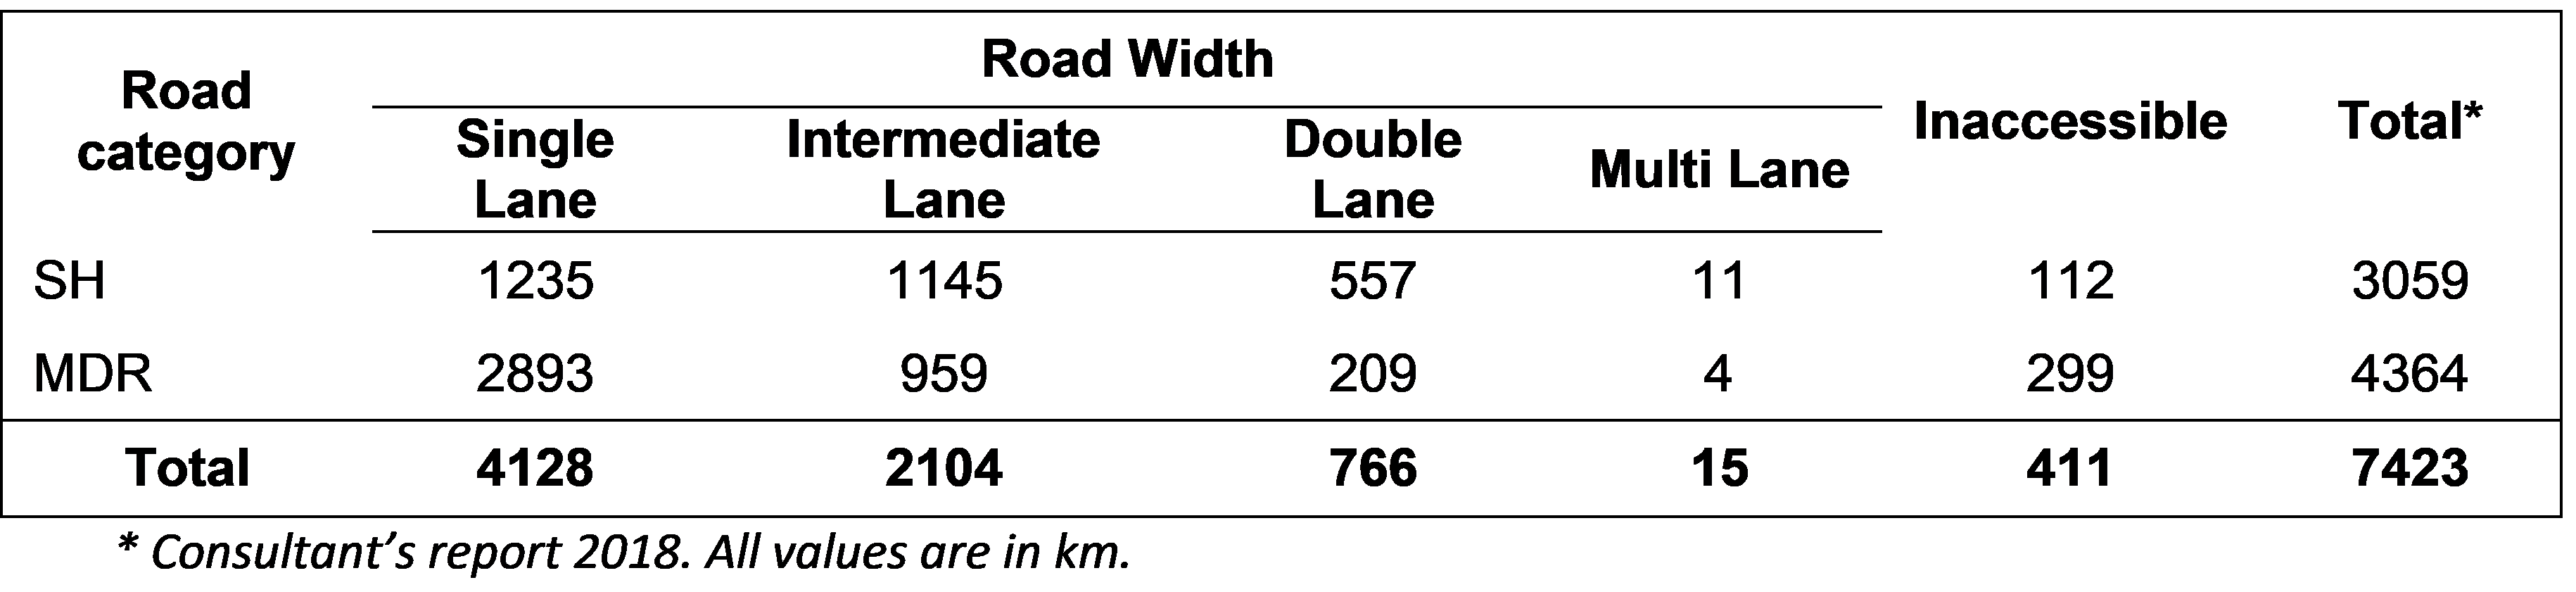
About 84% of road network has carriageway width less than 7m i.e. either single or intermediate lane. Only 10% of the road network is of double lane standard and the remaining 6% is inaccessible as represented below:
Table 1.1.4.9: Road width included in case study
There are 1835 bridges and 10798 culverts on SH & MDRs in Assam which also include 101 wooden, 22 semi-permanent steel bridges and 96 bridges are under construction as represented in the table below:
Table 1.1.4.10: Bridges included in case study

Data collection constitutes the most time consuming and resource requiring component for asset management system. It is also subject to budgetary scrutiny and at risk due to financial constraints. In the context of Assam, the data collected was most appropriate to the objectives, resources and modus operandi of the department, and meets the criteria of relevance, reliability, affordability, appropriateness and accessibility. Most of the data was collected through automated means using electronic and mechanical equipment. The consultant procured ARRB’s Hawkeye to collect center-line alignment, inventory, geometry, roughness and condition of the pavement travelling at highway speeds. The data collection methodology implemented for Assam road network is represented below:
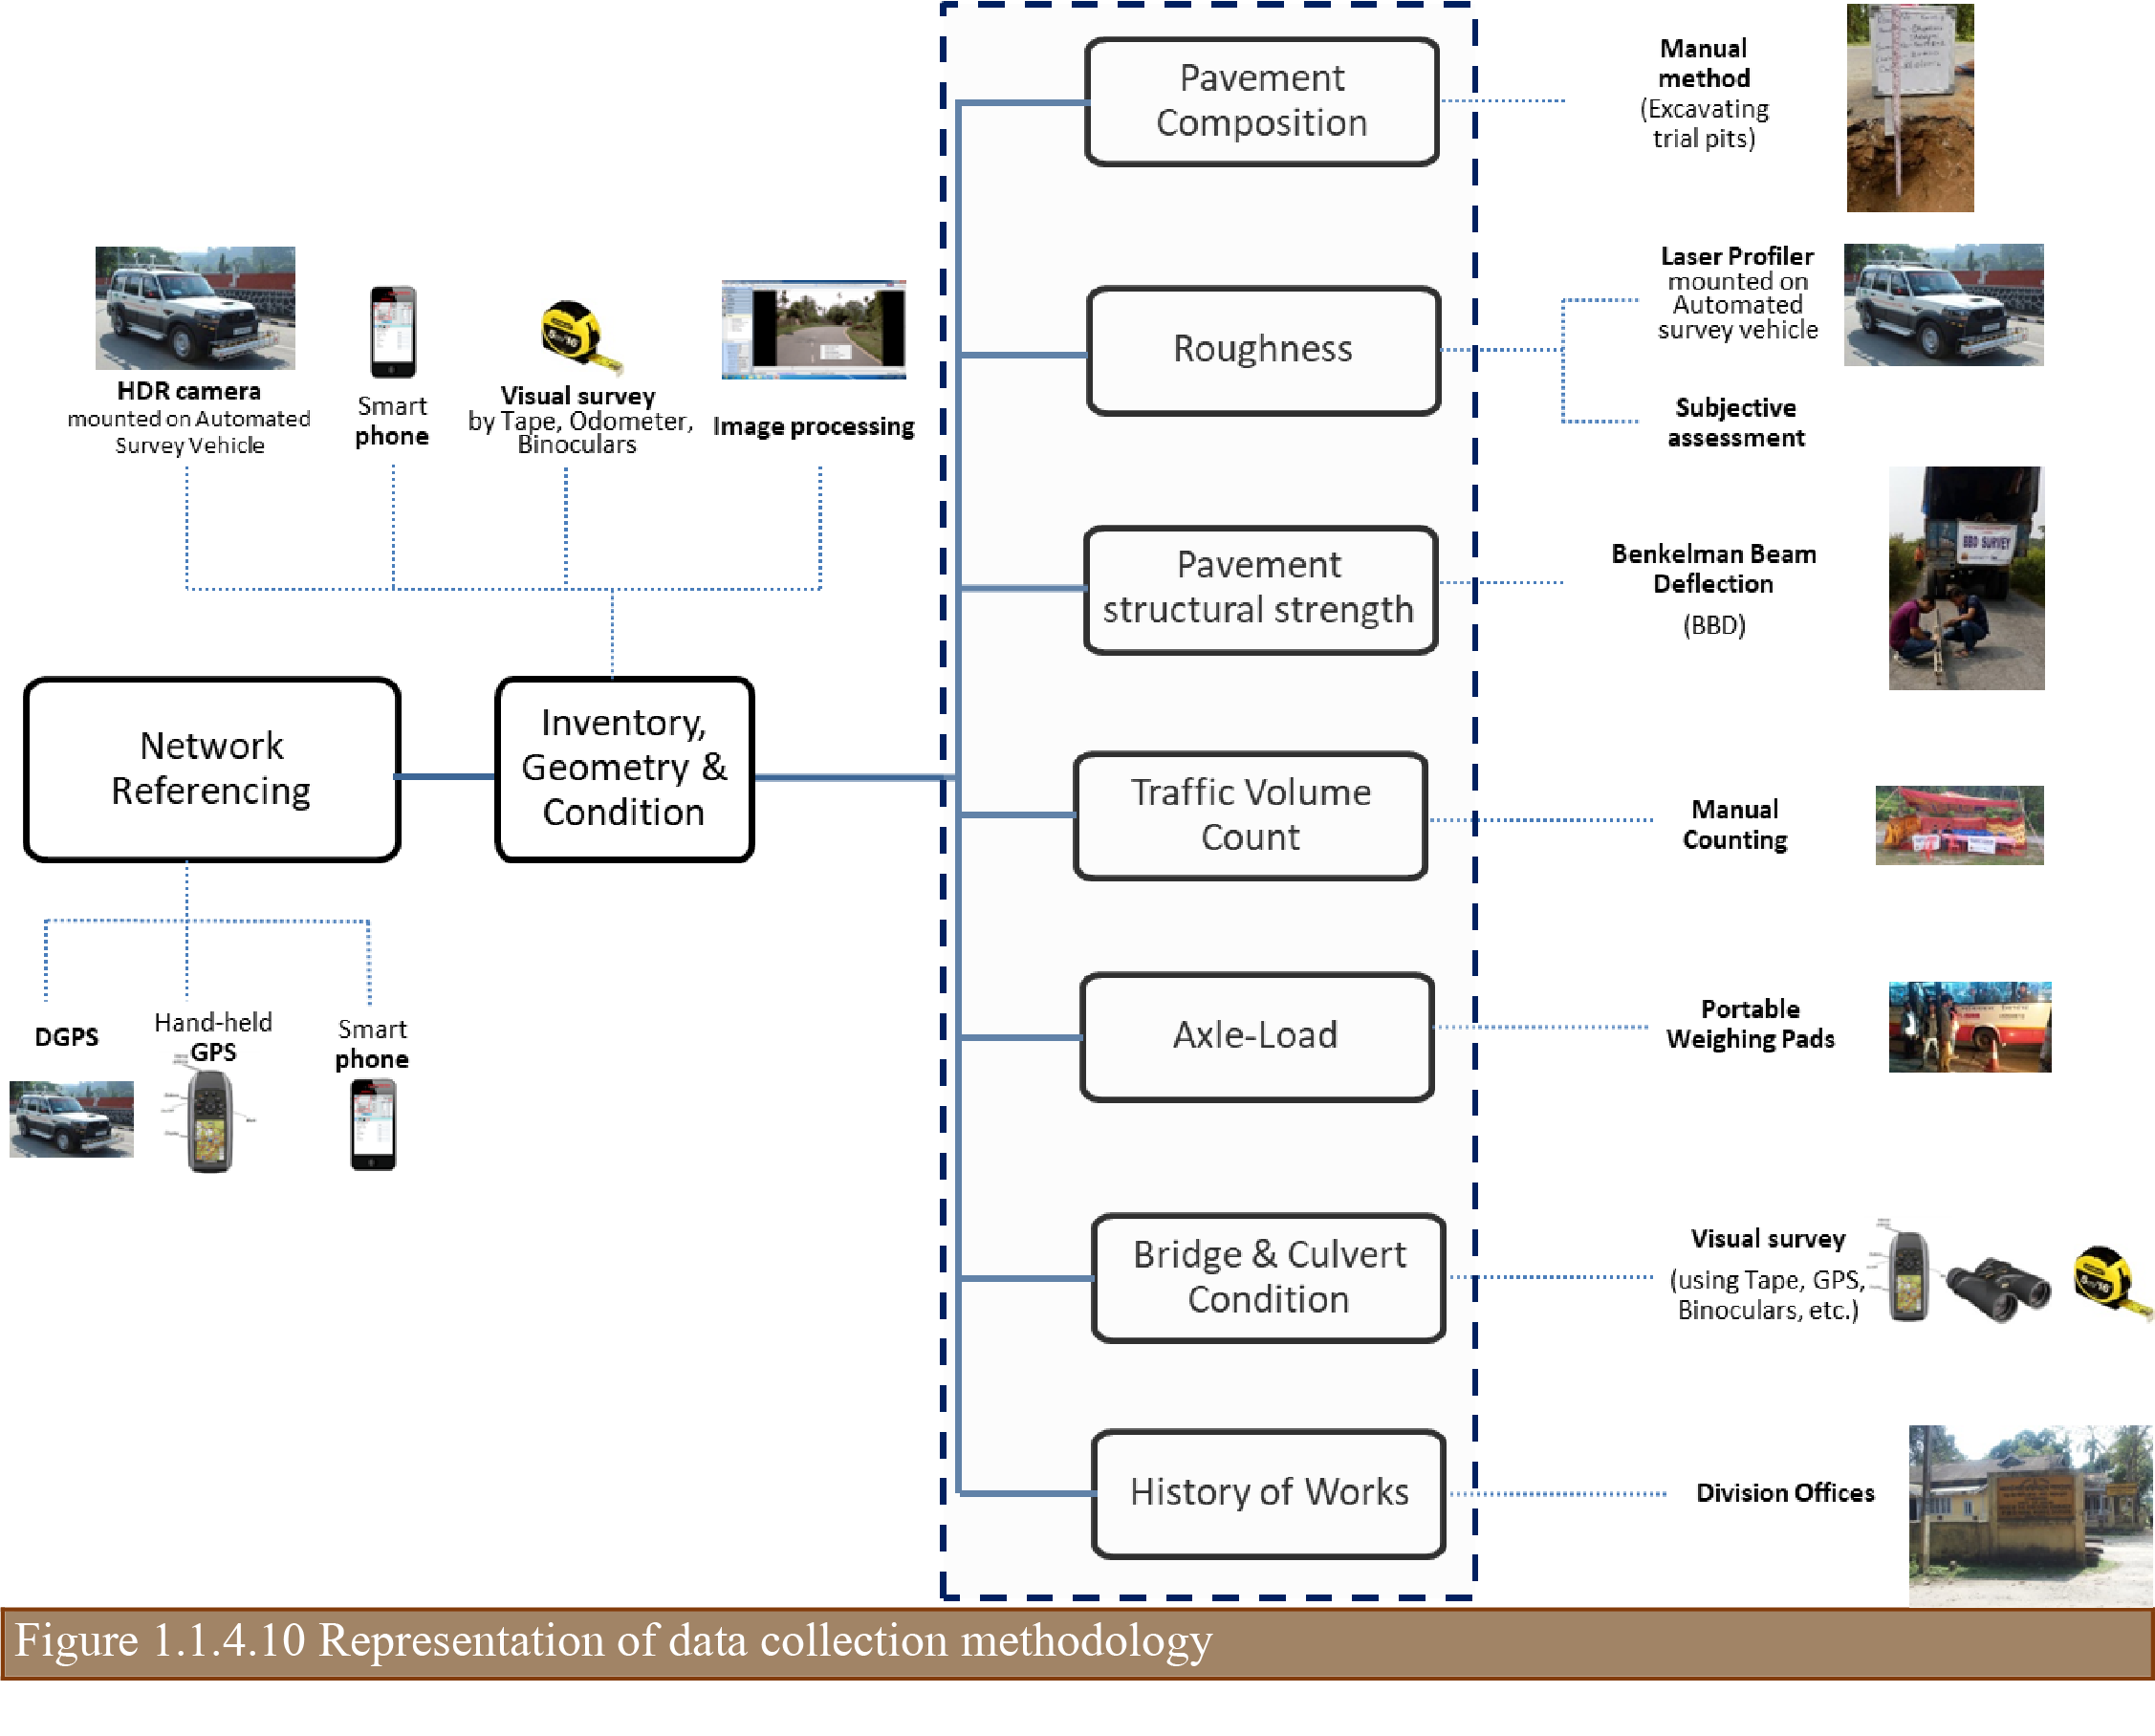
Table 1.1.4.11: Data collection methodology

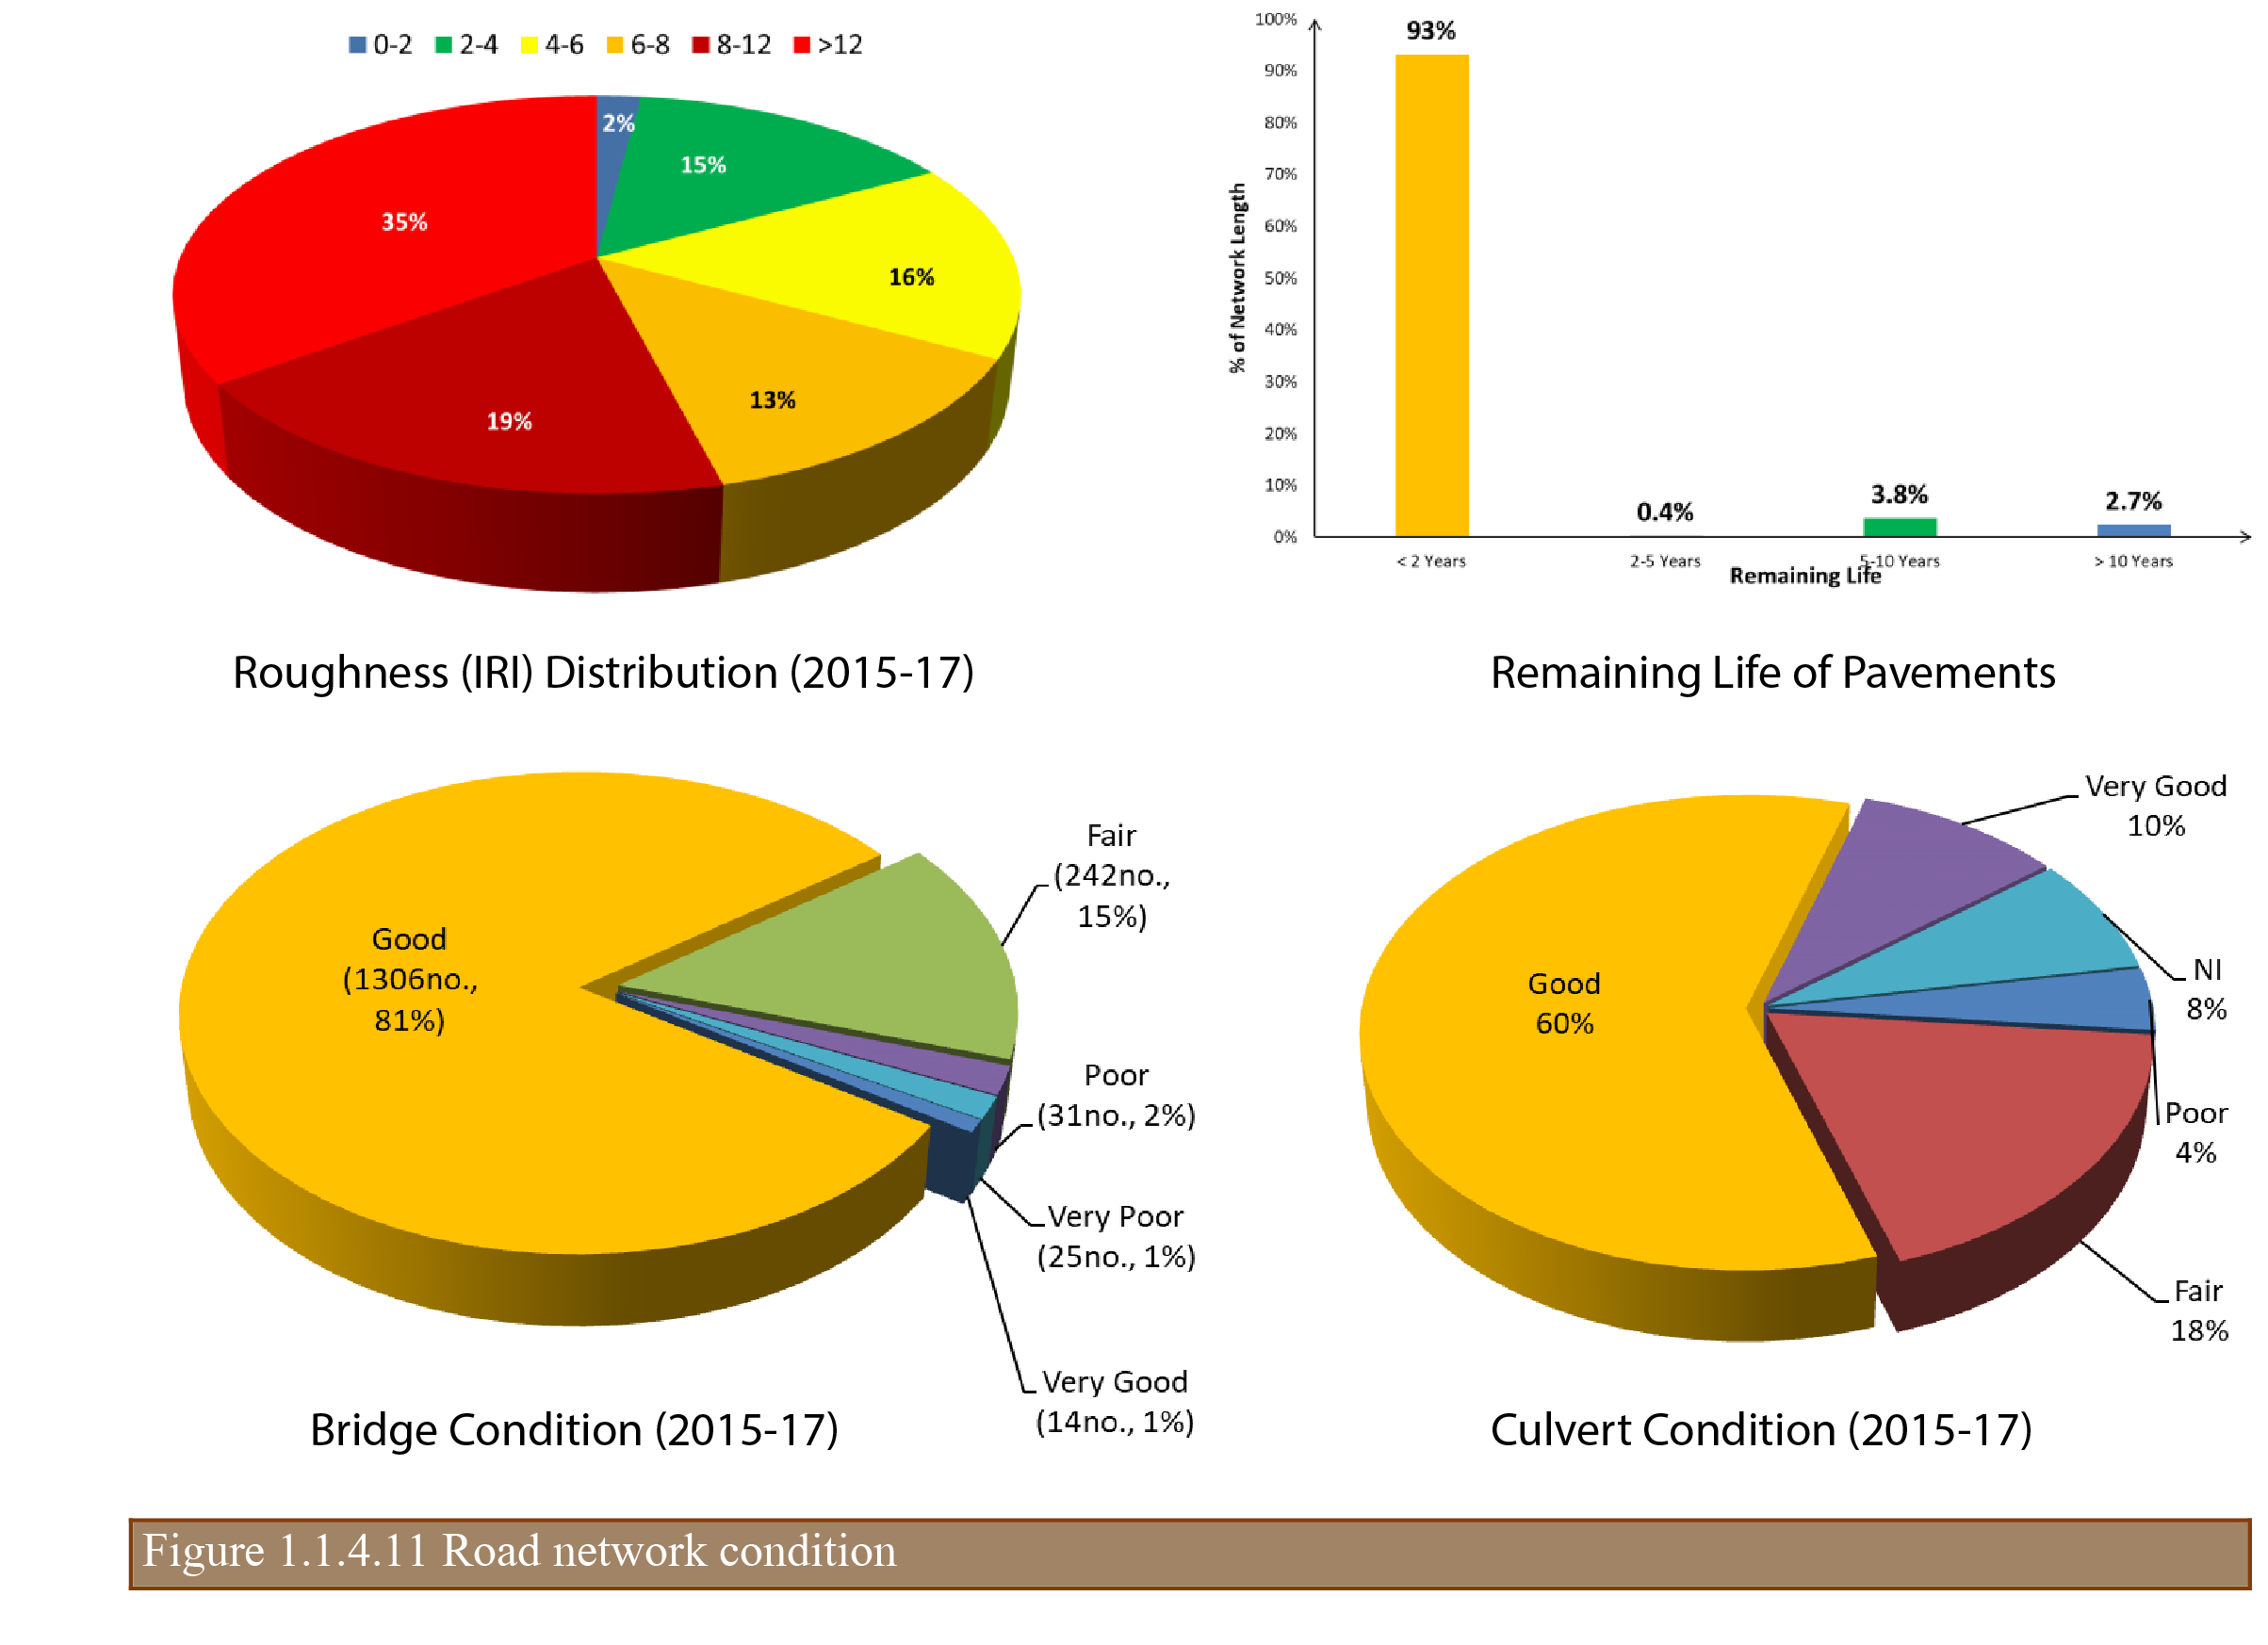
Due to years of inadequate investment towards robust design on capital asset creation and lack of maintenance thereon has the road network in poor condition. Road maintenance is a lower priority as compared to new construction. The advent of flagship schemes such as NHDP (National Highway Development Program), PMGSY (Pradhan Mantri Gram Sadak Yajona – Rural Roads Program), etc. by the Government of India (GoI) has led to negligence towards maintenance of SH and MDR network. Some of the key observations from the surveys carried out by the RAMS consultant are as follows:
ARAMS is a web-based GIS application developed to add, edit, update, view, analyze, monitor and delete the data on roads and bridges under PWRD. It is integrated with PWRD’s online e-portal and hosted in the department’s server located in the Office of the Chief Engineer, PWD (Roads), Chandmari, Guwahati. It primarily consists of 7 core modules:
In addition to the above, two (2) modules; Web-GIS and Reports were developed to assist PWRD in viewing the information on a GIS map platform and retrieve pre-defined standard reports for administrative use. A schematic representation of the ARAMS system architecture is given below:
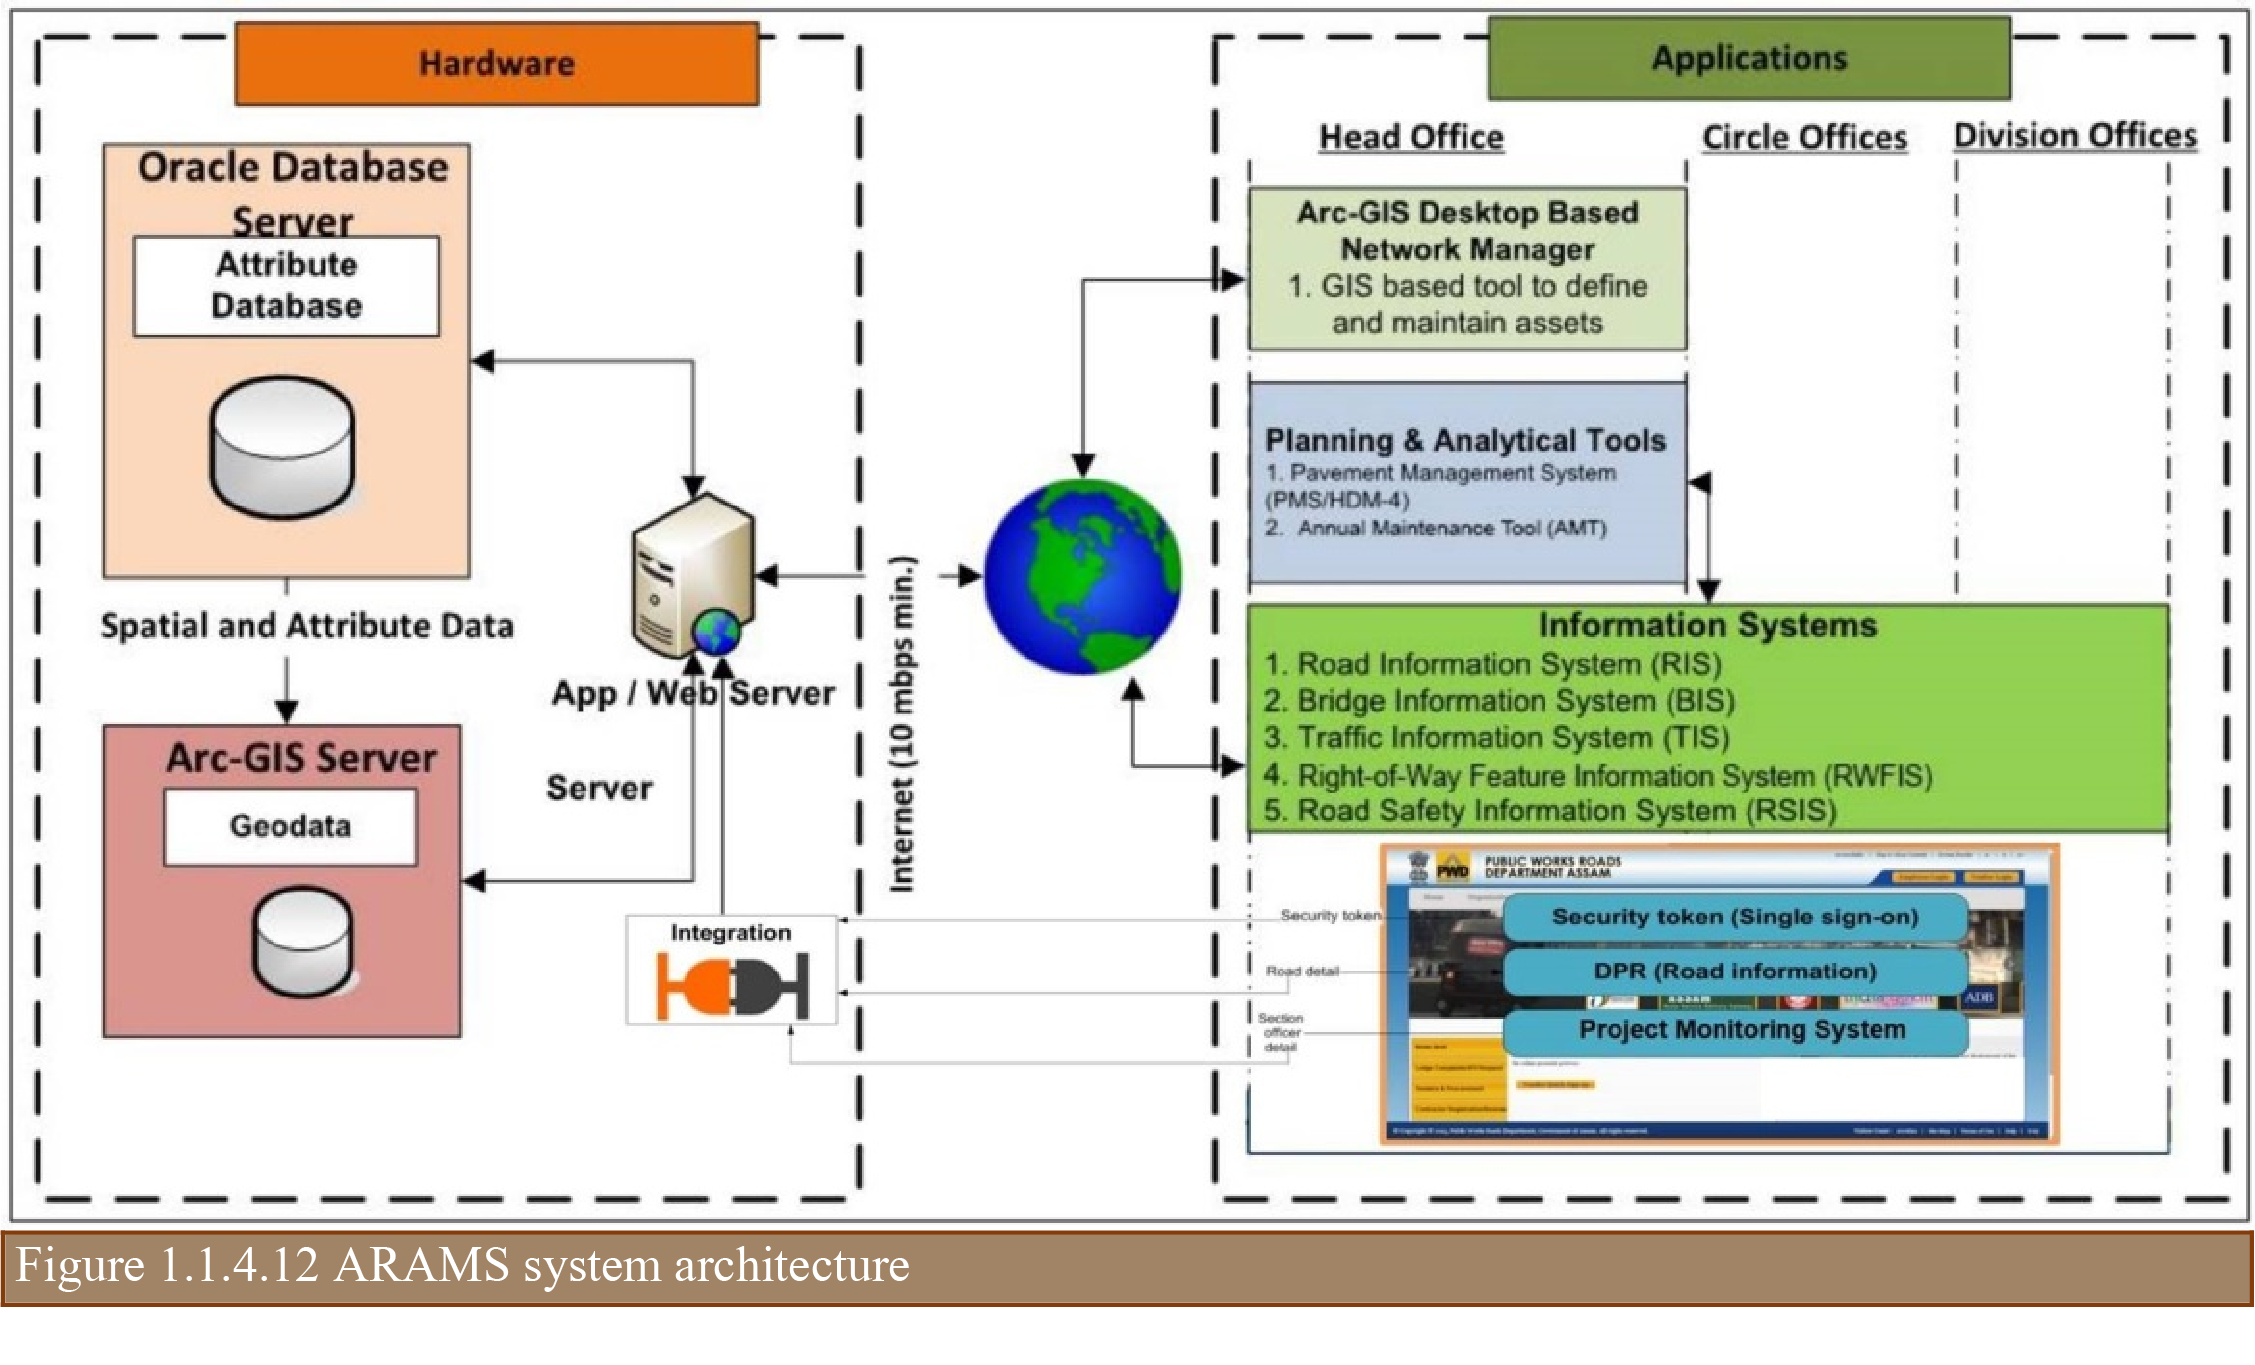
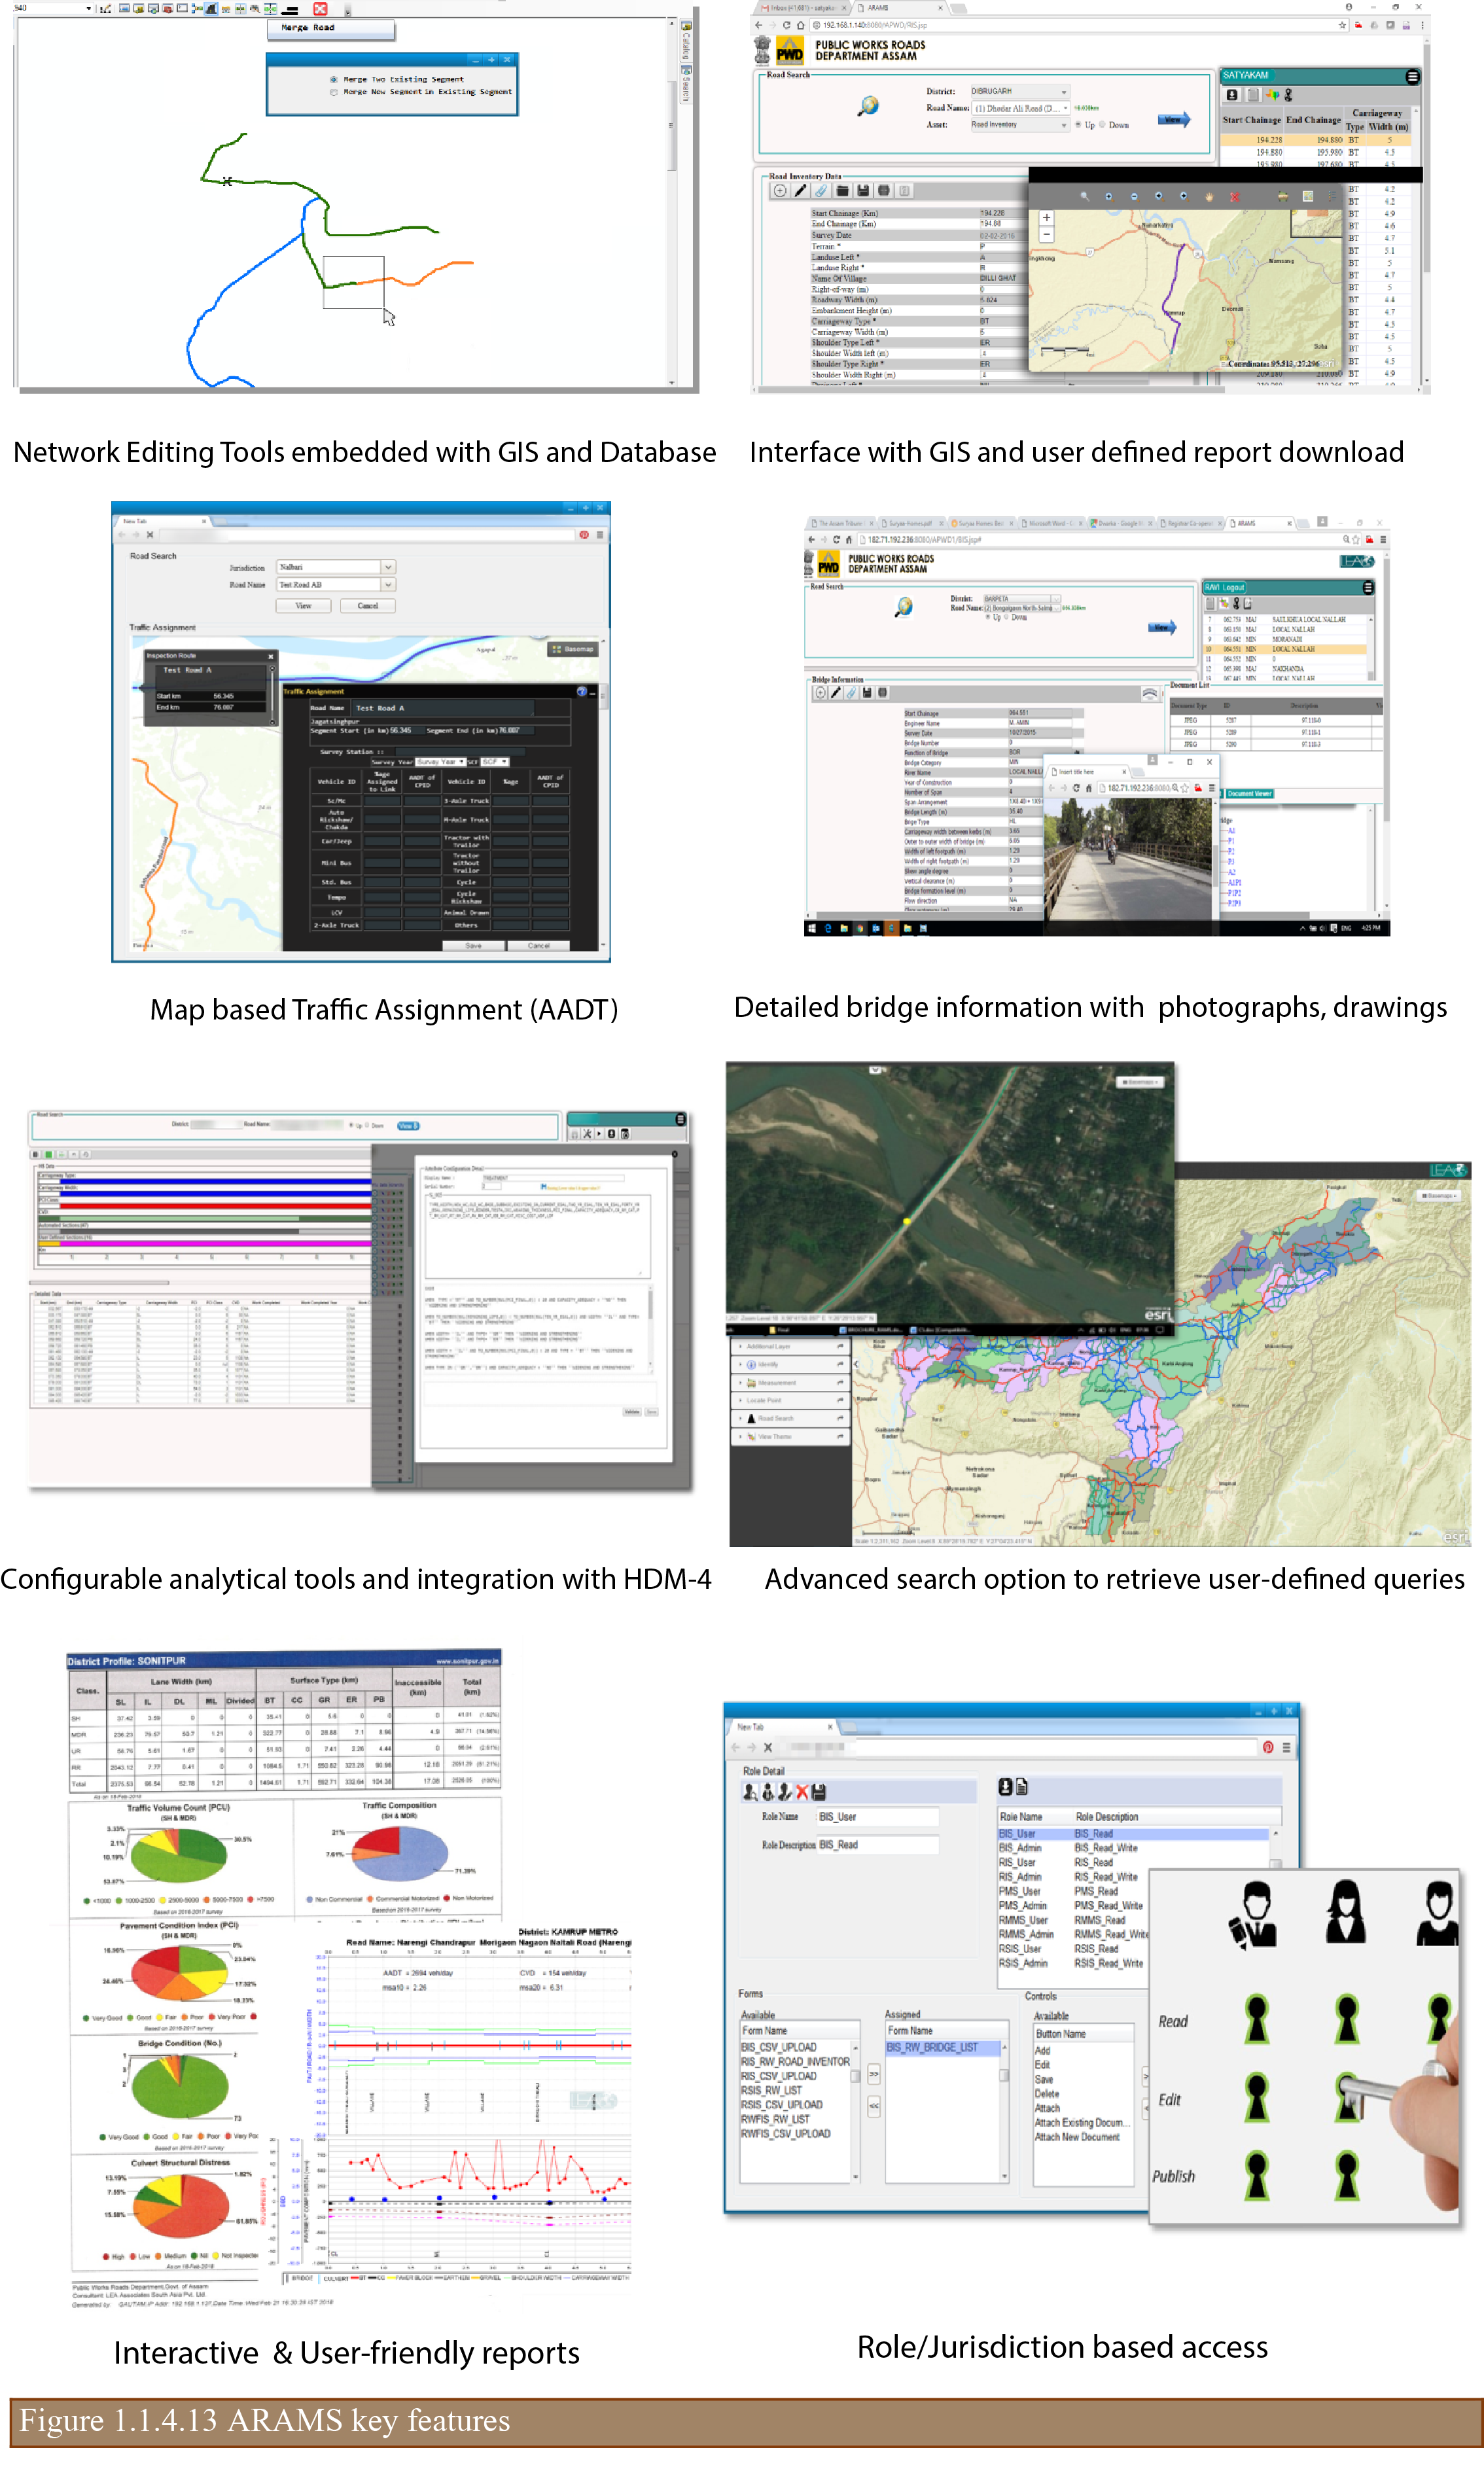
The application suite is developed using Oracle 11g R2 Enterprise Edition and ArcGIS Server 10.4. The client side script uses HTML and JavaScript, and server side script as Java technology. It supports a cross browser, cross platform technology, and runs on all popular web browsers including Microsoft Internet Explorer, Mozilla Firefox and Google Chrome. The system and functional requirements of ARAMS was established after carrying out a detailed needs analysis study and reviewing the software licenses, hardware and networking options available with PWRD for hosting. Some of the interfaces with key features are represented below:
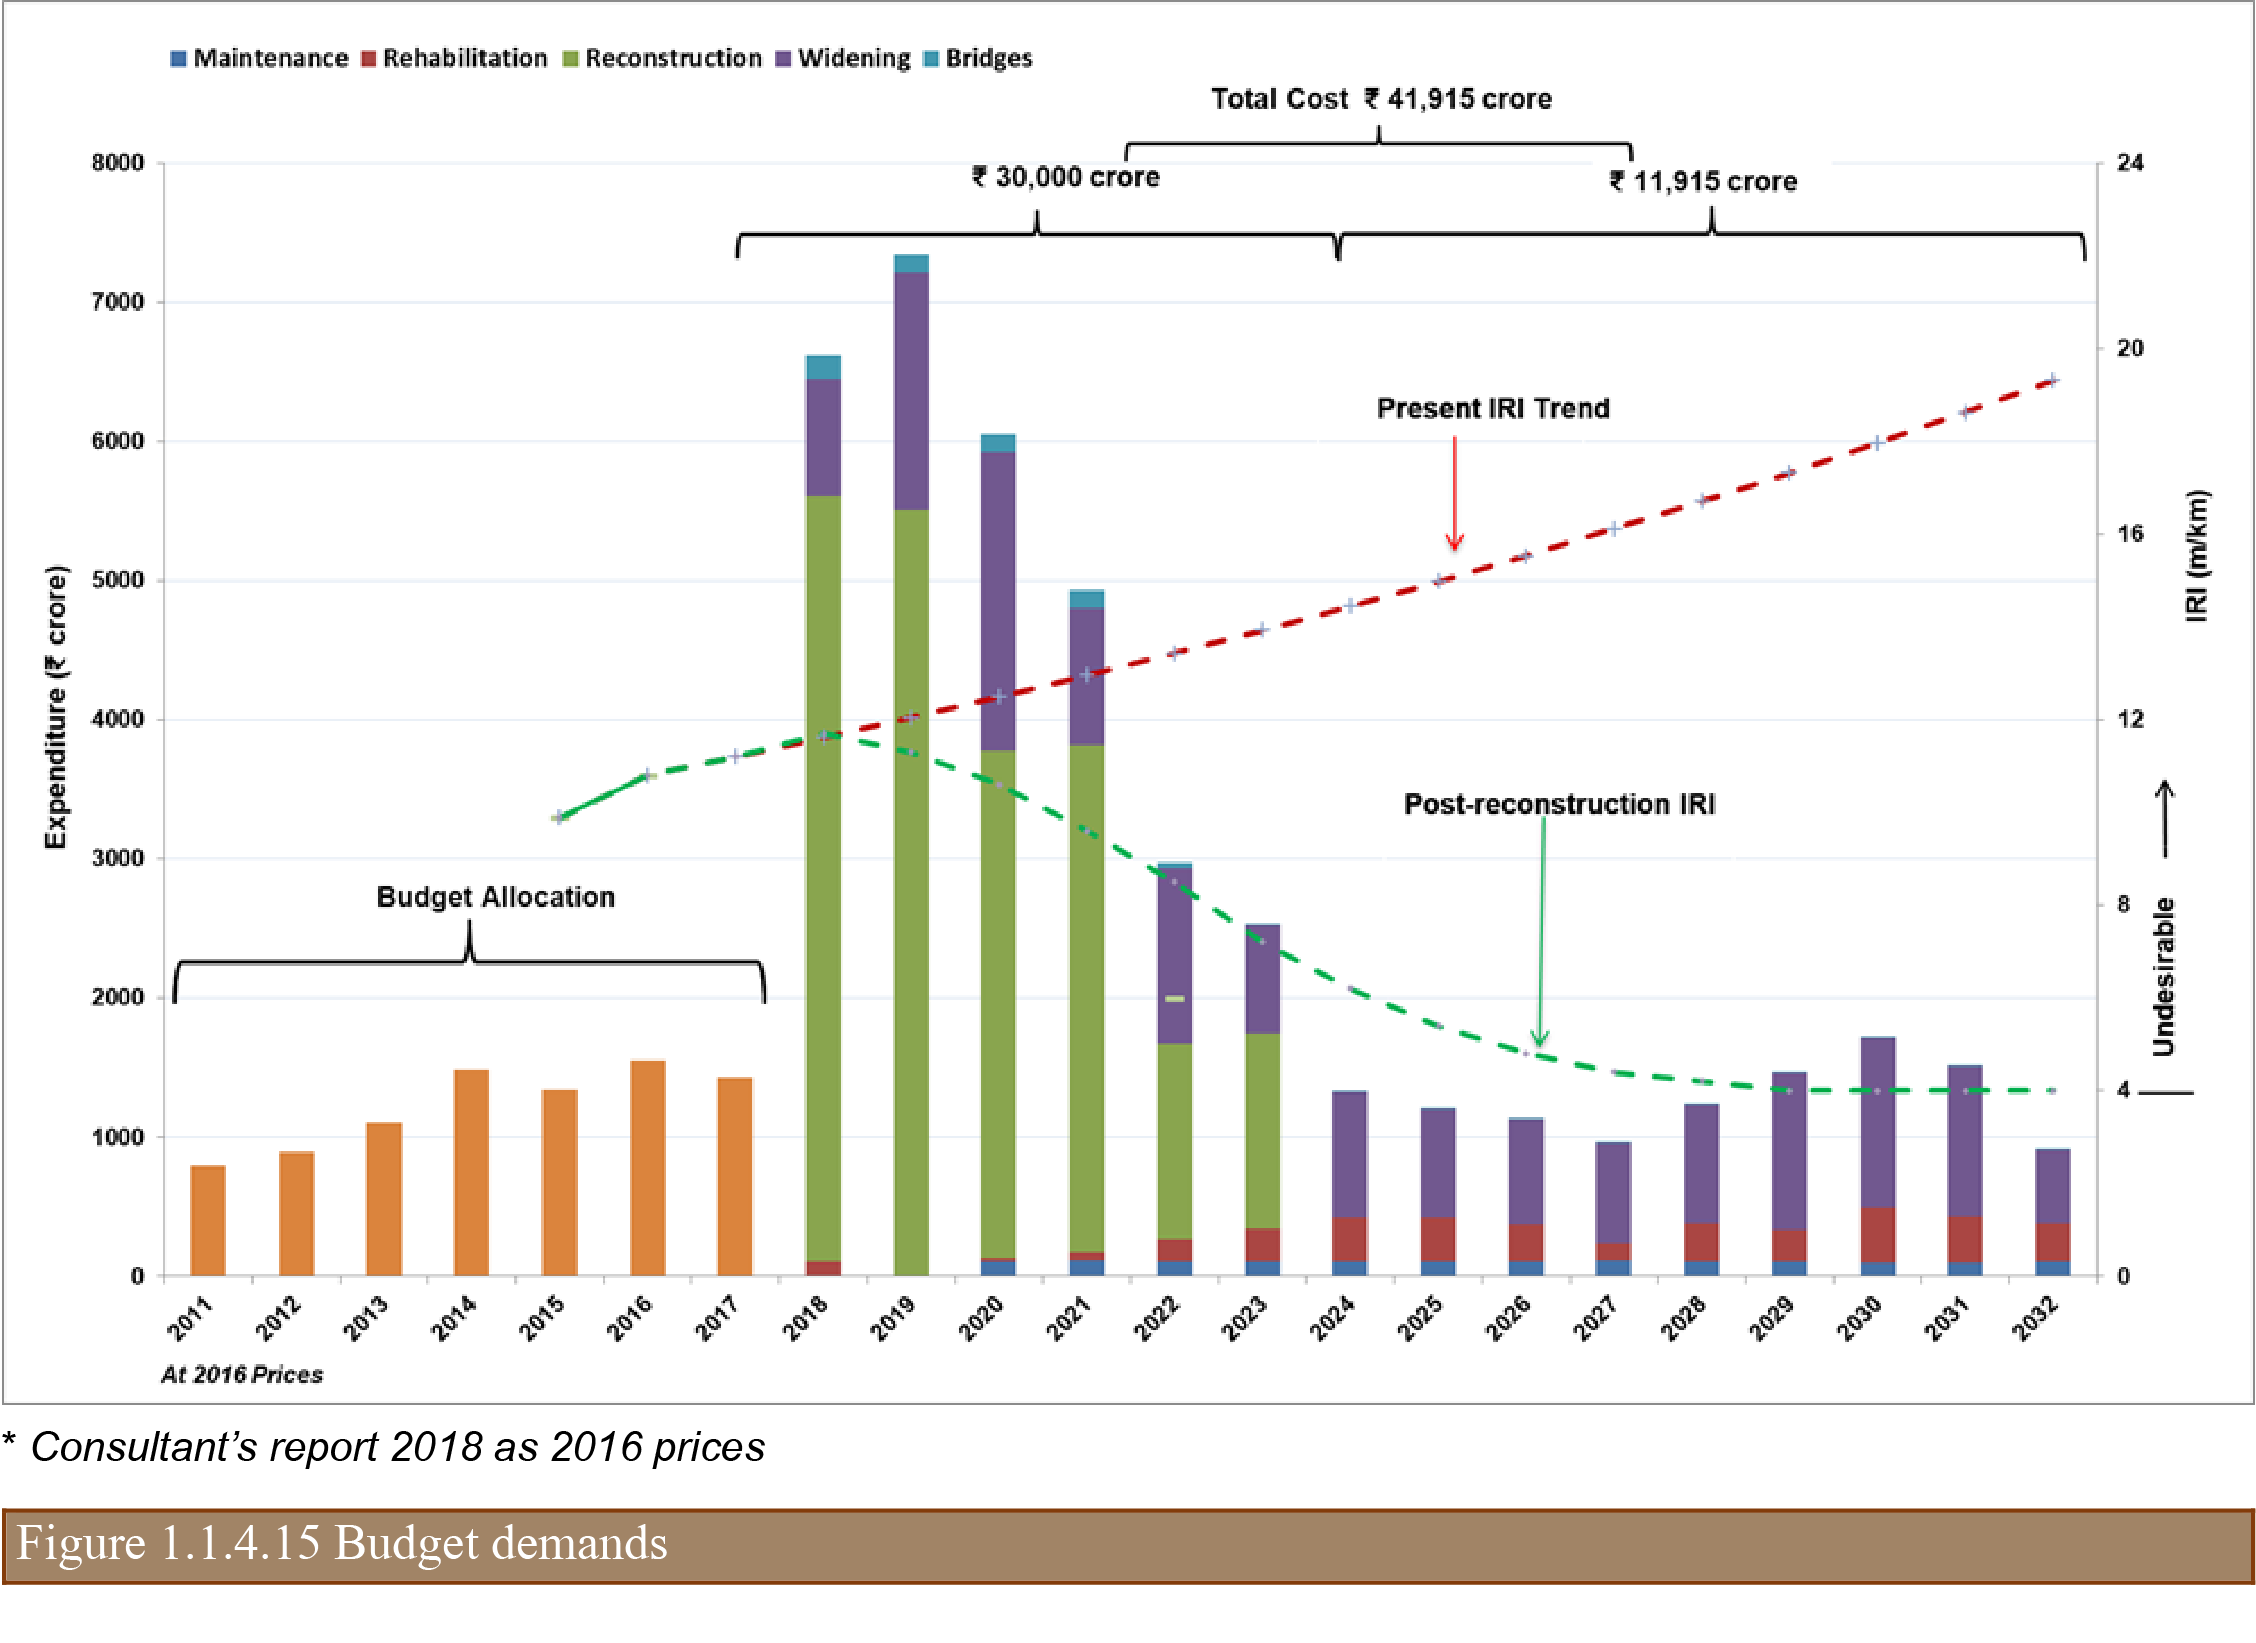
The vast road network with a current asset value of only INR 12,260 crore (USD 1751 million) will further lose its value with time if it is not sufficiently maintained and improved to tackle the distress and traffic demand. Treatments for maintenance and improvements should be suggested for building durable or long-life pavements. To maintain the roads at the desired level of service, adequate and timely provision of budget is also a requisite and should be planned and estimated in advance. A robust network management strategy considering the remaining life of the pavements with emphasis laid on long-lasting pavement (40 year design), use of superior mixes, adequate provision of drainage and raise in embankments to mitigate submergence was developed as listed below:
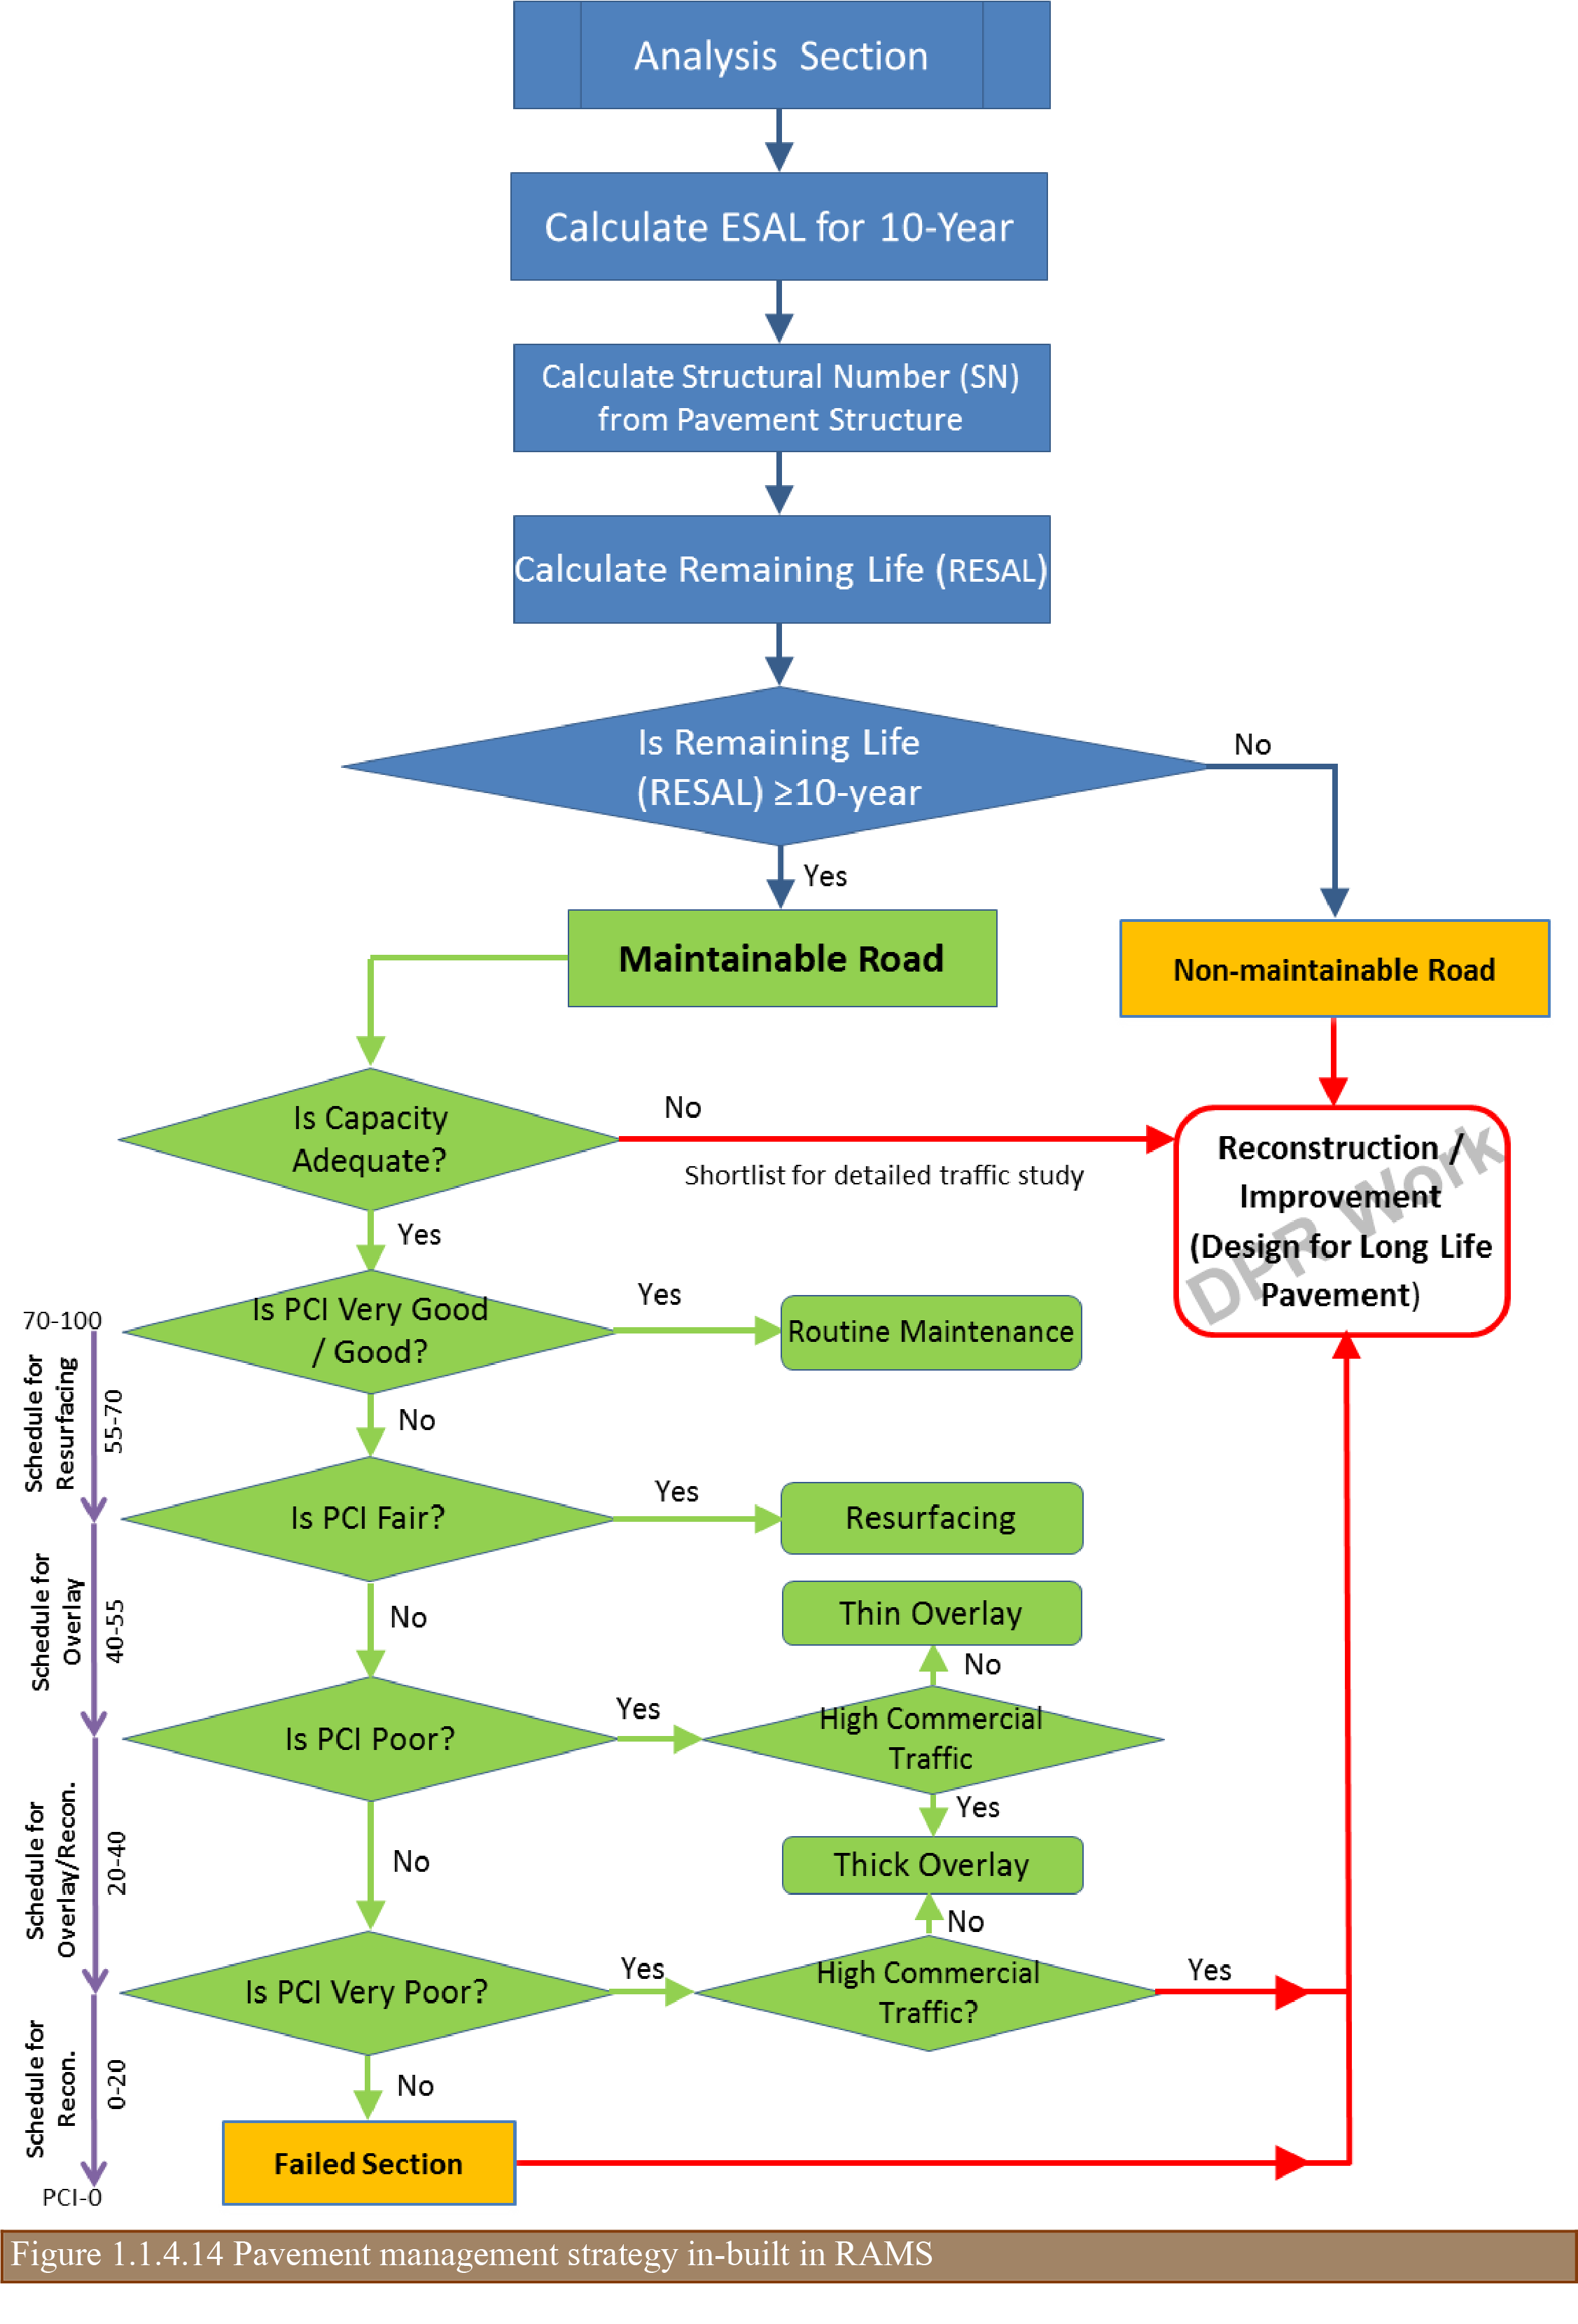
Using the proposed network management strategy and ARAMS application tools, a three-year ‘Action’, a seven-year ‘Strategy’ and a fifteen-year ‘Vision’ plan up to the fiscal year 2031-32 were recommended to rehabilitate the road network and maintain in the desired level of service complying with the planning guidelines of NITI Aayog. The future treatments and costs were based on the current and the anticipated condition of pavements and the expected traffic up to 2031-32. The total requirement for re-construction of SH & MDR by 2031-32 was estimated to INR 41,915 crore (USD 5988 million) and about INR 30,000 crore (USD 4,286 million) in the next 7 years to bring the road network at an acceptable level of service as represented in the graph.
A detailed report on ‘Memorandum to Government of India 15th Finance Commission on Requirement of Funds with Explanatory Notes for Maintenance of Road and Bridge Capital Assets’ was submitted to Finance Commission for their consideration.
As a part of implementation strategy, the state government has also announced the ‘Assam-Mala’ programme. The objectives of this program is to improve the SH & MDR network in the next 15 years for fueling economic growth and bringing the state road infrastructure at par with comparable economies of Southeast Asian countries; to provide quality inter-linkage roads between the National Highways and the rural roads network as well as facilitate seamless multi-modal transportation; and to interconnect economic growth centers with quality transportation corridors and improve inter-state connectivity. The program is expected to have a number of projects under its umbrella. As a major initiative, Government of Assam (GoA) has earmarked INR 5,000 crore (USD 714 million) in the next 3 financial years for improving about 1000 km of road network. It is also planning to rope in additional resources through external funding agencies such as Asian Development Bank, Asian Infrastructure Investment Bank, World Bank, etc. for improvement of another 2000 km road network.
As an interim measure, GoA had also allotted a sum of INR 300 crore (USD 43 million) for maintenance of SH & MDR and PWRD allotted these funds for providing surface renewals / overlay. RAMS application was extensively used to identify the road sections and estimate the maintenance costs for each road sections. The pavement composition, pavement distresses, roughness and deflection, traffic (AADT & CVD), etc. collected on SH & MDR road network in 2017-18 year were reviewed to finalize the road sections.
PWRD has come a long-way in developing a GIS based Road Asset Management System using state-of-the-art equipment for data collection, latest technologies for system development, feel-good user interfaces, and best hardware and network for seamless connectivity and hosting services. Any system developed, if not sustained, will fail one day. To evade such scenario, PWRD has taken up following initiatives towards RAMS sustainability which will be a benchmark / point of reference for other road agencies:
AASHTO, AASHTO Guide for Design of Pavement Structures 1993 American Association of State Highway and Transportation Officials, Washington, D.C., U.S.A., 1993
Asphalt Institute, Asphalt Overlays for Highway and Street Rehabilitation, MS-17, Asphalt Institute, Lexington, Kentucky, U.S.A.,
Asphalt Institute, Thickness Design Asphalt Pavements for Highways and Streets, MS-1, Asphalt Institute, Lexington, Kentucky, U.S.A., 1991
Federal Highway Administration, Highway Statistics 2014, FHWA, Washington, D.C., U.S.A., Dec. 2015
Indian Roads Congress, Guidelines for the Design of Flexible Pavements for Low Volume Rural Roads (First Revision), IRC:72-2015, Indian Roads Congress, New Delhi, India, 2015
Indian Road Congress, Tentative Guidelines for the Design of Flexible Pavements, IRC:37-2017, Indian Roads congress, New Delhi, India, 2012
The FHWA is assisting state departments of transportation (DOTs) in conducting and reviewing the results of an organizational gap analysis, which includes a self-assessment. The self-assessment considers, at a minimum, the adequacy of organizational strategic goals and policies with respect to asset management, whether asset management is taken into account in the agency’s planning and programming of resources, as well as whether the agency is implementing adequate data collection and analysis policies, undertaking whole-life lifecycle cost analysis and undertaking programmatic risk assessments to support an effective asset management program.
Based on the results of the self-assessment, a gap analysis is undertaken to determine which areas of the agency’s asset management process require improvement. The self-assessment questions are available at http://www.fhwa.dot.gov/asset/gap/selfassessment.pdf
The FHWA works with state DOTs in undertaking the asset management gap analysis, which includes the following:
The Highways Agency in the UK (now named Highways England) made it a contract requirement for its asset support contracts for the contractor to undertake a competency assessment against the requirements of PAS 55 (a Publicly Available Specification published by the British Standards Institution (BSI)) in order to assess asset management capability. In the first year, the contractor is required to achieve maturity level 1 and after two years maturity level 2. The approach uses the Institute of Asset Management (IAM) self-assessment methodology and toolkit.
The level 2 assessment takes the following form:
Many road organizations around the world still operate using a silo-like structure, in which the various physical and operational issues such as road capacity and road safety are managed separately, i.e. with no consideration of common strategic objectives. Consequently, organizations tend to focus on the short-term, project-level management of road assets, which, in a context marked by resource shortage and competing stakeholder demands, make it difficult to attain performance goals at the network level.
This chapter discusses several topics related to adapting the structure of a road organization to unleash the potential of asset management, and support the organization in achieving its objectives. These topics comprise leadership and culture, self-assessment of current asset management practice, asset management champions and their crucial role in promoting the required changes, and the organizational structure suitable to implementing asset management. Also, it covers the personnel competencies that should be developed to meet the requirements of asset management, which fall under a number of knowledge areas thus showing the multidisciplinary nature of asset management.
For asset management to be successful, a road organization must have in place a corporate structure that facilitates the implementation and delivery of asset management by appropriately empowered and competent staff (UKRLG and HMEP 2013). This organizational structure must be fully supported by the leadership.
The assessment of current asset management practices may reveal the need for an important corporate change to attain the potential of asset management. Depending on the differences between actual and recommended practice, the implementation of a comprehensive change strategy may be required, which should be driven by the organization trying to reach the level of maturity.
The change strategy has to identify what needs to be done and how the organization’s executives will involve and motivate staff in achieving the benefits pursued. Typical processes of this corporate change include integrating asset management into business processes and organizational culture, establishing asset management roles, and setting performance management standards (FHWA Transportation Asset Management Expert Task Group 2013). These standards, in particular, may be supported by agency agreements with the government.
Many road organizations around the world still function based on a silo-like organizational structure, in which the areas responsible for managing the various asset types (pavements, bridges, slopes, and so on) operate almost in isolation, without an integrated vision to achieve the corporate objectives. Asset management aims at aligning and linking processes so that all business units within an agency operate in a coordinated fashion rather than independently (FHWA 2012), based on a unified view of asset management policy and strategy taken at the leadership level (UKRLG and HMEP 2013).
Frequently, adopting the structure for asset management will present greater challenges than putting to work new technical or analytical procedures (FHWA 2012). This might be particularly the case with developing countries, where the resources and staff necessary for the institutional change may not be available, thus inhibiting the implementation of asset management. In such circumstances, greater effort is usually required from the supporters of change to make the case for asset management.
The changes required to adopt the asset management framework usually involve a deep transformation of the road organization, which should be supported by strong leadership and commitment. Such leadership must be in place from the moment the need to implement asset management is first recognized so that the organization conducts, as a first step, a self-assessment exercise for identifying the required changes. Very often, the initial steps towards a corporate transformation are actively promoted by asset management champions.
Results from the self-assessment exercise typically include new or modified business processes, workflows, activities, or tools that should be put into practice. In general, organizational structures existing prior to the adoption of asset management are inappropriate to accommodate those innovations smoothly, and, therefore, the shape of the road organization must be rethought to establish the roles and information flows that will better serve the chosen approach to asset management. Moreover, the new roles will likely require new staff competencies that extend far beyond the traditional areas of road engineering.
The following sections provide greater detail concerning leadership and culture, self-assessment, champions, asset management roles, and competency requirements.
Leadership has a strong influence on the culture and behavior of all organizations. Clear direction and priorities will ensure that both significant and apparently minor decisions made across the organization support a consistent approach to achieve the business objectives. Such decisions include appropriate investment decisions to reflect the asset management strategy (UKRLG and HMEP 2013).
Below is a list of some of relevant aspects of leadership and organizational culture as applied to asset management:
The self-assessment’s aim is to benchmark the current asset management practices of the organization and identify specific opportunities for improvement (Cambridge Systematics et al. 2002). The main objectives of self-assessment include the following:
One of the most important steps in implementing asset management is to identify the organizational policies and goals to be achieved, which will define the agency’s most important priorities. Asset management is a customer-focused, goal-driven management and decision-making process. Organizational goals, policies, and budgets establish a consistent evaluative philosophy. Goals and performance measures are the levers that drive the decision framework, establishing investment scenarios that reflect levels of service and making resource commitments consistent with the perceived needs of stakeholders. Analysis procedures regarding alternative options are used within this framework (FHWA 2012).
It seems to be universal that, at least in the early stages of implementing an asset management framework, there will be a need for a champion, who can be anyone with sufficient interest and influence to promote organizational changes. A champion may be designated by someone in top-level management or he may simply emerge from among the members of the involved groups. In any case, a champion is one who does not rest until the mission is accomplished. Candidate champions include the following:
The champion for implementing an asset management framework will face the challenge of prevailing in any deliberations and debates about why such a differentiated approach is needed at all.
Arguments about the unique significance of the road system, the benefits (and complexity) of a risk-based approach, the need for mitigation strategies and contingency plans, and the interests of stakeholders are likely to be relevant to the champion (Cambridge Systematics et al. 2009).
In designing the most suitable organizational structure to support asset management, road organizations may choose either a centralized or a decentralized approach. While the former facilitates consistency of processes and work methods, it also entails the risk of making asset management appear remote for the areas responsible of service delivery, which may not fully understand the policies defined centrally. On the other hand, in some circumstances a decentralized structure may result in a fragmented asset management approach and culture.
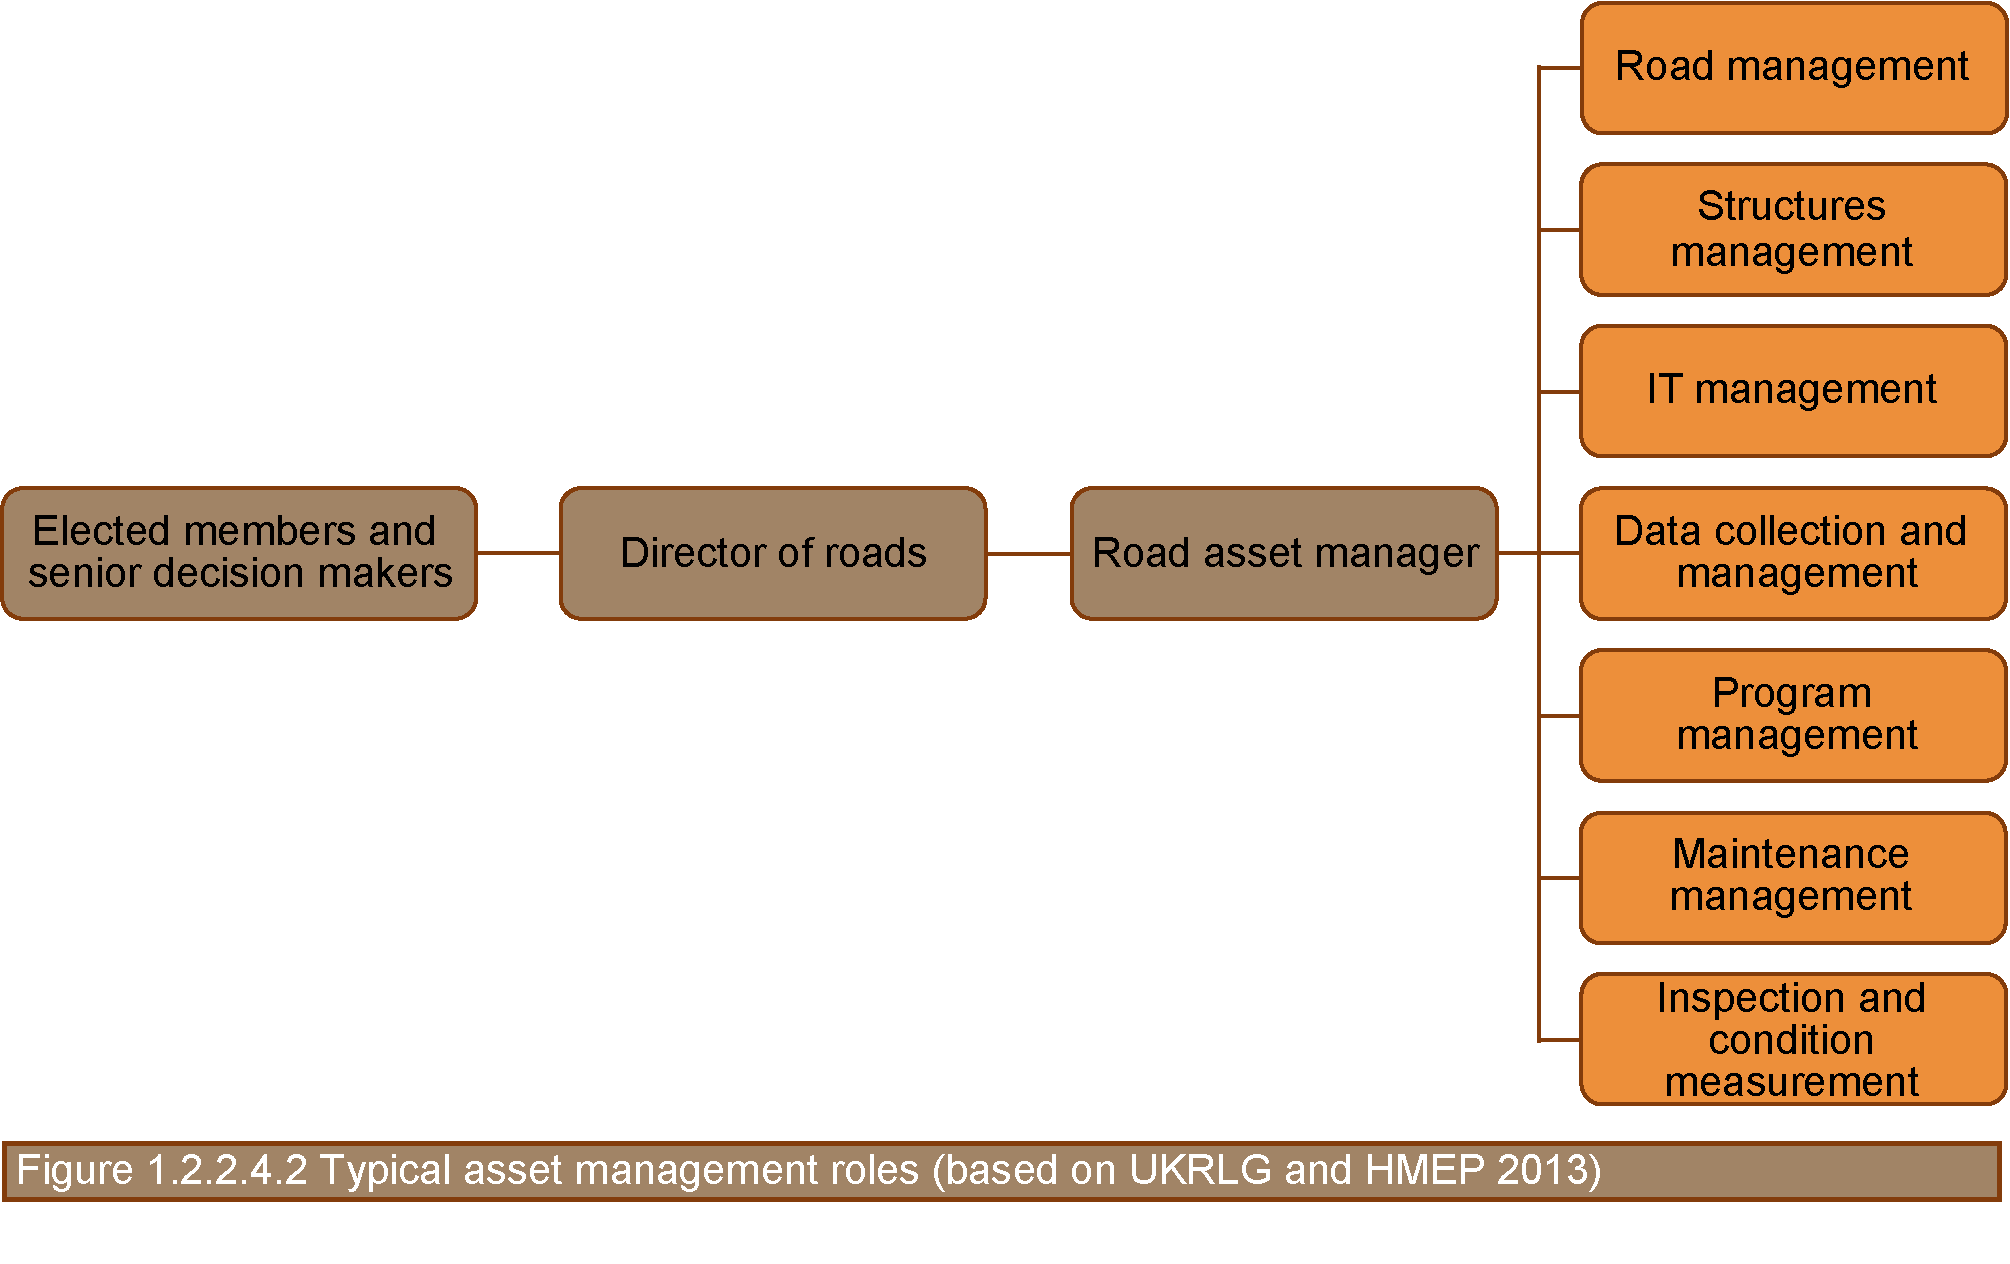
Regardless of the organization type chosen, the roles and relationships driving asset management should clearly establish the strategic, tactical, and operational levels within an organization, as shown in Table 1.2.2.4 (UKRLG and HMEP 2013).
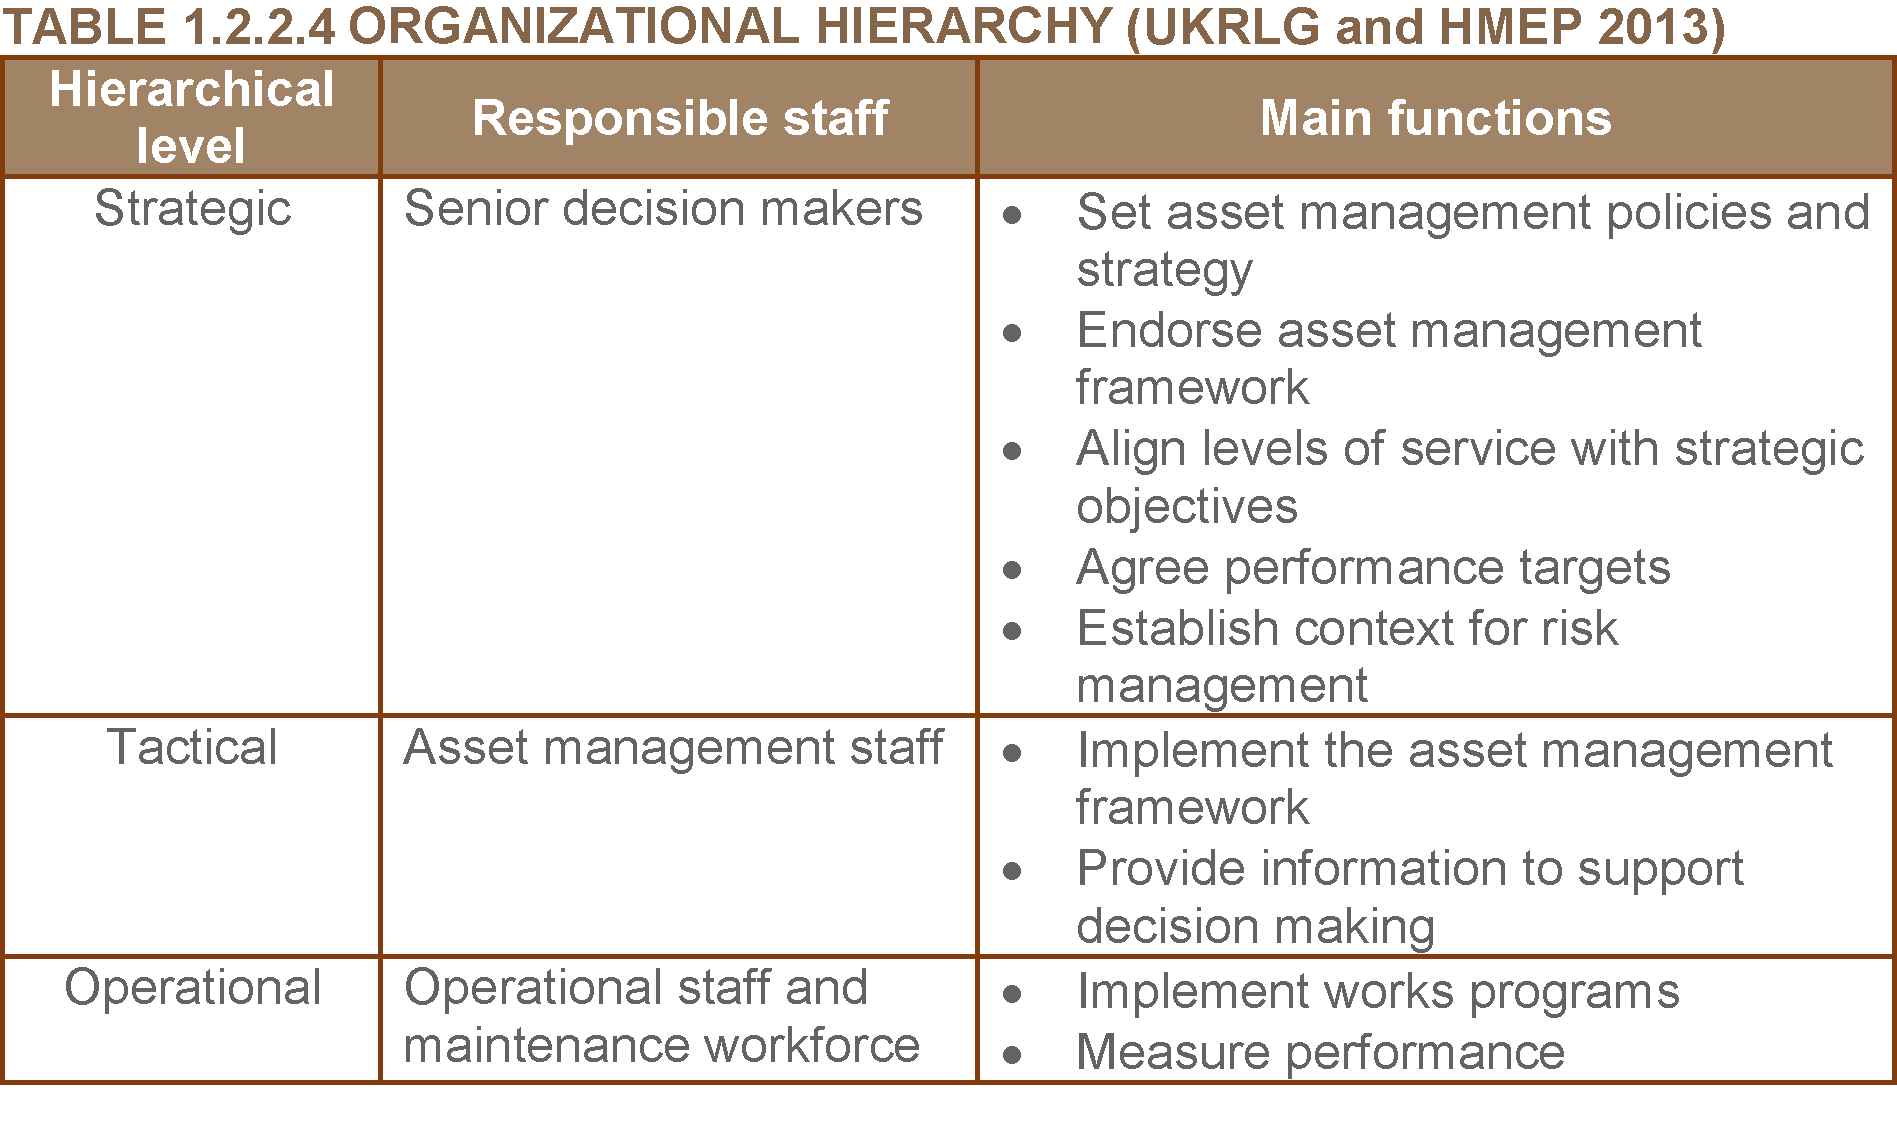
The asset management functions included in Error: Reference source not found are discussed throughout this manual.
Key roles for developing and delivering asset management include the following (UKRLG and HMEP 2013):
The actual positions and relationships among these roles that should be defined within each organization largely depend on the results of the self-assessment exercise.
At the basic maturity level, asset management may rely on just one person or a small group with multi-disciplinary training and experience. As the organization moves to the proficient level, asset management will involve the coordinated effort of various workgroups and multiple individuals.
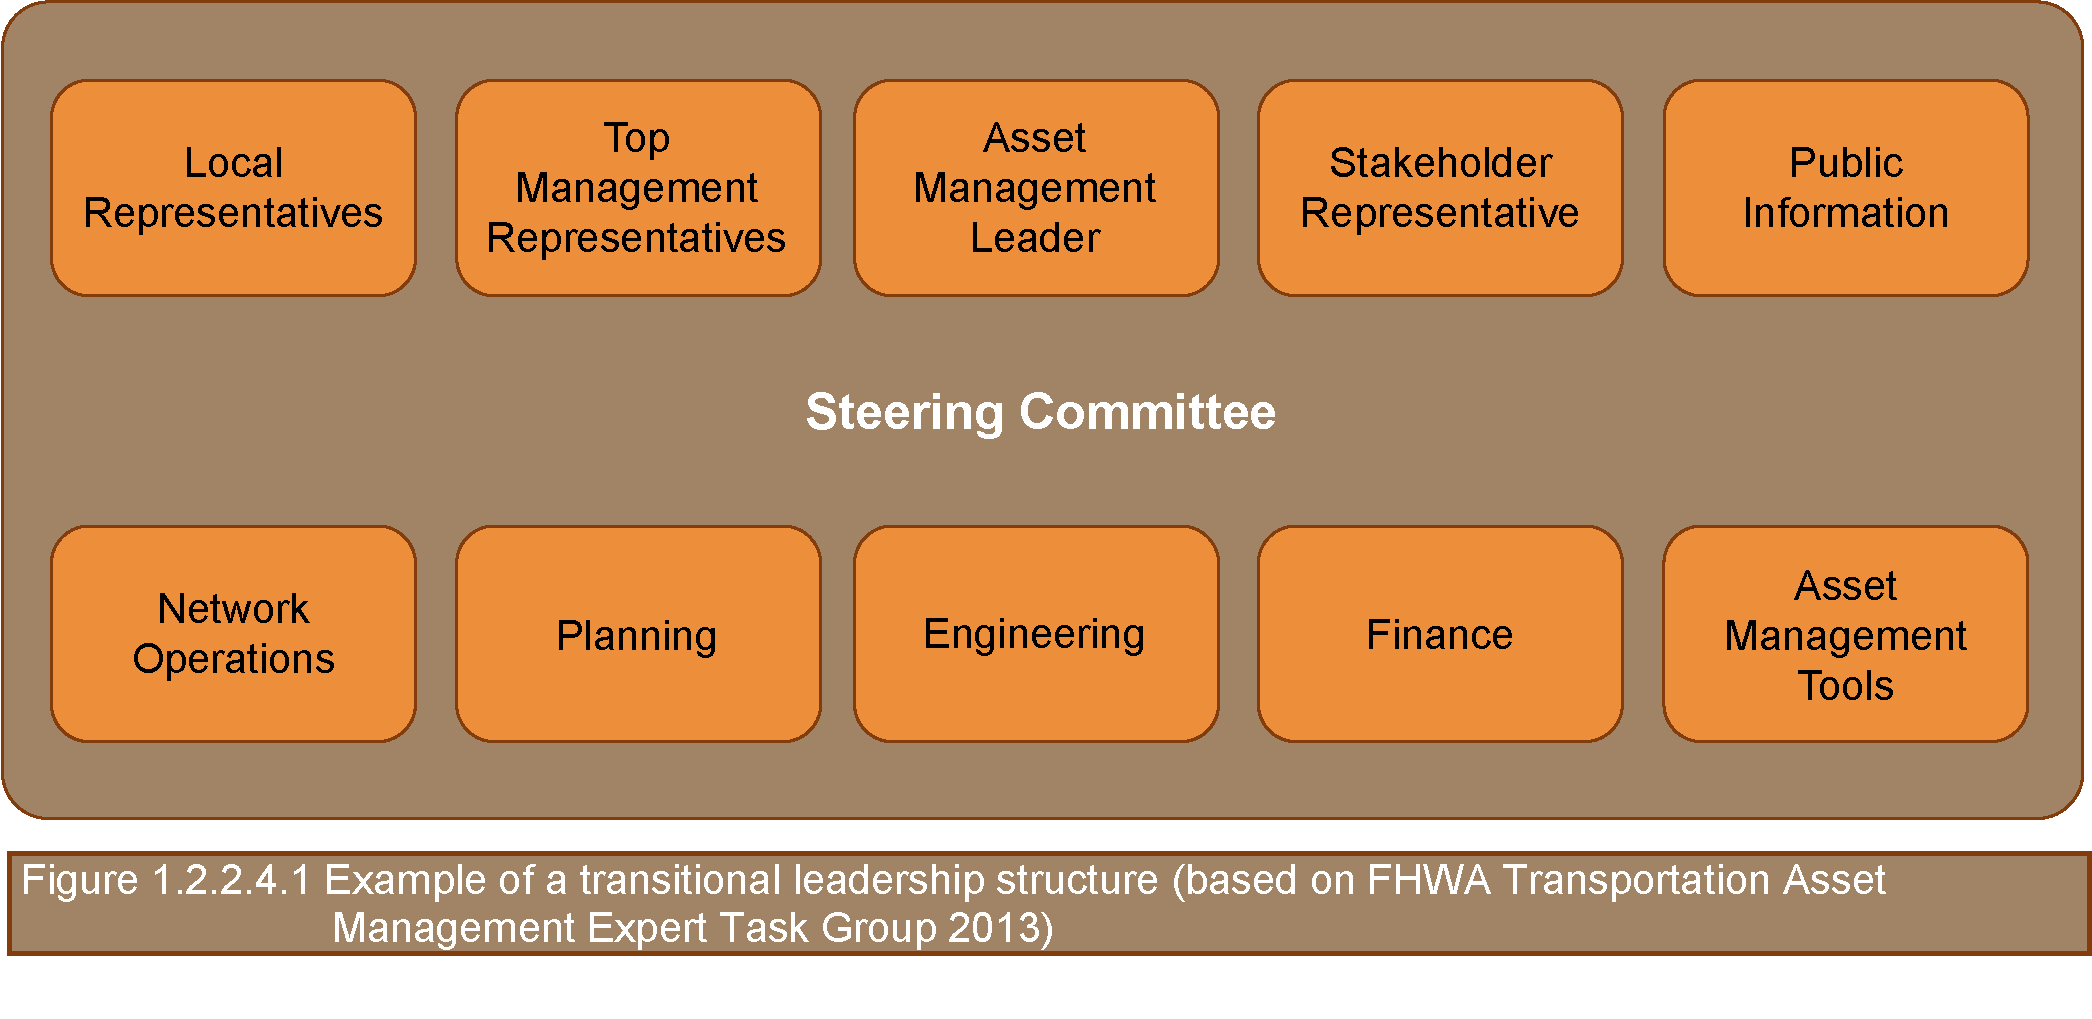
Defining new roles and managing the transition from a small group to a formal, mature asset management team is an important leadership task (FHWA Transportation Asset Management Expert Task Group & AASHTO 2013). It requires a consideration of individual, team, and organizational expectations as well as a vision for how the process will change as the formal asset management team is established and developed. Figure 1.2.2.4.1 shows an example of how a transitional asset management team might be composed.
As with any major project in a road organization, the re-engineering of the corporate structure needs a project manager or project leader, who will be devoting most of his/her time to the project. A feasible candidate to play this role might be the chief executive officer of the organization or a properly empowered senior manager. The most important skill of the project manager would probably be his/her ability to build teams. The attribute list for this person should also include motivation and persistence in overcoming the inevitable barriers that appear whenever an organizational change is attempted. The project manager may come from an engineering, economics, or planning background or, preferably, from a combination of more than one of these disciplines.
A steering committee of senior managers, overseeing the work of the asset management leader, is also essential to ensure that all parts of the asset management process function together as a unit. Sufficient resources are vital to the effective implementation of asset management, including adequate training for agency staff to ensure availability of the necessary skills and understanding to implement asset management successfully.
Clear role descriptions for those carrying out asset management tasks and requirements should then be developed. There is likely to be new competency requirements within the organization and training programs in asset management to support the proposed changes.
As stated earlier, there is no single way of defining roles for asset management. However, an organizational structure suitable to delivering asset management typically includes the roles depicted in Figure 1.2.2.4.2 (UKRLG and HMEP 2013).
Senior management should identify the competencies necessary to meet the requirements for adopting asset management. Where these competencies are not available in the organization, training of staff may be required. Recruitment, mentoring, or collaboration with other authorities may also be considered (UKRLG and HMEP 2013).
If competencies or resources are not available, external support can be an effective way of addressing gaps, particularly when there is a need to build capability within the organization. It is important that ownership is retained within the agency and that asset management staff have enough knowledge to be smart purchasers.
Competencies may fall under a number of categories, including the following:
There are a number of international training resources for asset management, some of which can be accessed at no cost. These include the following:
Cambridge Systematics, Inc., Applied Research Associates, Inc., Arora and Associates, KLS Engineering, PB Consult, Inc., and Louis Lambert. 2009. NCHRP Report 632: An Asset-Management Framework for the Interstate Highway System. Transportation Research Board of the National Academies. Washington, DC. Last accessed July 24, 2015 at http://onlinepubs.trb.org/onlinepubs/nchrp/nchrp_rpt_632.pdf.
Cambridge Systematics, Inc., Parsons Brinckerhoff Quade & Douglas, Inc., Ray Jorgenson Associates, Inc., and Paul D. Thompson. 2002. Transportation Asset Management Guide. American Association of State Highway and Transportation Officials. Washingtom, D.C.
Federal Highway Administration (FHWA). 2012. Executive Brief: Advancing a Transportation Asset Management Approach. Federal Highway Administration Office of Asset Management. Washington, DC. Last accessed July 29, 2015. http://www.fhwa.dot.gov/asset/pubs/if12034.pdf.
Federal Highway Administration (FHWA) Transportation Asset Management Expert Task Group. 2013. AASHTO Asset Management Guide—A Focus on Implementation. Executive Summary. American Association of State Highway and Transportation Officials. Washington, DC. Last accessed July 29, 2015. http://www.fhwa.dot.gov/asset/pubs/hif13047.pdf.
United Kingdom Roads Liaison Group (UKRLG) and Highways Maintenance Efficiency Programme (HMEP). 2013. Highway Infrastructure Asset Management Guidance Document. Department for Transport, London. Last accessed July 24, 2015. www.ukroadsliaisongroup.org/download.cfm/docid/5C49F48E-1CE0-477F-933ACBFA169AF8CB
These practices have been tested in several instances and case studies are being prepared. They will be presented here when available. If you want to share a case study, please contact assetmanagementmanual@piarc.org.
The asset management strategy should be a clear and concise high level document setting out how road infrastructure asset management is delivered for the road organization, to meet its long-term corporate goals and objectives.
The following chapter focuses on the explaining what is an asset management strategy, the reasons for a road organization having one; which objectives this strategy should comply, and what aspects should be covered. It also provides information regarding the maturity levels applied for an organization demonstrating asset management strategy principles.
The asset management strategy should be a clear and concise high level document setting out how road infrastructure asset management is delivered for the road organization to meet its long-term corporate goals and objectives.
The development of an asset management strategy is one of the key components in the asset management framework. The key objective of the asset management strategy is to provide direction to the management and maintenance (PIARC 2013) of the road assets by providing a line of sight between the organizational goals and its asset management activities and ensuring that the required results are achieved.
The asset management strategy (PIARC 2014) sets out what the long-term objectives of the organization are for managing its road infrastructure assets. It should also describe how they are met. The organization’s long-term objectives should include meeting its legal obligations, managing the requirements of road users, meeting the demands from central government and the organization itself, as well as summarizing the overall requirements for the performance of road infrastructure within the context of any constraints, such as funding.
The asset management strategy sets a clear direction for the implementation of asset management and provides a link with other relevant transportation and funding strategies (PIARC 2016), including those of donor agencies. It provides the basis for the organization to adopt asset management principles to achieve greater efficiency and value for money as well as improve the organization’s overall performance. It can also describe the economic benefits of investing in the maintenance of roads. The strategy also sets out how asset management activities are implemented, measured, and continuously improved.
In preparing its asset management strategy, the organization should undertake a thorough review of its key documents and plans and identify key statements and objectives such as transport goals and improvement of road condition. The organization’s review of its asset management framework, including delivery of the asset management strategy itself, performance requirements and work programmes, may also lead to the strategy including actions that improve current asset management practices.
The strategy should cover a number of aspects regarding the planning, delivery, and management of road infrastructure assets and how these are delivered over the short, medium, and long term. Typically, these aspects may include the following (PIARC 2016, PIARC 2017):
The strategy should be prepared by the staff responsible for asset management. It must be supported by the senior leaders in the organization in a clear way and be endorsed by senior decision makers. Ideally, it should be a short standalone document that is concise and available to all those who have an interest in asset management. If the organization has a website, the strategy may be posted on it. The asset management strategy is a high-level document that takes a long-term view and will only need to be updated when there is a change in policy or approach or to reflect improvement actions undertaken following the maturity self-assessment.
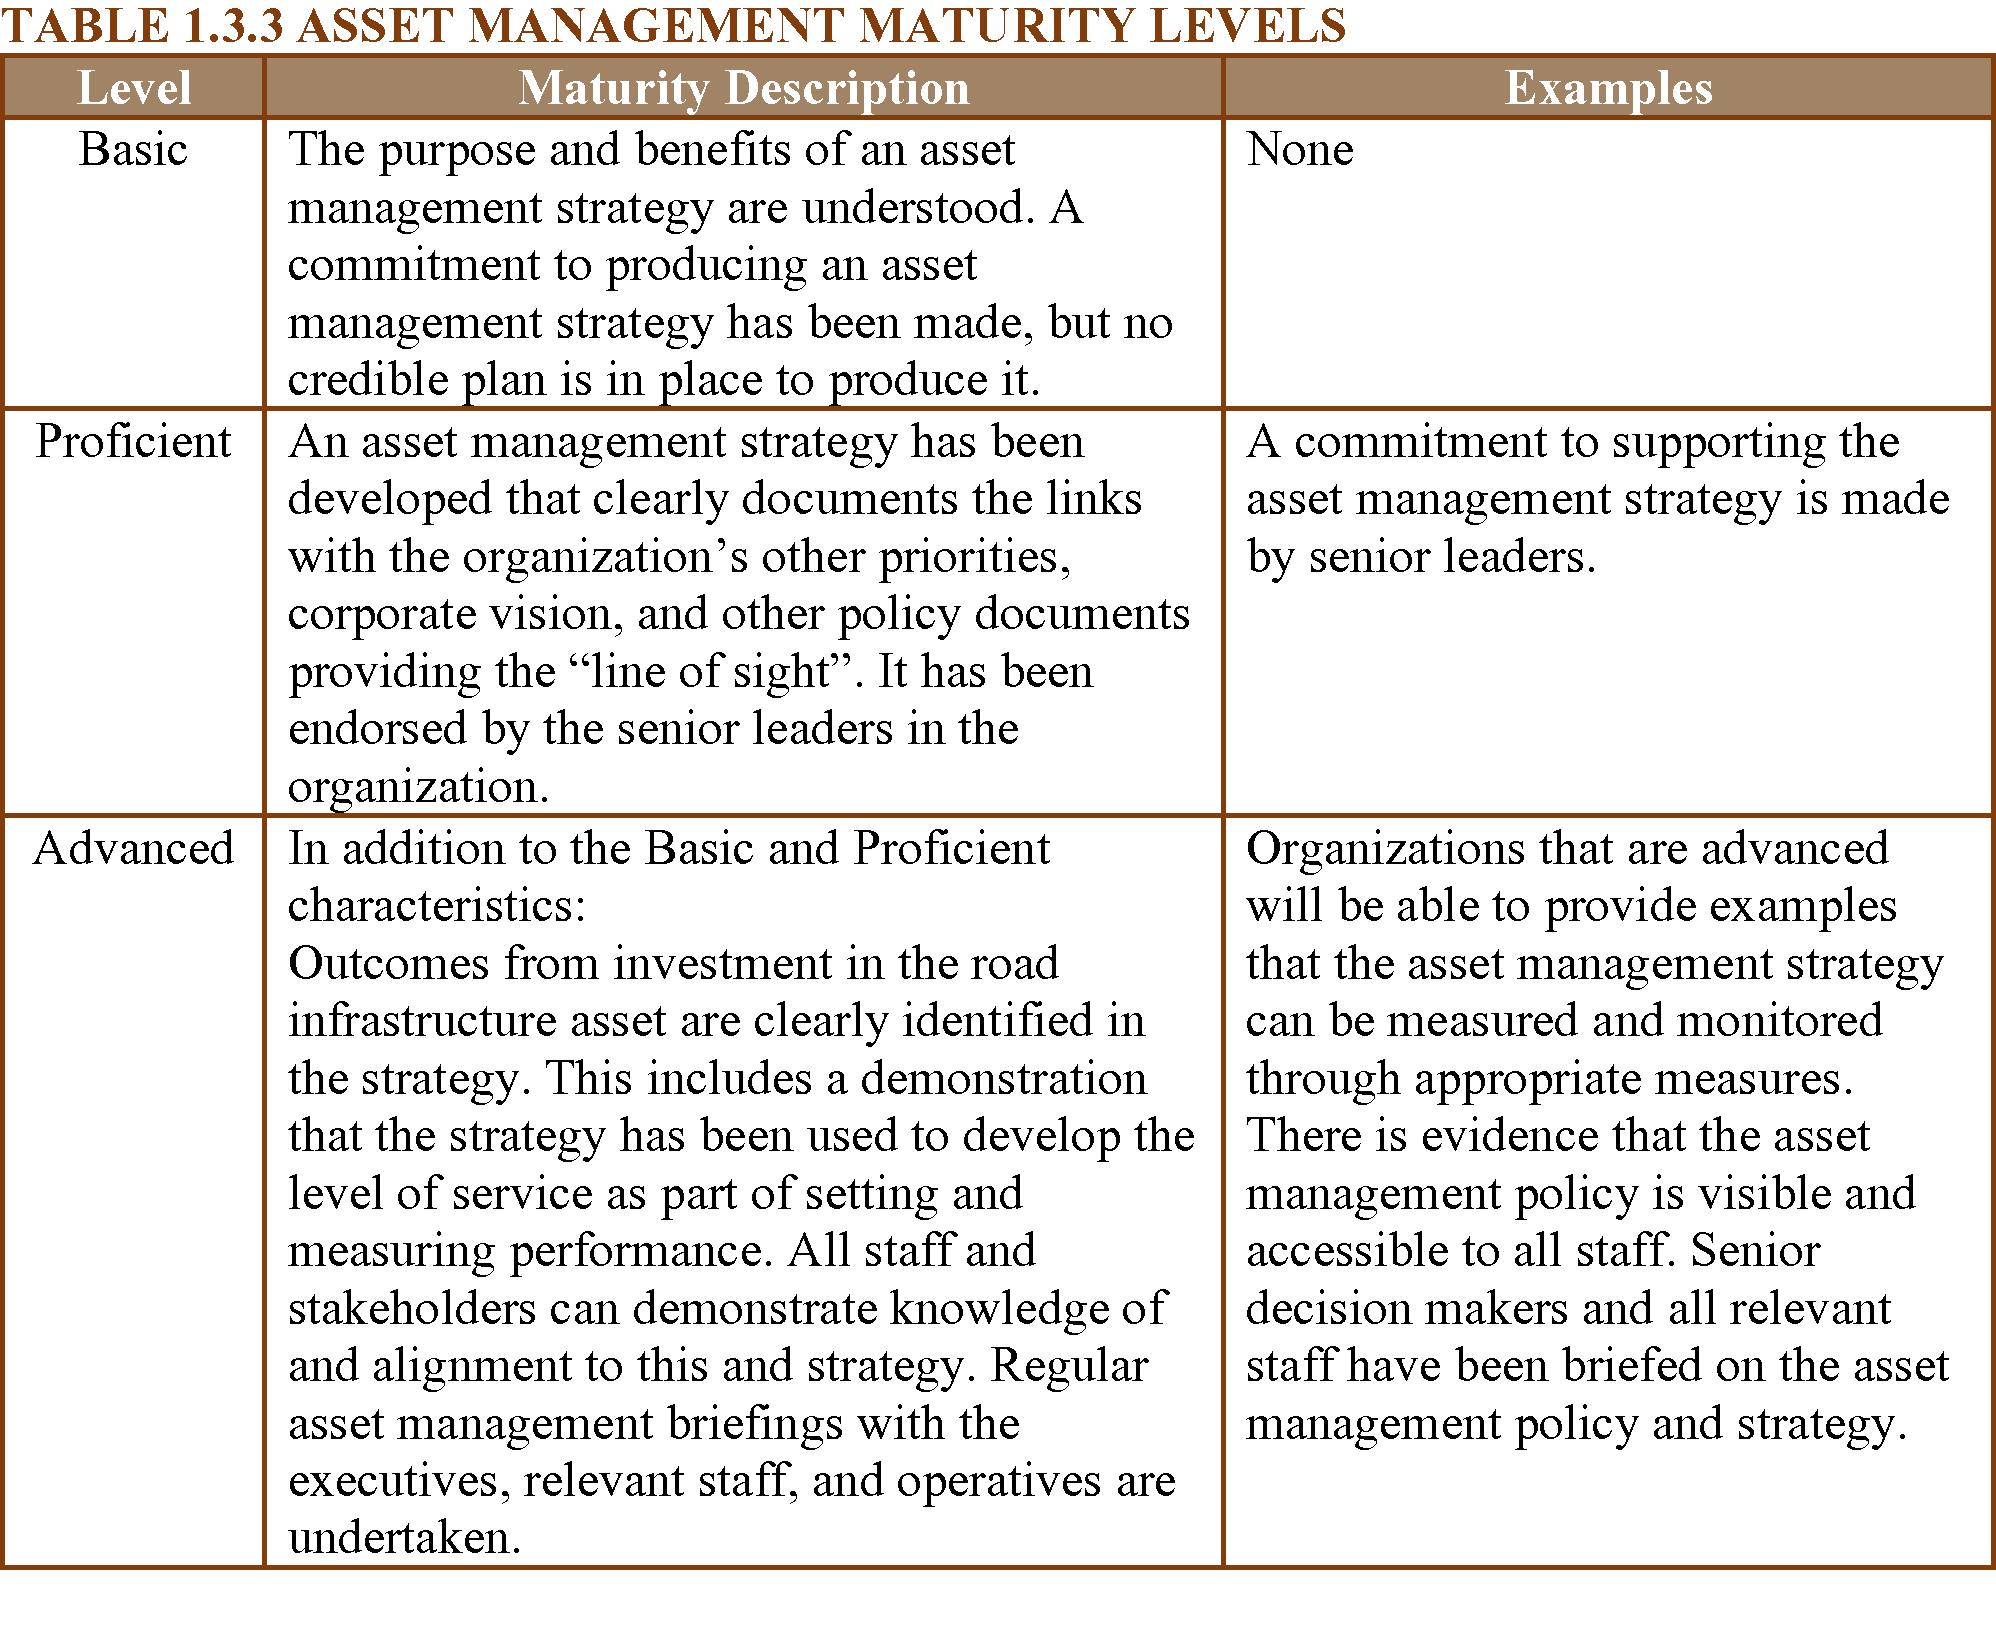
The maturity levels for an organization demonstrating asset management principles are shown in Table 1.3.3. Organizations may assess their maturity against this scale.
Source: Based in Highways Maintenance Capital Funding: Self-assessment questionnaire for incentive fund
AASHTO, Transportation Asset Management Guide—A Focus on Implementation. January 2011. Last accessed May 2017, http://onlinepubs.trb.org/onlinepubs/nchrp/docs/AASHTO_TAMGFI-1.pdf.
AASHTO, The AASHTO TAM Portal, Last accessed May 2017, http://www.tam-portal.com/.
Department for Transport (DfT), Highways Maintenance Capital Funding, Self-assessment questionnaire for incentive fund, United Kingdom, http://www.trb.org/NCHRP750/ForesightReport750Series.aspx, https://www.gov.uk/government/uploads/system/uploads/attachment_data/file/487481/guidance-and-self-assessment-questionnaire.pdf.
Institute of Public Works Engineering Australasia (IPWEA) The International Infrastructure Management Manual (IIMM), 5th edition, January 2015
International Organization for Standardization (ISO), ISO 55000:2014 Asset management -- Overview, principles and terminology.
Transport Research Board (TRB), NCHRP Report 750: Strategic Issues Facing Transportation, Volume 6: The Effects of Socio-Demographics on Future Travel Demand, Last accessed May 2017.
PIARC 2013. Maintenance methods and strategies, D.2 Road Pavements, PIARC Paris France, ISBN : 978-2-84060-323-8, (https://www.piarc.org/ressources/publications/7/19456,2013R08-EN.pdf).
PIARC 2014. The importance of road maintenance, ISBN : 978-2-84060-349-8, (https://www.piarc.org/ressources/publications/1/22262,2014R02EN.pdf).
PIARC 2016. Assessment of budgetary needs and optimisation of maintenance strategies for multiple assets of road network, Technical Committee 4.1 Management of Road Infrastructure Assets, ISBN : 978-2-84060-378-8, (https://www.piarc.org/ressources/publications/8/24533,2016R04EN.pdf).
PIARC 2017. Management of road assets: Balancing of environmental and engineering aspects in management of road networks, Technical Committee 4.1 Management of Road Infrastructure Assets, ISBN : 978-2-84060-455-6, (https://www.piarc.org/ressources/publications/9/27317,2017R05EN.pdf)
United Kingdom Roads Liaison Group (UKRLG) and Highways Maintenance Efficiency Programme (HMEP). 2013. Highway Infrastructure Asset Management Guidance Document. Department for Transport, London. Last accessed December 28, 2016, http://www.ukroadsliaisongroup.org/en/utilities/document-summary.cfm?docid=5C49F48E-1CE0-477F-933ACBFA169AF8CB.
The following case studies are presented in this chapter:
CASE STUDY 1: Northeast Ohio Areawide Coordinating Agency (NOACA), Cleveland, Ohio, USA
CASE STUDY 2: Asset Management strategy ANAS S.p.A. Italy
JASON J. BITTNER & DAVID K. HEIN, Applied Research Associates, Inc., USA & Canada
In order to ensure that the condition of the roadway is adequate to maintain the usability, comfort, and safety of the travelling public, concession agreements usually include a set of conditions outlining the type and frequency of monitoring and the minimum acceptable levels of pavement performance. The ability to meet these criteria is an important part of the project and is outlined in the operations, maintenance, and rehabilitation plan.
The performance of pavements and their compliance to the project requirements can be measured in a variety of ways. Typical concession agreements focus on the components that most impact the safety and ride comfort level of pavement. The most common conditions identified in the concession agreements for highway projects include:
IRI has become the element of choice to reflect the ride comfort level of a pavement. IRI reflects the serviceability of the pavement, the ride comfort (Patterson), and even the amount of vehicle fuel consumption (Taylor). Typically, a maximum value of IRI is specified for a given section length (i.e. average IRI of 2.5 m/km for each 50 m length of a lane). In addition to a maximum IRI value, it is also becoming common for the concession agreements to also specify a given distribution of IRI values to ensure that the entire network is not maintained at only the minimum level of acceptability. A typical IRI profile cumulative distribution used in can be seen below (NBDOT).
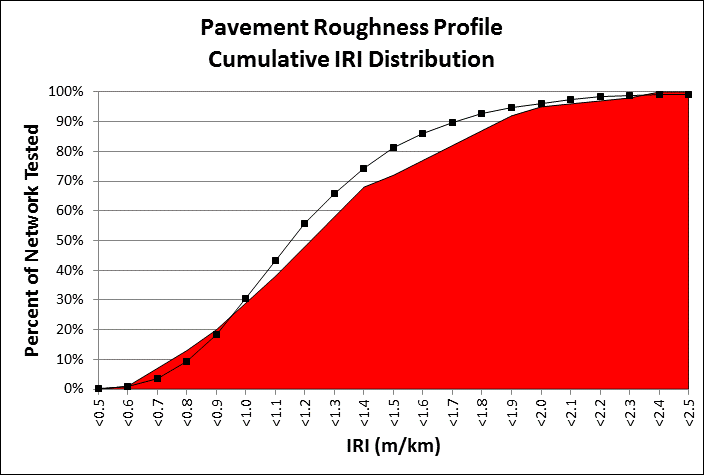
A highway concession may have thousands of 50 m sections. The percent of 50 m sections in each “bin” of IRI range from 0.5 to 2.5 m/km. For example, the figure shows that 50 percent of the sections must have an IRI of less than 1.25 m/km. The curve in the figure shows that about 60 percent of the sections have an IRI of less than 1.25 m/km which is compliant, but the curve moves into the red (non-compliant zone) for number of sections requiring an IRI of less than 0.9 m/km.
A unique component of some of the concession agreements is the use of key performance indicator distributions such as those shown in figure above. These distributions add a new level of complexity to the prediction and budgeting of rehabilitation activities.
Typical PMS software applications allow for a large variety of goals during the forecasting analysis. However, they are not designed to meet the dynamic needs of the distribution analysis. This has proven to be one of the more difficult aspects of performing long term forecasting (ie. 5 years). The most optimal plan for a concessionaire is to plan rehabilitation activities such that in conjunction with the deterioration of non-rehabilitated sections just meets the distribution of IRI in the following year. Traditional pavement performance models for IRI would be developed through an age versus IRI graph. The following figure shows the age versus IRI graph for a typical highway conditions with more than 5,000 pavement management sections each 50 m in length.
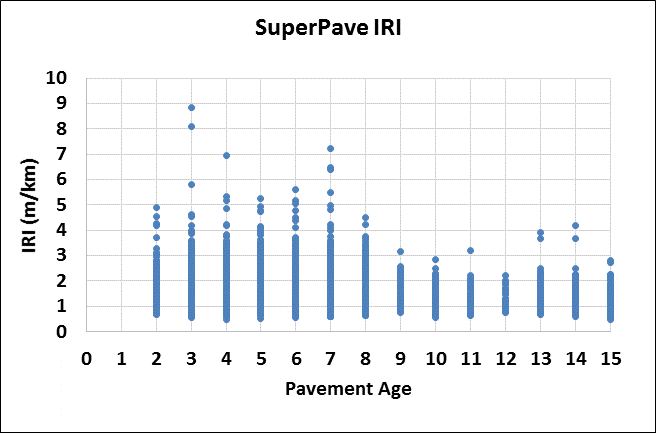
Clearly, it is not possible to fit a traditional performance curve thought this IRI data. Ideally, the overall roadway condition should be hovering just over the distribution line. In order to change the distribution, it is important to understand that improving the condition of an individual section will alter the shape of the distribution of all section with better performance. This means that many minor preventative maintenance activities on the network, although the most cost-effective treatment for the pavement, will not significantly change the distribution. By locating the poor performing sections on the distributions and simulating the results of the repair, an estimate of distribution can be created to assess any other areas of the curve that many need to be adjusted. For areas that affect the performance at around the 50 percent mark of the distribution, localized cost-effective rehabilitation and maintenance alternatives can be used to change the shape and ensure overall compliance.
The nature of the requirements for IRI, is such that pavement sections exhibiting an IRI of greater than 2.5 mm/m are scheduled for rehabilitation each year. The rehabilitation action taken may be very localized to address a bump or settlement and as long as the IRI for the 50 m section is reduced to below 2.5 m/km, the section is in compliance with the project requirements. Predicting when an individual section may exceed the 2.5 mm/m limit is very difficult as “rough” pavement sections may appear very quickly.
In order to develop an indication of the impact of the pavement maintenance and rehabilitation program on the distribution of IRI as compared to the concession IRI requirements, an analysis of the rate of change of IRI was completed. The average rate of change of IRI of 1.6 percent through the past 5 years was selected to represent the typical reduction in smoothness for sections that were not improved by maintenance or rehabilitation action. This average reduction in IRI was then applied to the all of the measured IRI for all 50 m sections that were not improved to determine the expected IRI for each section. For sections that were improved, the IRI values were “reset” and assigned to bins as shown in the following table. The bins are necessary because the result of maintenance to improve IRI will not result in the same IRI for all sections.
Table 1.3.5.1: IRI distribution
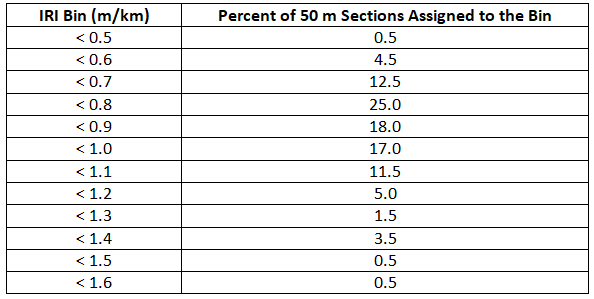
The percent of “improved” sections in each bin represents the expected improvement due to the rehabilitation action taken for pavement sections that exceeded an IRI value of 2.5 mm/m, i.e. 25 percent of sections were improved from an IRI of greater than 2.5 mm/m to less than 0.8 mm/m of roughness. The number of “improved” sections in each bin were then added back to the “deteriorated” IRI dataset based on the average deterioration of 1.6 percent per year to determine the new IRI cumulative distribution curve. The curve for 2018 is shown below.
A similar exercise was then completed for the next 5 years of the concession based on the maintenance and rehabilitation activities planned in the current 5-year plan and average annual rate of deterioration expected.
The cumulative distribution performance modeling described above permits the concessionaire to actively determine the impact of the current 5-year maintenance and rehabilitation plan on the cumulative distribution of IRI and to optimize their annual investments.
Paterson, W.D.O. International Roughness Index: Relationship to Other Measures of Roughness and Riding Quality. In Transportation Research Record 1084, National Research Councel, Washington, D.C., 1987.
Taylor, G.W., and J.D. Patton. Effects of Pavement Structure on Vehicle Fuel Consumption – Phase III Report CSTT-HVC-TR-068. National Research Council of Canada, 2006.
New Brunswick Department of Transportation (NBDOT). OMR – Asset Management Requirements Trans Canada Highway Project Attachment 61. Fredericton, New Brunswick, 1998.
UGO DIBENNARDO, ANAS S.p.A, Italy.
ANAS S.p.A., the main Italian road agency, manages more than 32.000 km of national roads, including hundreds of bridges and tunnels. With the pursuit to optimize technical and economical efforts and build a renovated planning strategy, a Pavement Management System (PMS) has been implemented “in-house”. It is part of a wider project aimed at the proposal of a Road Asset Management (RAM), which suggests a proper allocation of funds based on required maintenance needs. Specifically, the RAM is able to propose optimum technical and financial long-term strategies for planning maintenance activities of all the assets involved in a road network (e.g. pavements, bridges, tunnels).
In the last decade, many PMS have been developed worldwide. However, each system must deal with peculiarities of the involved road network and address specific issues related to local conditions. Consequently, ANAS has decided to develop its own software, a user-friendly system centered on a performance-based approach. Incorporating the control parameters imposed by Italian Ministry of Infrastructure and Transport to monitor pavement conditions, ANAS PMS proposes simple decision-making tools for planning road maintenance, efficiently leading to identification and prioritization of sites needing repairs.
The final objective of the proposed system is to create a simple supporting tool in the decision-making process to properly allocate funds and optimize technical activities. The system will assist technicians and road managers in building up an effective infrastructure network, which must guarantee safety and good service conditions for users, as well as sustainability/benefits in terms of financial resources and technical efforts for the road agency.
Based on the outputs of the proposed system, ANAS sought to identify maintenance and rehabilitation priorities due over time, proposing cost and technical-effective repairing solutions able to comply with budget and performance requirements (i.e. minimizing maintenance activities in terms of frequency and costs and maximizing pavement performance). The system implementation and the consequent planning strategy will guarantee high quality standard infrastructures together with relevant money savings due to direct and indirect benefits for road users and road managers.
Each year ANAS, through its experimental research center, monitors its road network to detect the main parameters for verifying pavement condition ((e.g. CAT, IRI, HS) asked by Italian Ministry of Infrastructure and Transport. This extensive monitoring campaign makes available a huge amount of data that can be exploited for the development of a reliable PMS without needing additional efforts in terms of equipment and/or complex features (i.e. no need of additional costs).
In this sense, the first step of the PMS construction process (still in progress) has been the development of an elaboration method that includes the above-mentioned pavement performance parameters regularly detected by ANAS for the determination of pavement rating. Specifically, a simple methodology was proposed to elaborate all the historical data recorded through in site investigation equipment and visual inspections. The analysis provides two main performance indicators, which describe functional and structural pavement conditions:
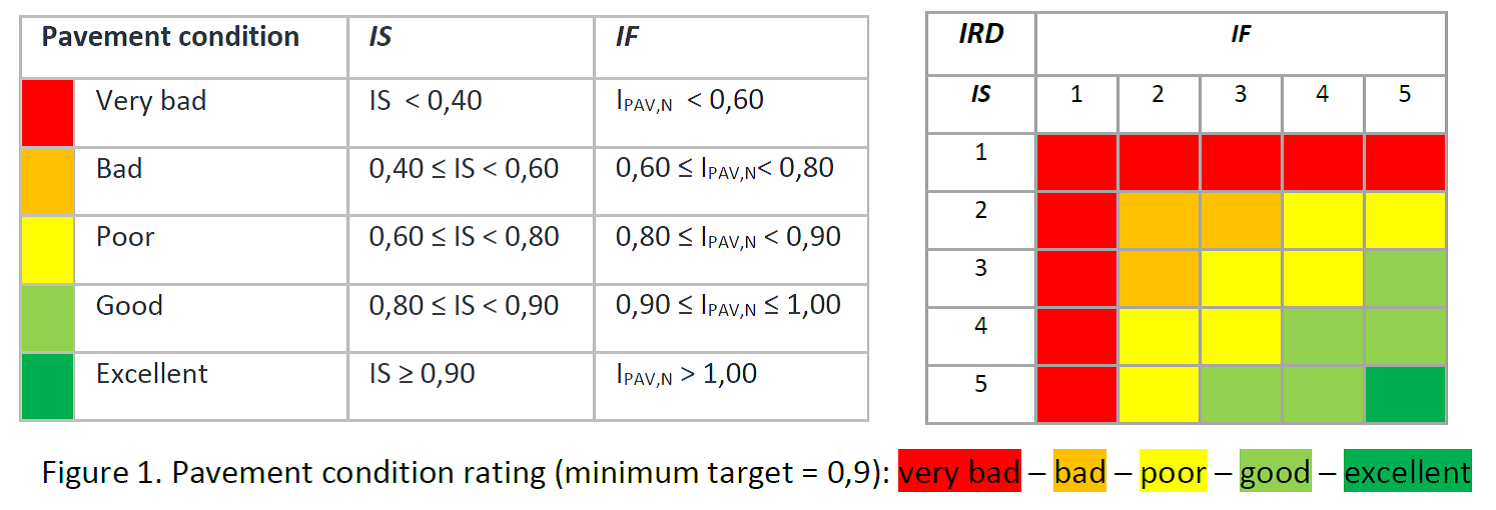
Based upon IF and IS rating combination (Figure 1.3.5.3), the current road pavement condition level is identified as summarized by the parameter IRD (Index of Distress Relevance).
Below, expressions and relationships between the above-described parameters are shown:
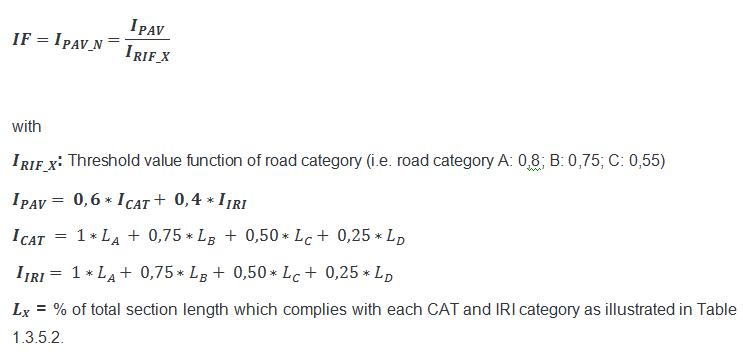
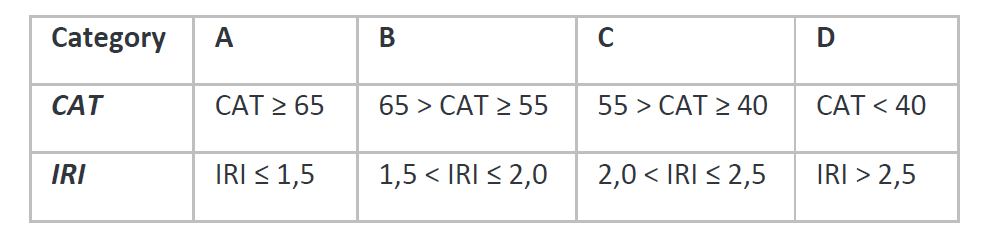
Table 1.3.5.2: CAT and IRI category
With the aim of verifying the capability of the proposed road data elaboration method to provide a feasible and reliable picture of the actual maintenance need of the road network, a case study of its applicability is presented in the next paragraph.
Two 5 km sections of double carriageway roads with same traffic and structure category (i.e. road category B – subjected to heavy traffic – Figure 1.3.5.3) were analyzed in terms of IRD. The sections were selected taking into account maintenance needs previously identified based on the empirical experience of road agency technicians. One section was selected among those identified in “poor conditions” (i.e. requiring repairs – Figure 1.3.5.4). The other one, recently rebuilt, was chosen among those in “good conditions” which do not require priority in rehabilitation (Figure 1.3.5.5). For each section, CAT and IRI data were analyzed as previously described and visual inspections reports were elaborated to determine IF, IS and IRD as summarized below. For the first section, data recorded in two different periods were considered with the aim of verifying the ability of the system to identify the distress evolution over time.
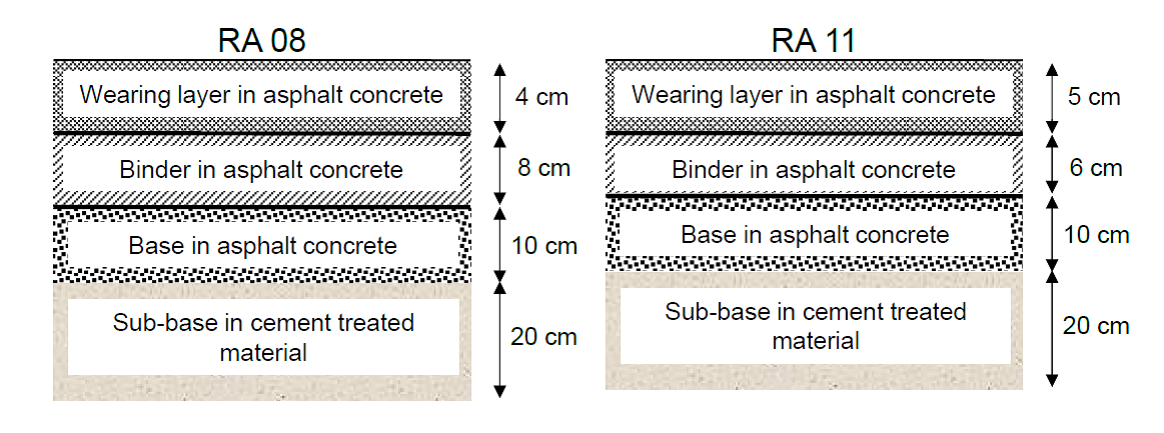
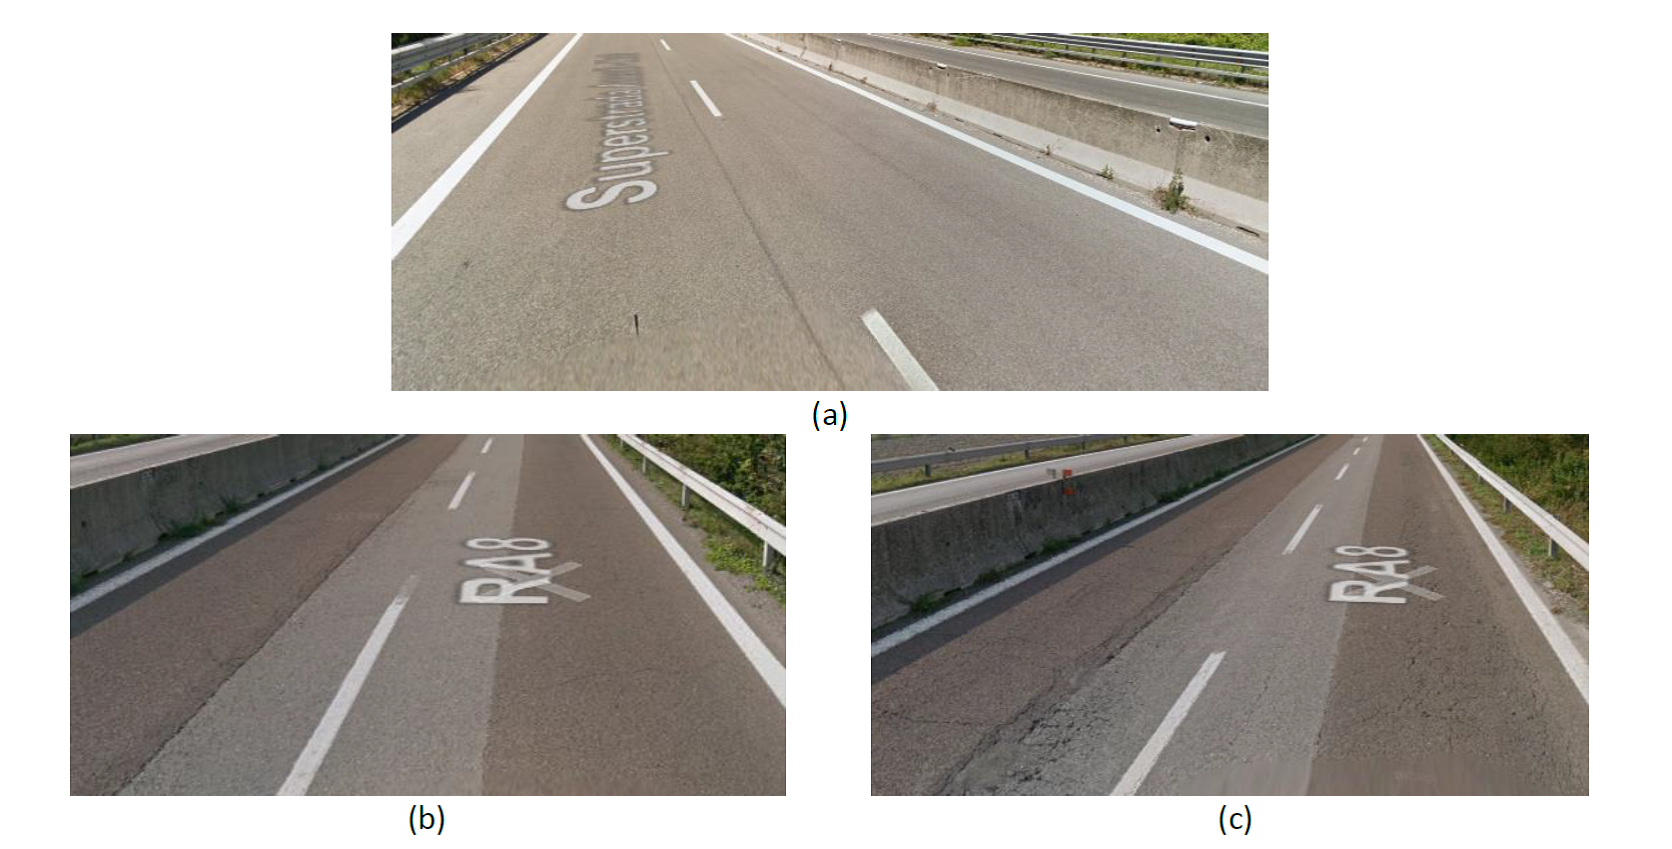
Figure 1.3.5.5: a) RA 11 (2017); b) RA 08 (2015); c) RA 11 (2017)
Table 1.3.5.3: IRI and CAT data elaboration
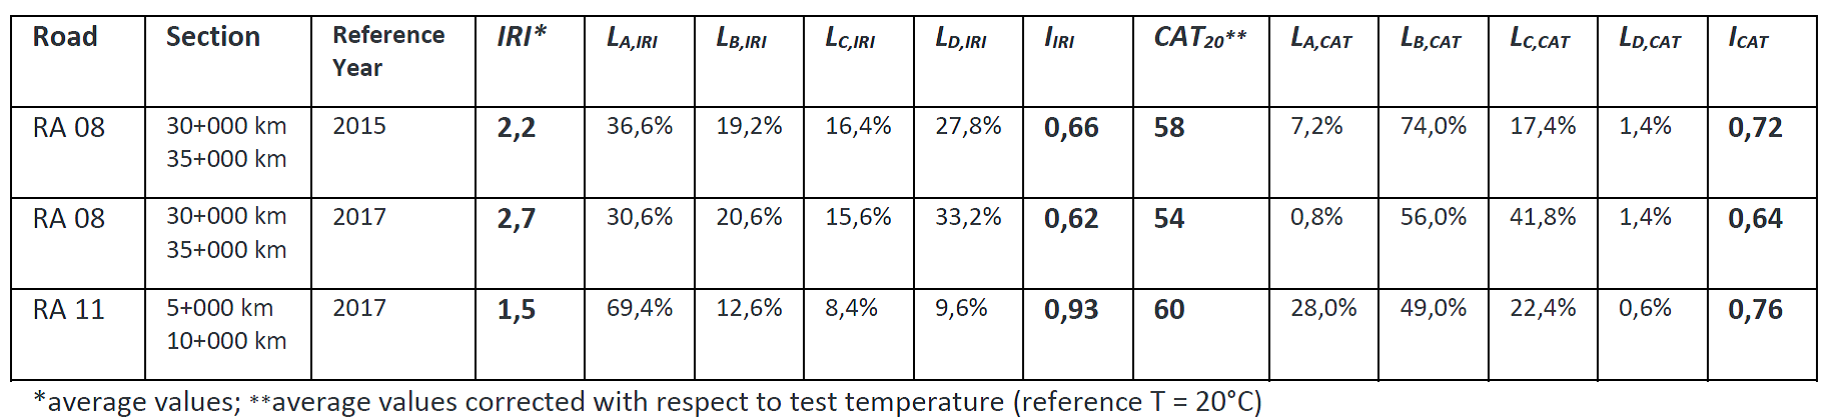
Table 1.3.5.4: Pavement condition rating
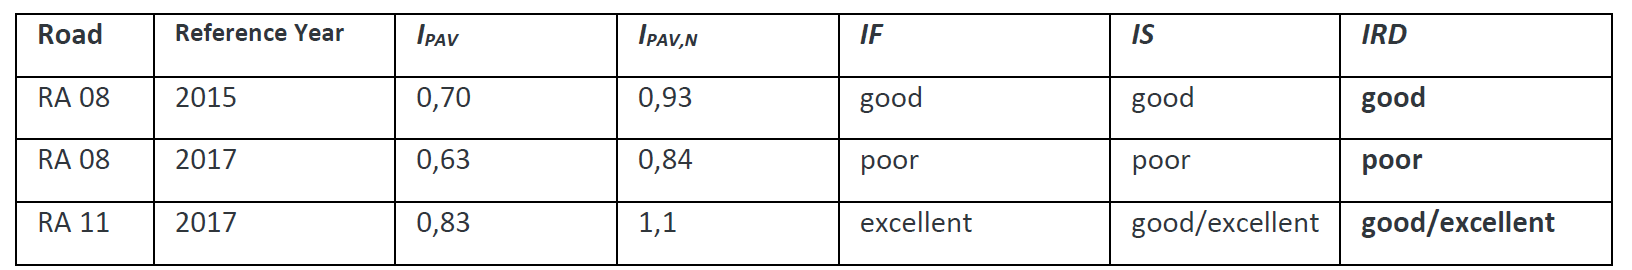
Results shown in Table 1.3.5.3 and 1.3.5.4 validate the reliability of the performance-based elaboration method proposed by ANAS to identify pavement condition. IRD properly ranks roads based on the distress level: a better IRD rate characterizes the road section recently restored (RA 11). At the same time, the road section requiring maintenance (RA 08) shows ICAT and IIRI values that worsen over time with an overall reduction in the IRD rate, as expected due to the higher deterioration recorded with the most recent road inspection. Based on these findings, in order to restore acceptable pavement conditions, ANAS planned specific maintenance activities on the RA 08 road (conducted in 2017 and 2018).
Thus, with few efforts in terms of data acquisition and mathematical calculations, the IRD parameter is able to easily provide a comprehensive picture of the current pavement condition of the whole road network and demonstrates the sensibility to adjust according to distress evolution.
The next step for ANAS PMS development is the implementation of provisional evolution models based on climate and traffic conditions as well as time aging effects. By applying evolution laws to the IRD parameter, the IDF (Index of Future Deterioration) will be identified, so capturing in advanced maintenance needs and priorities of the road network and their evolution. In this sense, for the construction of reliable evolution laws, the wide historical database recorded over time by ANAS research center constitutes an irreplaceable resource. The combination of IDF information with visual inspection data, that provide useful hints about deterioration causes, assists technicians in the identification of the most feasible and effective technical solutions. To this regard, depending on distress type and extension as well as IFD values, a catalogue of standardized maintenance activities will support technical decisions. Finally, based on technical needs and budget availability, ANAS can plan a careful long-term action strategy, which allows significant cost savings and technical efficiency.
ANAS PMS demonstrates optimum capability in identifying gaps and priority maintenance needs, allowing for better allocation of resources as well as technical efficiency. With very limited efforts in terms of data finding and calculation, the proposed system can easily provide a reliable picture of the current pavement condition of the road network, demonstrating the sensibility to adjust according to distress evolution.
ASPHALTICA World Seminar. 2018. “Pavement Management System - Il progetto di ANAS”, presented by Ugo Dibennardo and Tullio Caraffa. Rome, Italy. 26 October 2018.
The asset management strategy, introduced in chapter 1.3, links organizational goals and objectives with actions needed to manage its highway infrastructure assets. Performance measures and levels of service (target values negotiated with stakeholders) should be established to make the strategy operational.
Therefore, the organization shall establish, implement and maintain process(es) and/or procedure(s) to monitor and measure the performance and/or condition of assets.
This chapter sets out the process(es) and/or procedure(s) for:
The process(es) and/or procedure(s) for monitoring the overall effectiveness and efficiency of the asset management system are dealt with in section 2.2.
Performance management refers to a systematic process for evaluating the ability of road assets to provide the required level of service. This process should be applied to a road network rather than to individual assets.
Goals and objectives, essential for managing the highway infrastructure asset, are defined in terms of levels of service. In order to evaluate these levels of service target values of performance indicators, also called performance measures, have to be used.
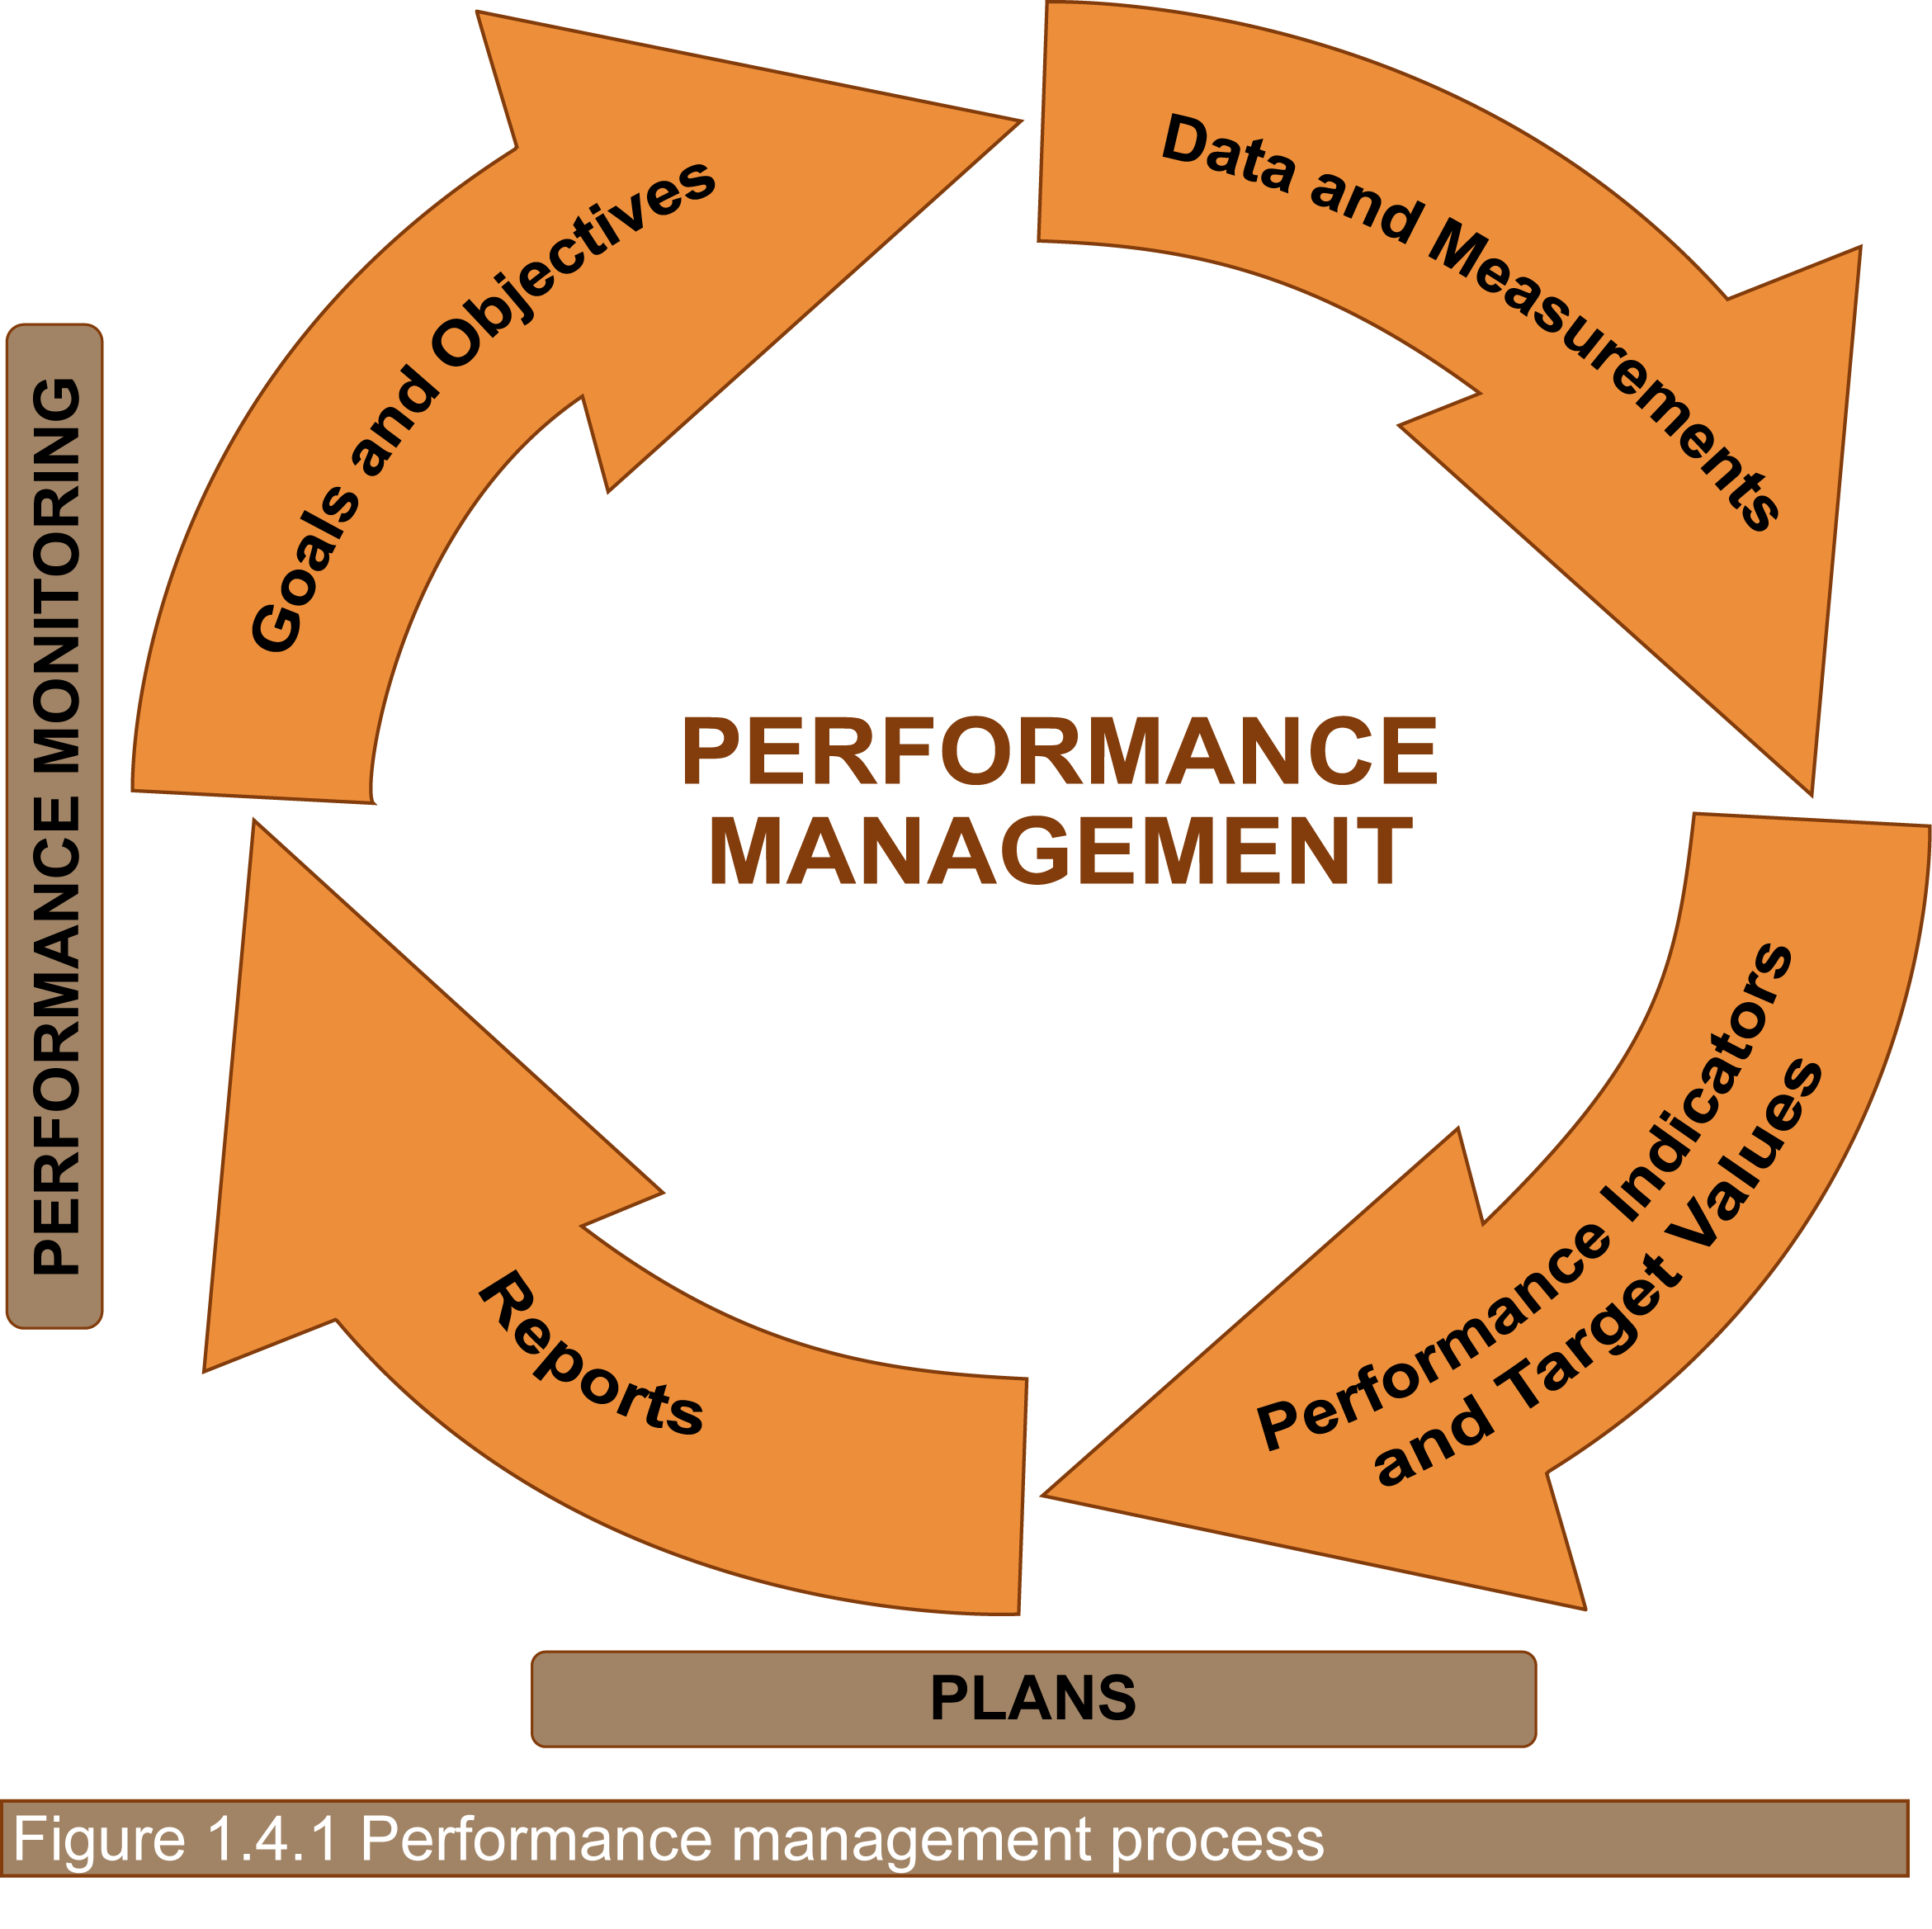
Therefore, road organizations establish, implement and maintain process(es) and/or procedure(s) to measure the performance of the assets they are responsible for, and to monitor progress toward a result or goal (see figure 1.4.1, PIARC 2012, PAS55 and ISO 55000).
Performance management is functional to the achievement of the following objectives:
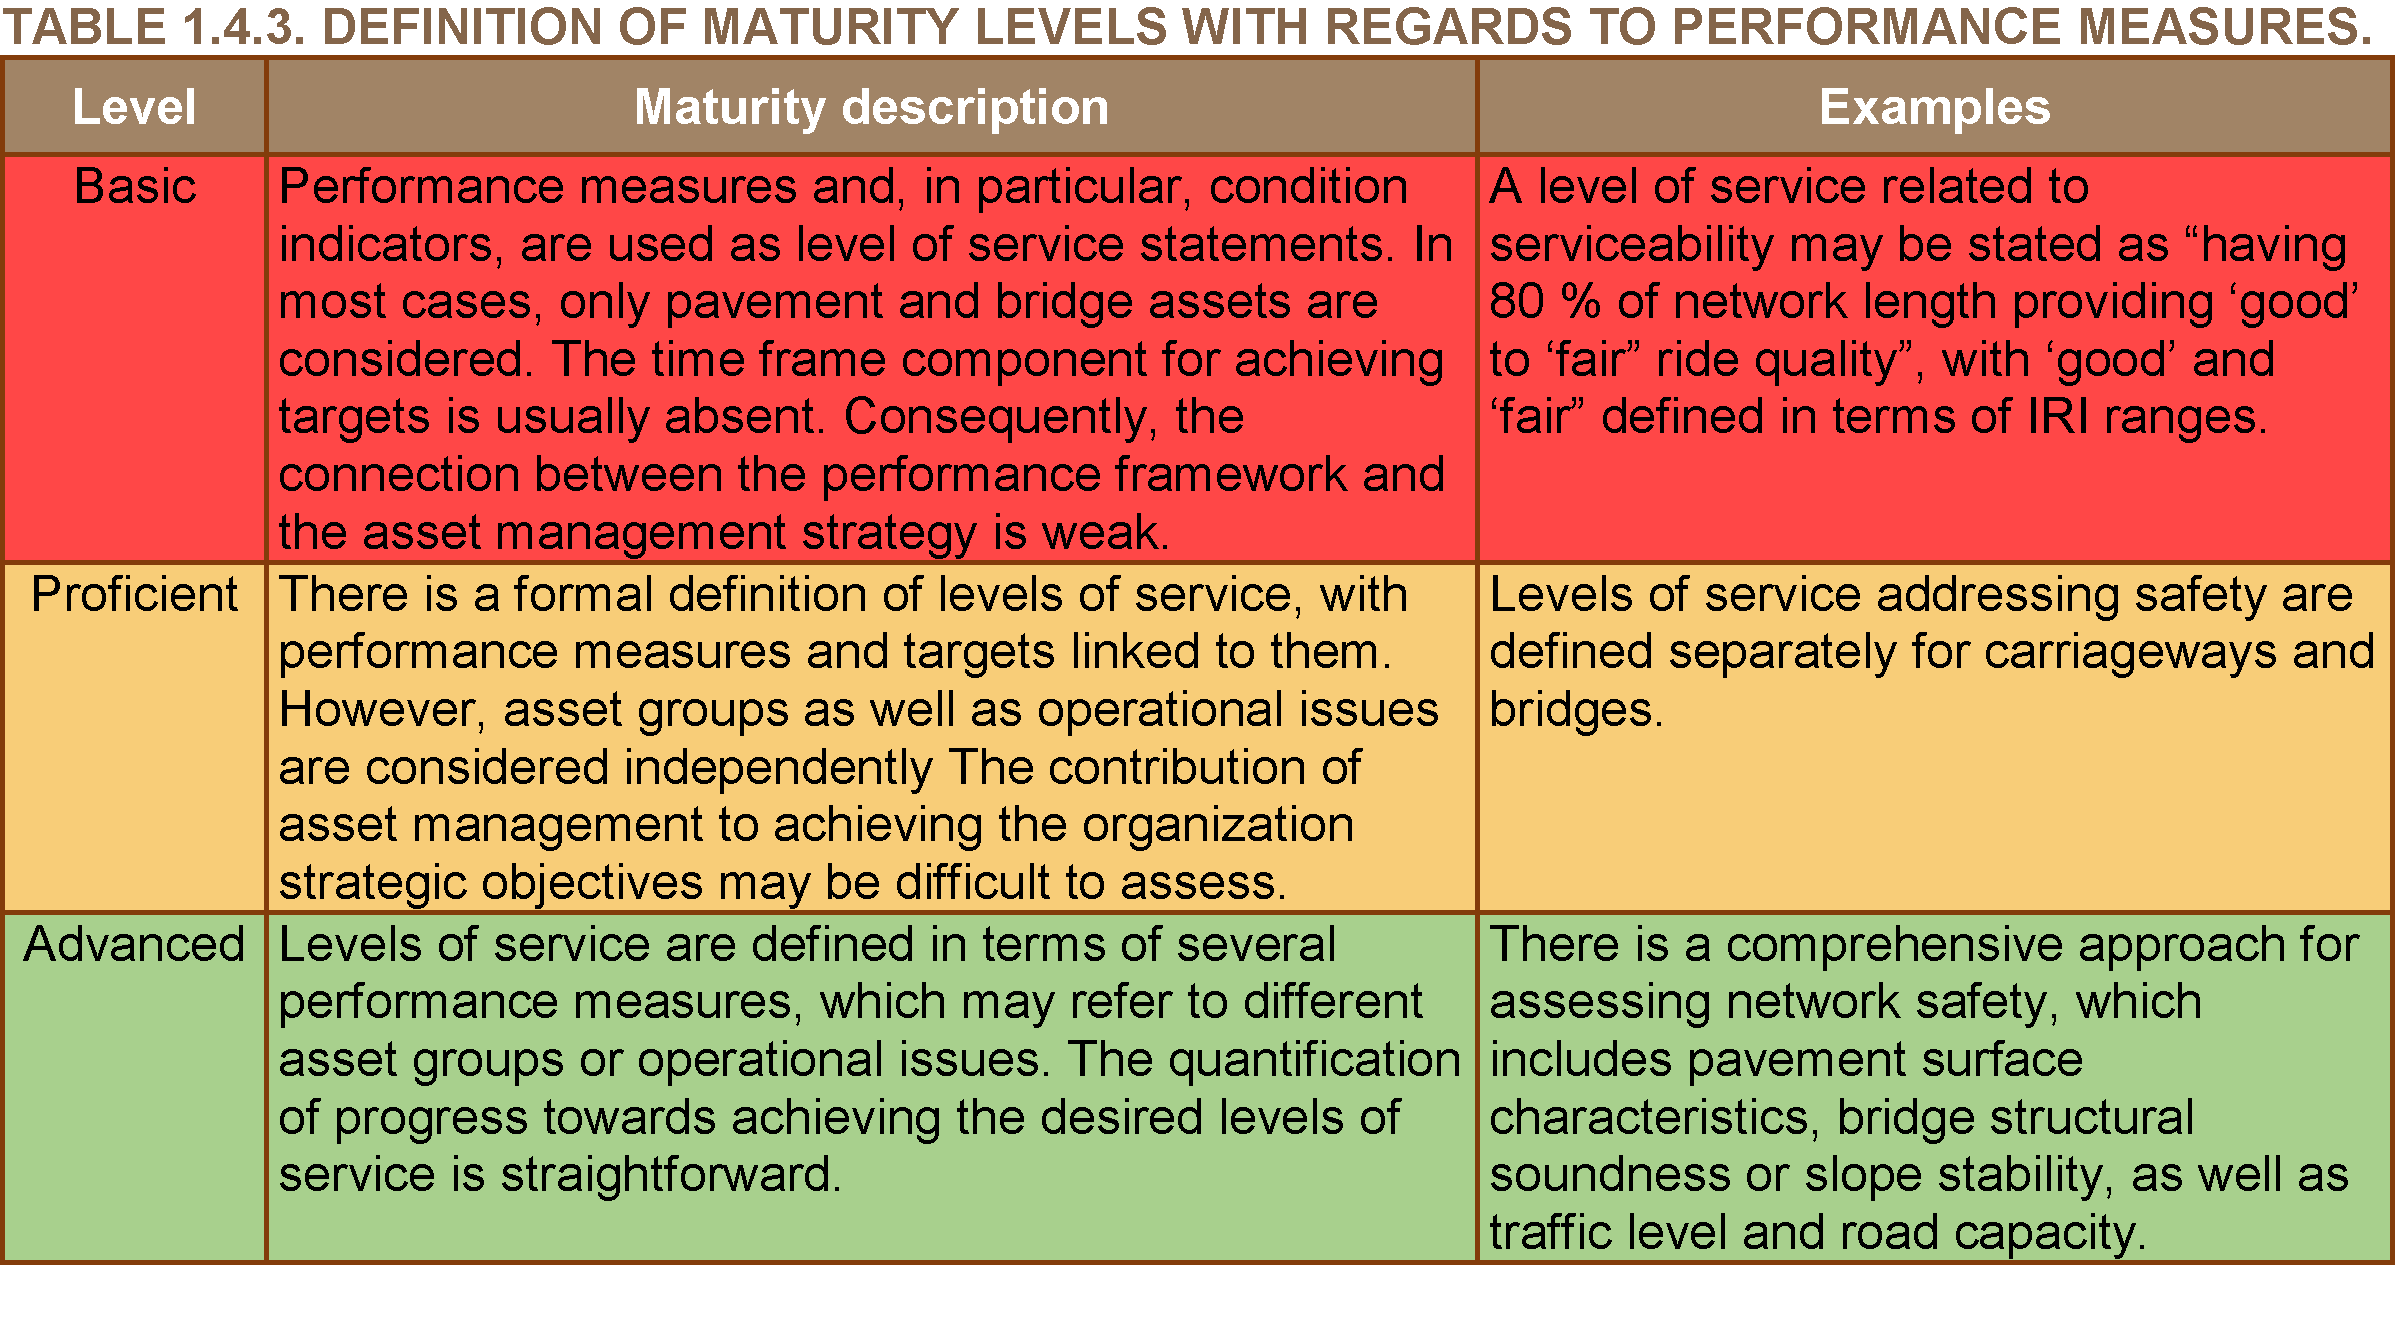
The maturity levels for authorities/agencies with regards to performance management can be defined as shown in table 1.4.3.
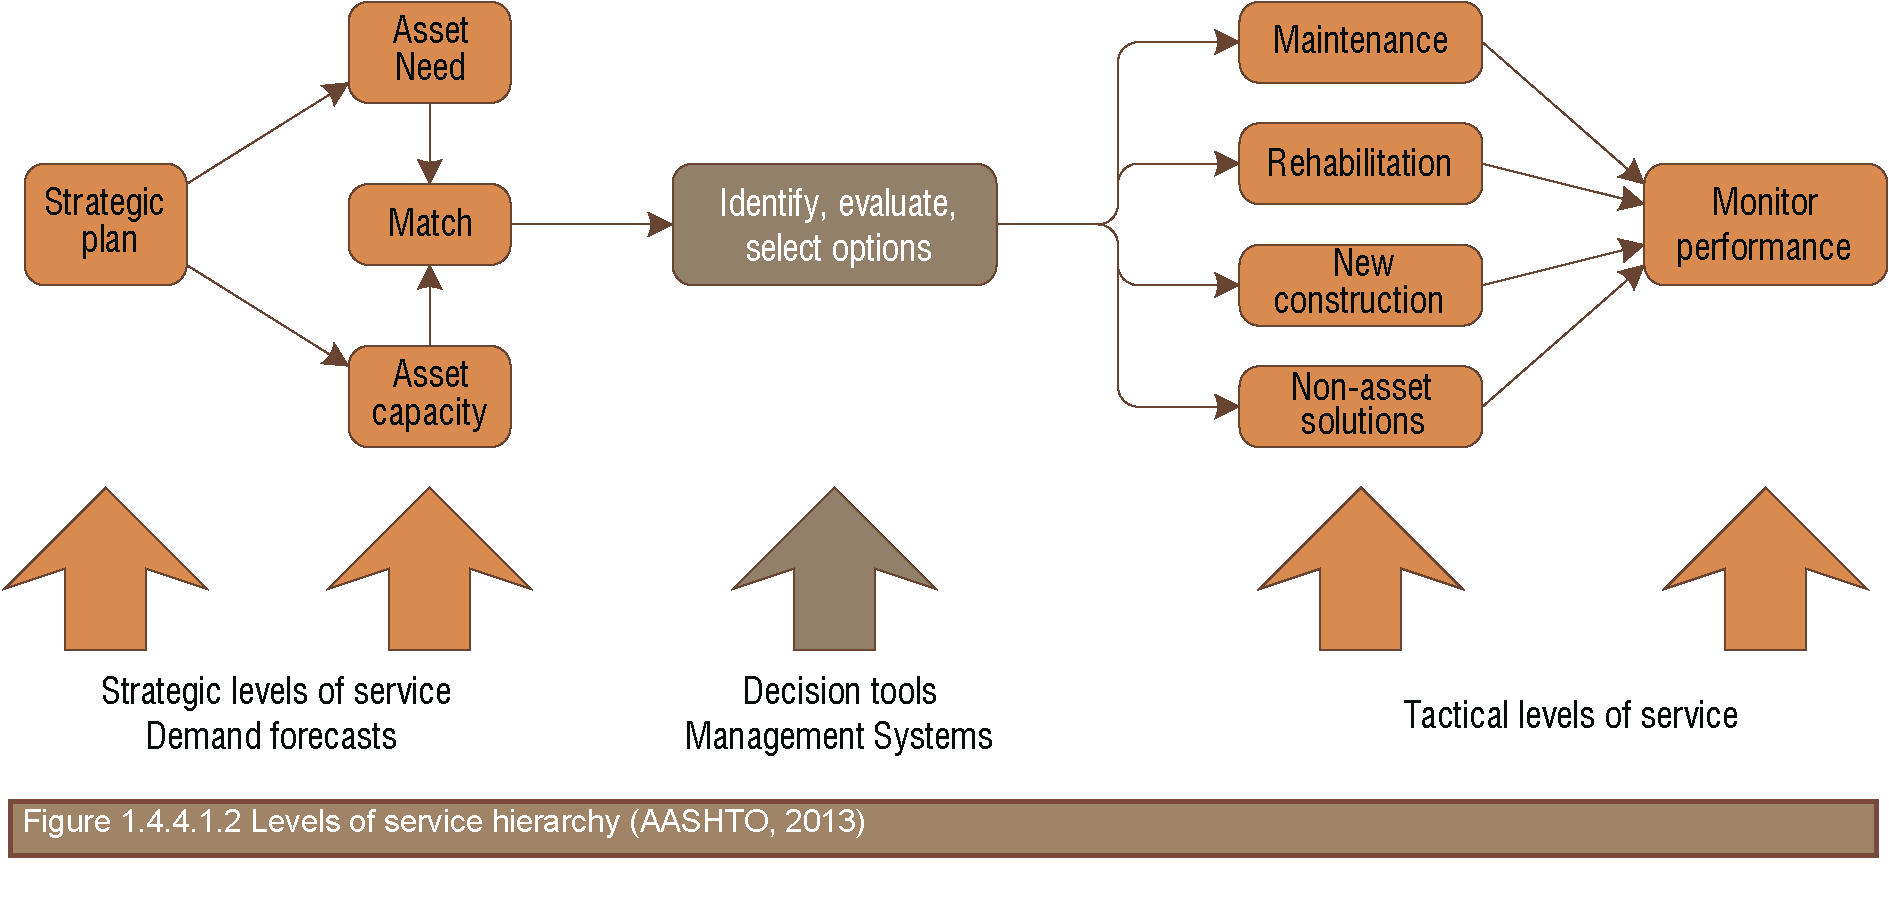
Setting a framework for performance management involves expressing the long term corporate goals and objectives of the road organization in terms of the desired levels of service, and linking these with performance measures and targets that allow the organization to monitor progress in achieving the intended results (PIARC 2004). Therefore, the main components of a performance management framework are: levels of service, performance measures and performance targets (see figure 1.4.4).
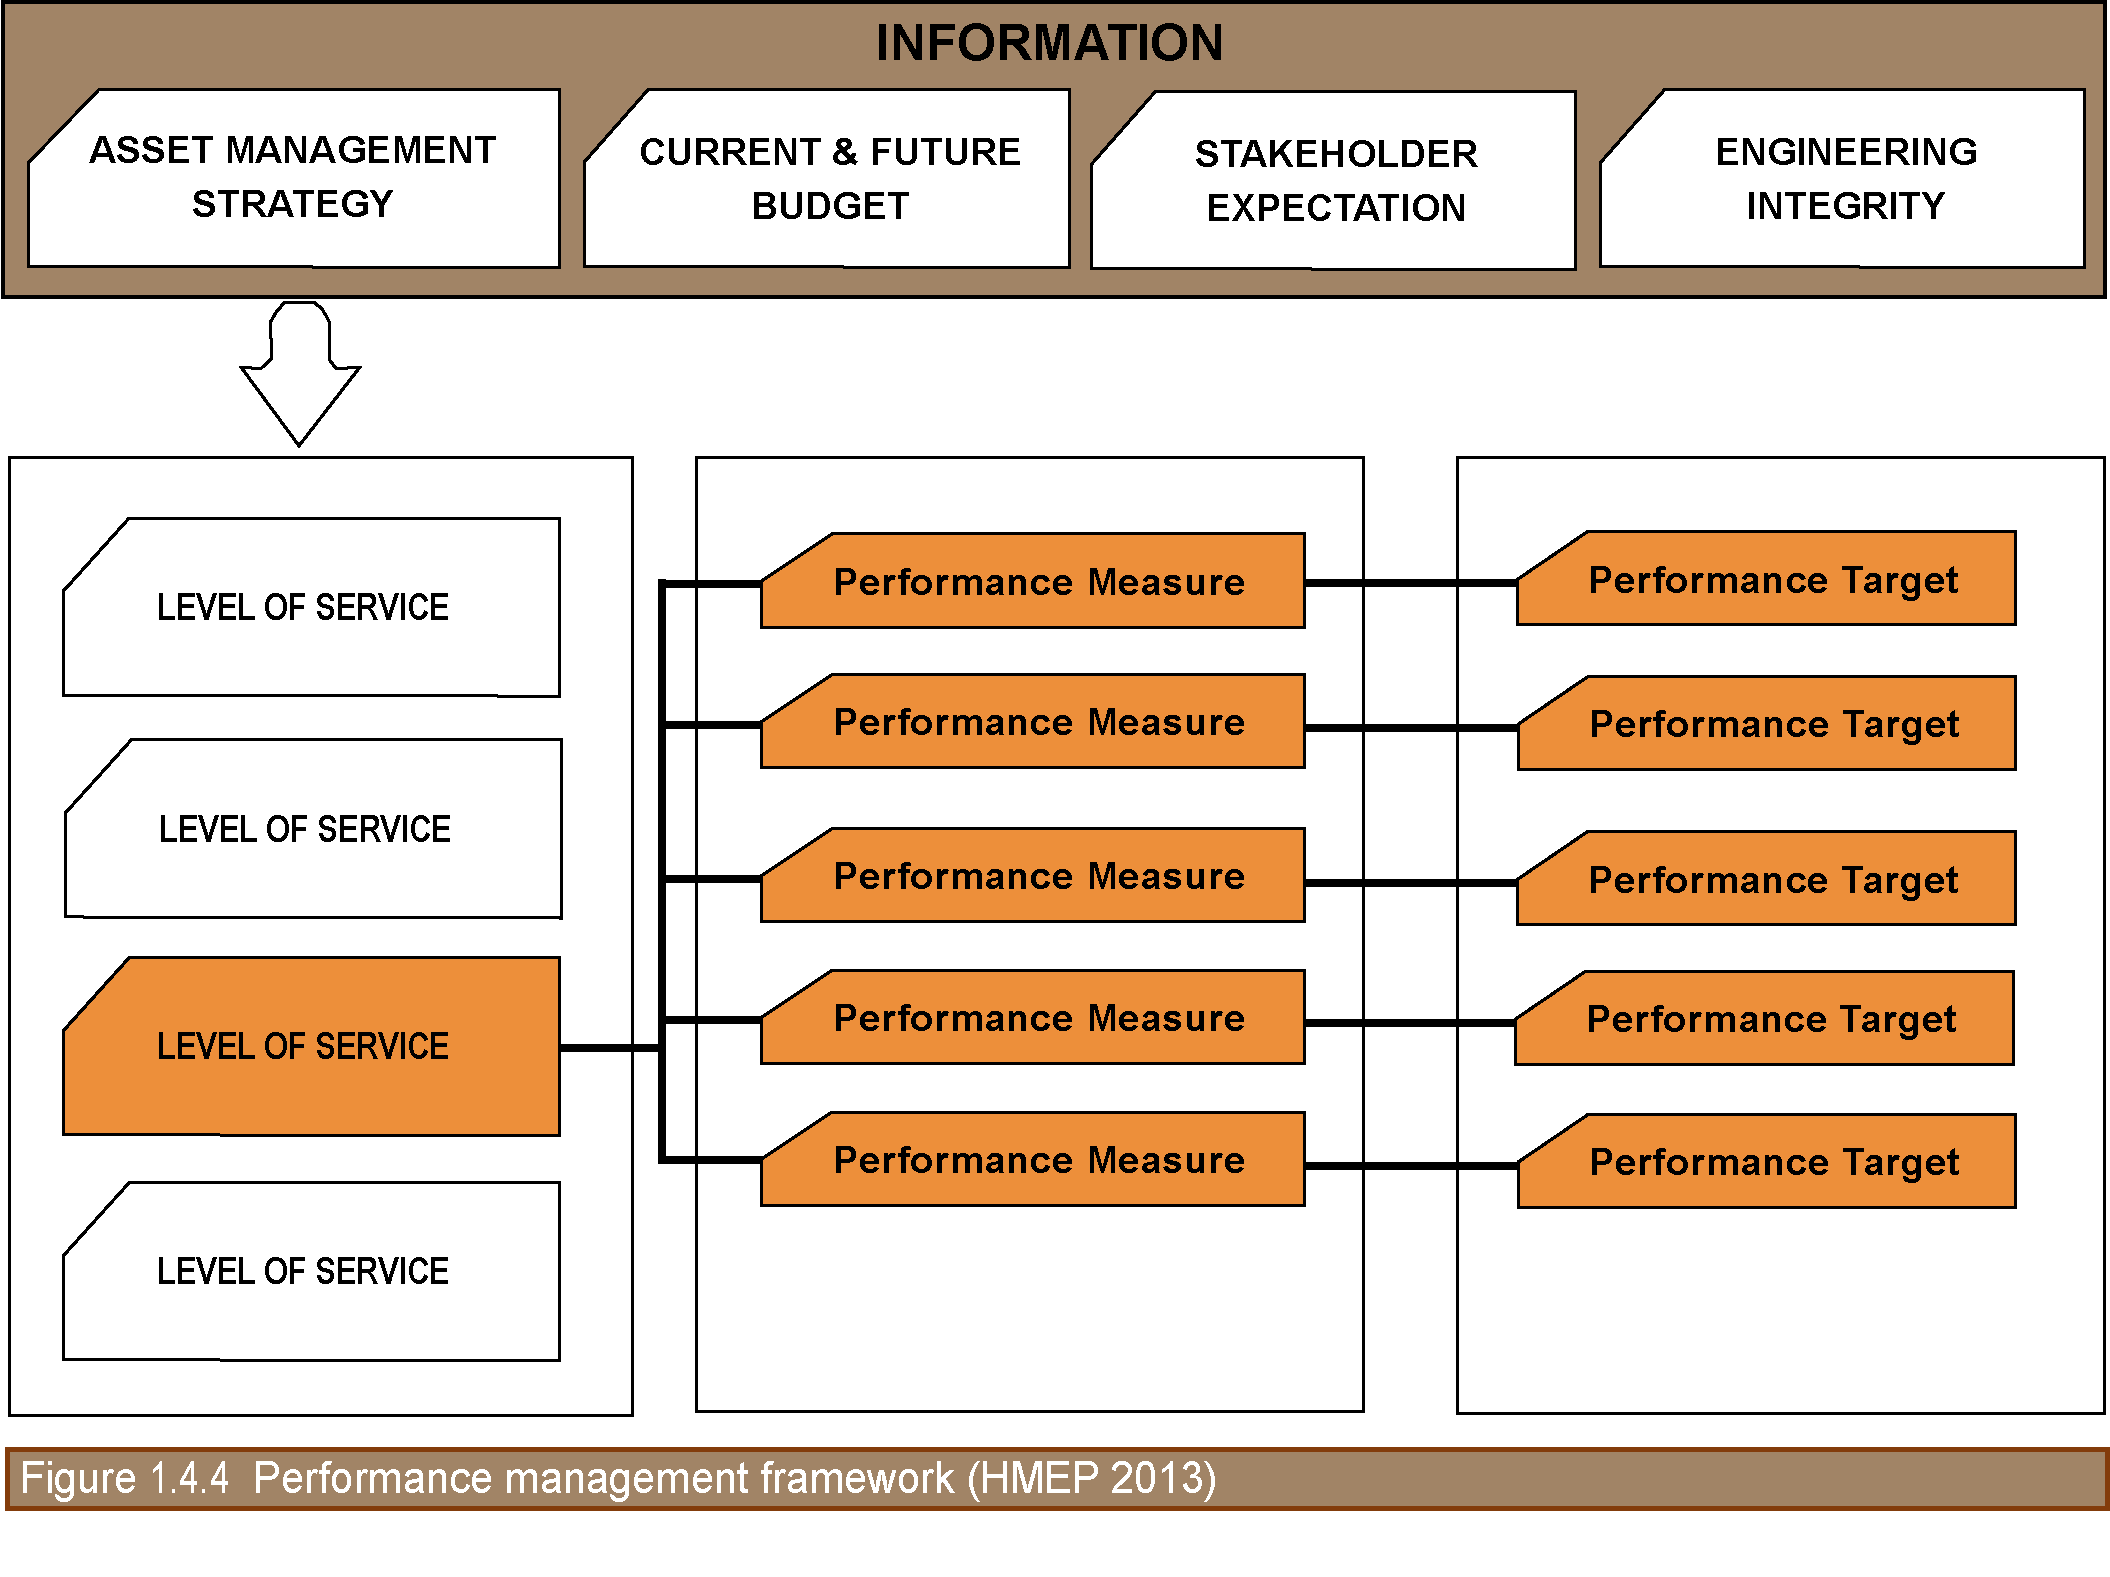
As shown in Figure 1.4.4, a number of measures can be chosen to describe the overall performance associated with each level of service.
In developing a performance framework, it is important to understand who is affected by highway asset performances; within this broad group of people, three broad categories may be identified:
The data collection and processing activities, dealt with in section 2.1, must be guided by a coherent strategic vision that specifies what goals and objectives are to be served and what measures will quantify the objectives, as defined by the performance management framework.
The methodology used to collect data, calculate performance measures and establish targets, and define the associated levels of service should be fully documented for future reference. Furthermore, authorities/agencies may develop an approach for communicating levels of service and measures to external and internal stakeholders.
The asset management strategy sets out what the authority intends to do in order to manage its highway infrastructure assets; in developing the strategy, authorities/agencies should establish the mission and goals (asset management objectives). Management objectives usually identify the quality of service to be offered to stakeholders, which reflect the authority’s aspiration/availability and the expectations of stakeholder. Any asset service affecting any stakeholders in their roles as users, taxpayers, partners, elected officials, community residents, etc., may be included.
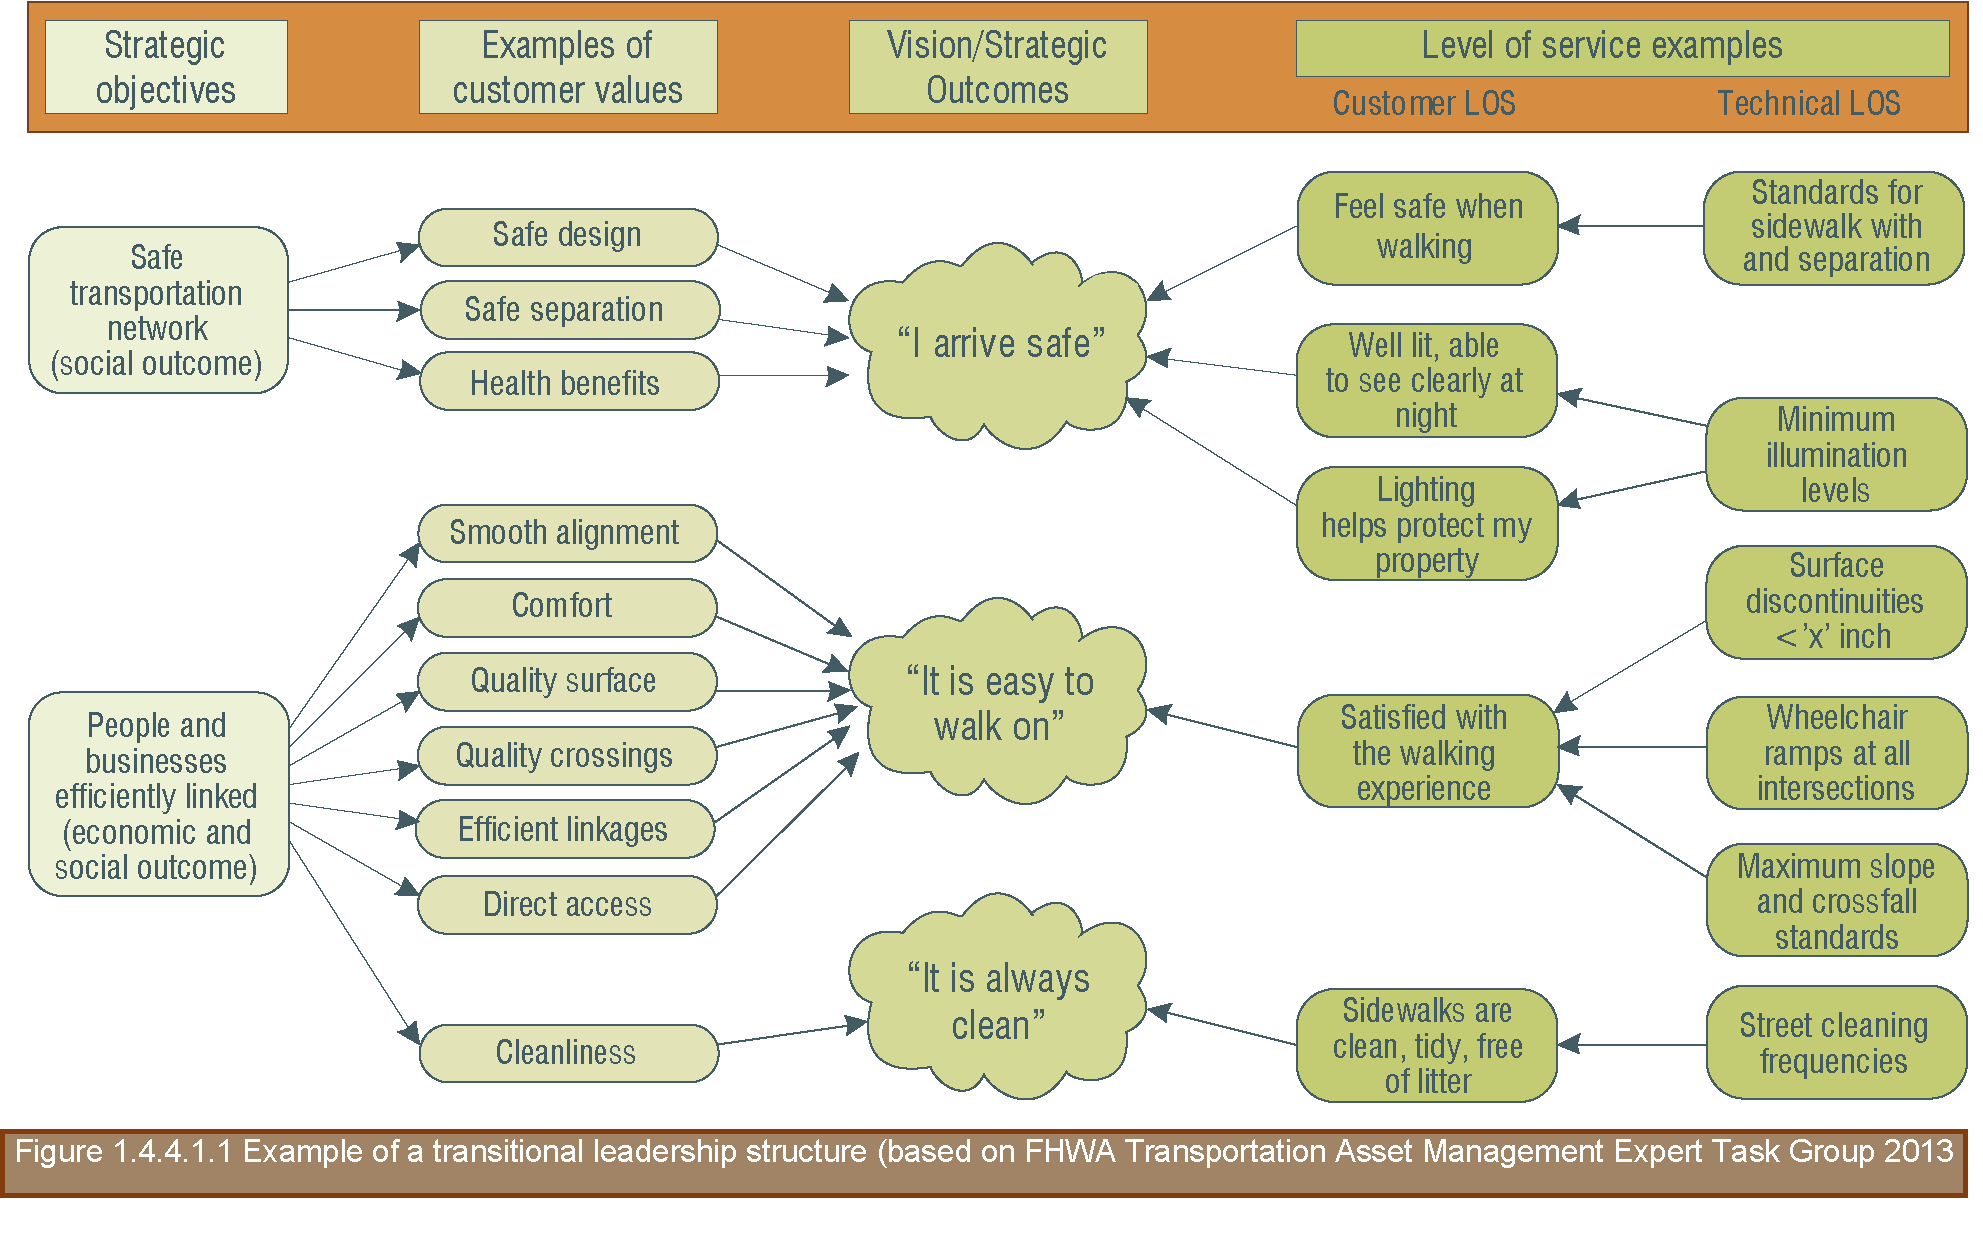
The quality of services likely to be placed in the future on the highway network should be incorporated in defining the levels of service. Therefore, levels of service are broad statements that describe the performance required for highway infrastructure assets, which are the balance between stakeholder expectations, corporate vision and available funding (see figure 1.4.4.1.1).
At the proficient maturity level of asset management, levels of service can be split into two distinct categories: customers/stakeholders and technical.
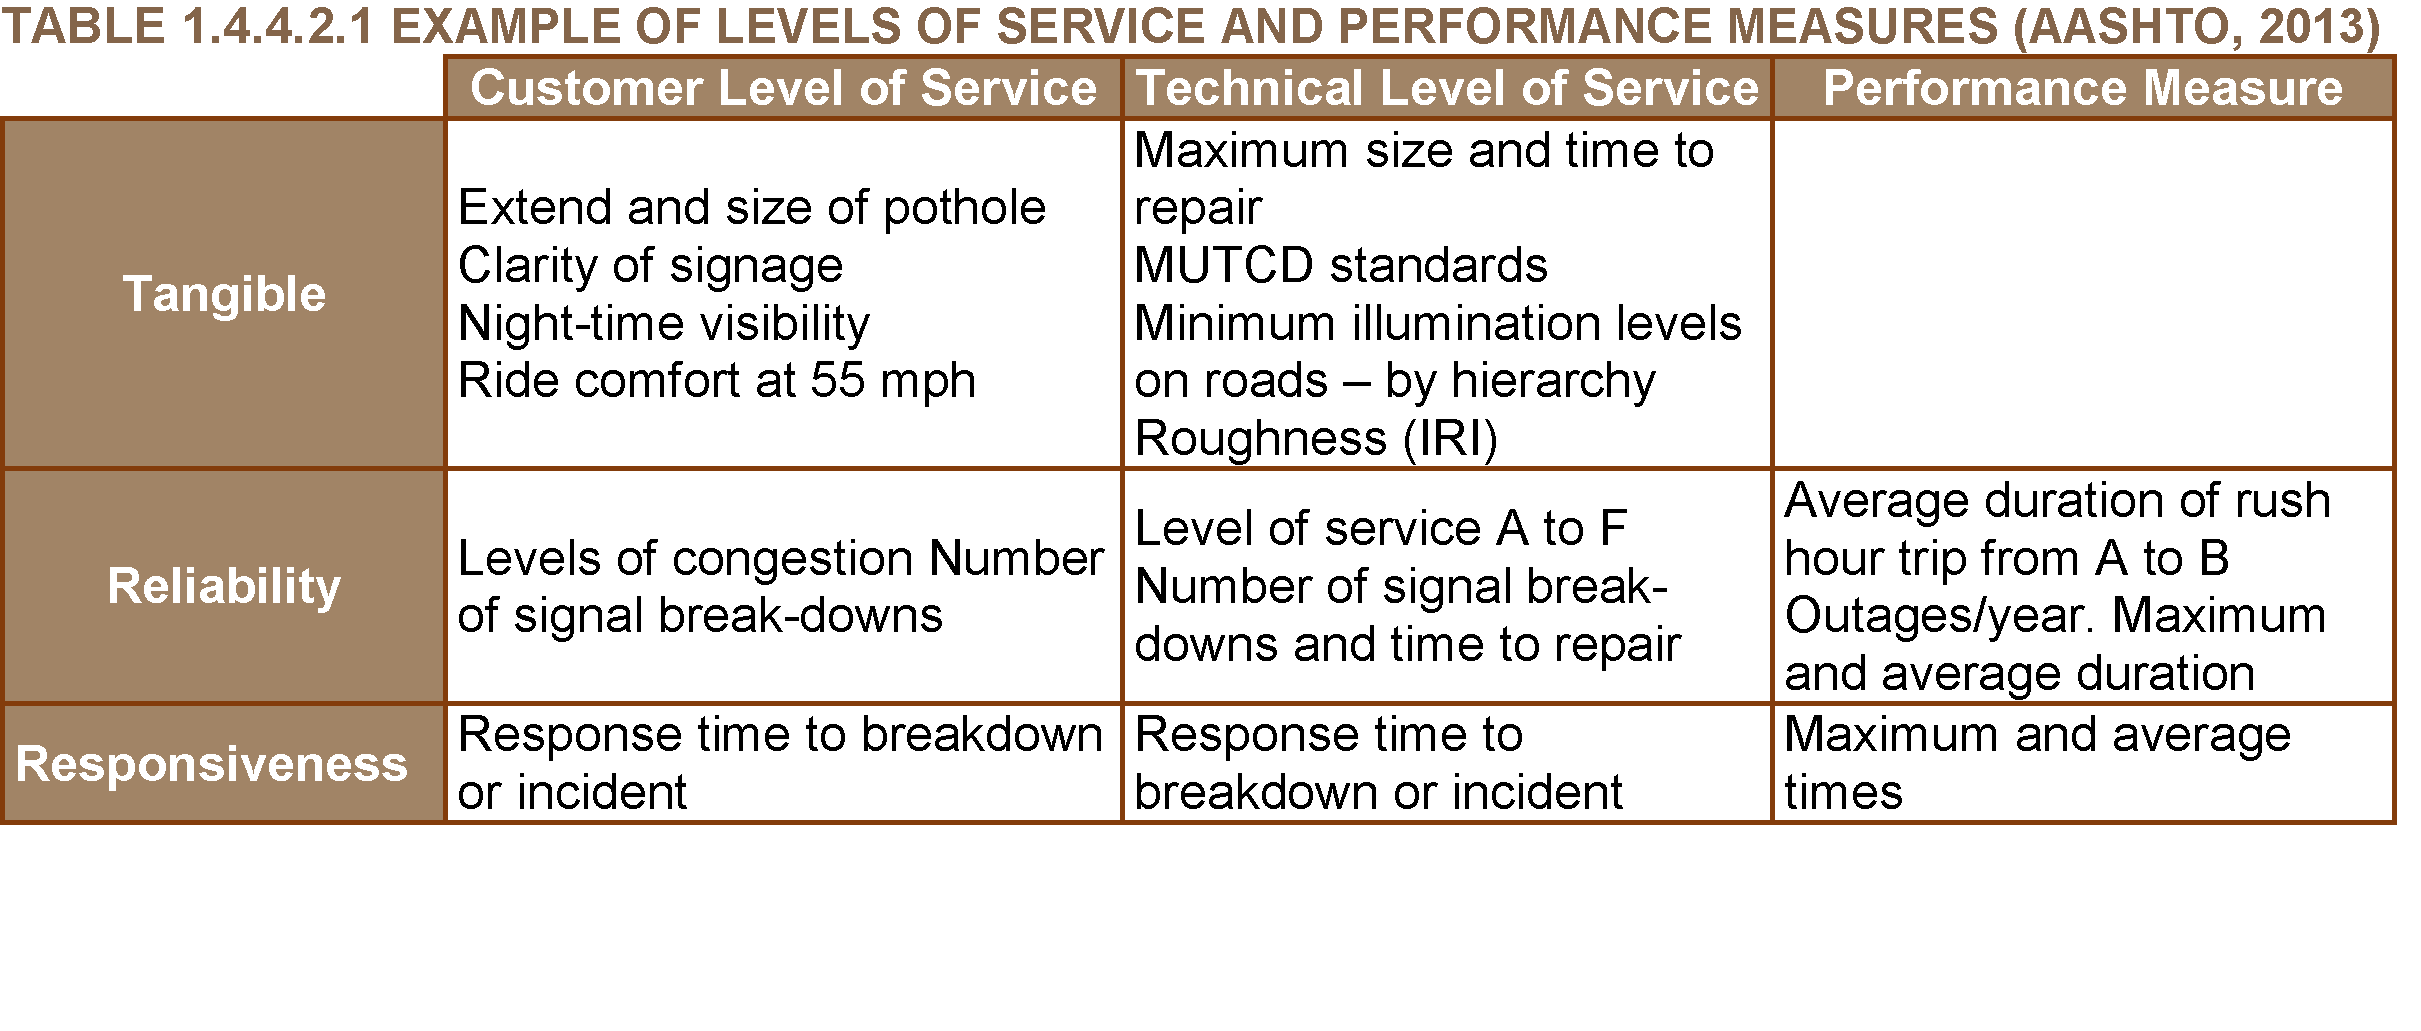
Customer levels of service relate to how the customers and stakeholders receive the service in terms of tangible and intangible measures or criteria. They are expressed in terms that customers and stakeholders can understand and comprehend. Tangibles include the appearance of facilities, frequency of service disruptions, availability of service, frequency of crashes, etc. Examples of intangibles include speed of service, staff attitude and ease of dealing with the agency.
Definition of customer level of service
Levels of service are broad statements that describe the performance of highway infrastructure assets in terms that stakeholders can understand. They should relate to outcomes and cover key aspects of asset performance such as safety, serviceability and sustainability. They should consider the performance of the whole network rather than that of individual assets
Technical levels of service support both the customer’s and the agency’s strategic objectives; they are usually expressed in technical terms used by agency personnel or contractors. At the early stages of asset management (basic maturity level), some agencies use their performance measures as level of service statements.
Definition of technical level of service
Levels of service are statements or values of a key performance indicators that describe the performance of highway infrastructure assets in technical terms and are suitable for inclusion in maintenance delivery contracts or internal service agreements. They should relate to outcomes and cover key aspects of asset performance such as safety, serviceability and sustainability. They should consider the performance of the whole network rather than that of individual assets
Each road organization needs to determine the number and nature of its own levels of service, but in any case, levels of service should be developed based on themes that demonstrate the relationship between higher level corporate objectives and any stakeholder requirements for delivery of the service, the most common aspects/themes being (see e.g. law P.L. 112-141 in USA (AASHTO, 2013)): safety, serviceability (congestion reduction, system reliability, etc.), sustainability (environmental, aesthetics), accessibility (e.g. reduced project delivery delays) , financial performance, etc.
Levels of service can be developed through workshops, focus groups, public opinion surveys, collaborative working and market survey research
It should be noted that levels of service need to be developed in a hierarchy that reflects the increasing level of detail of planning activities (see figure 1.4.4.1.2).
Strategic - To provide a snapshot of overall performance, generally for stakeholder consumption;
Tactical - To inform decision making, particularly in terms of investment;
Operational - To provide information on operational aspects of the service, such as the speed of repairs or performance of service providers undertaking maintenance activities.
Each level of service should be supported by a set of performance measures (see figure 2), which will enable to measure both individual aspects of performance as well as the overall level of service.
Two type of measures are of interest:
It is relevant to distinguish between the condition and performance of an asset:
Usually, for each level of service, a number of performance measures are chosen, and the process to evaluate them generally involves the aggregation of raw data (objective and subjective, quantitative and qualitative), as shown in table 1.4.4.2.1.
Definition of Performance MeasureVarious performance measures are usually required to represent a single level of service, but they might be aggregated in a key performance indicator (KPI) to describe the level of service. It may be appropriate to use different weighting factors for each of the performance measures that contribute to a level of service or KPI (e.g. condition of footways may have a greater weighting than condition of white lines).
Performance measures are used to monitor whether authorities/agencies are meeting the levels of service and to report the actual performance. They are usually numbers or scores that have meaning to relevant staff, and are calculated transforming raw data. They may be technical and non-technical
Typically, performance measures may include both engineering and non-engineering considerations (for example based on results from public opinion surveys). There are four type of performance measures:
The steps for identifying performance measures generally include:
The logical starting point for the development of performance measures is to identify what aspect of performance is being measured.
Indicators suitable to be used as performance measures should be:
One of the basic considerations in developing performance measures is to maximize the use of existing data and minimize the need for collection of additional data.
The SMART approach may be used in selecting actual performance measures. This approach evaluates the following attributes for candidate measures:
Once performance measures are selected, it is advisable that:
Typical sources of data and other information used to define performance measures may include: public opinion surveys (letters, e-mails, calls and blogs), business reporting, operational reporting, existing inventory data, performance data (including condition) and financial reporting.
In relation to KPIs, Working Group 2 (Management Indicators) of a past PIARC Technical Committee on Asset Management (cycle 2008-2011), put some effort into identifying the existing management indicators as well as the lack of indicators when necessary (PIARC 2012). Table 1.4.4.2.2 shows some examples of the work carried out by this committee.
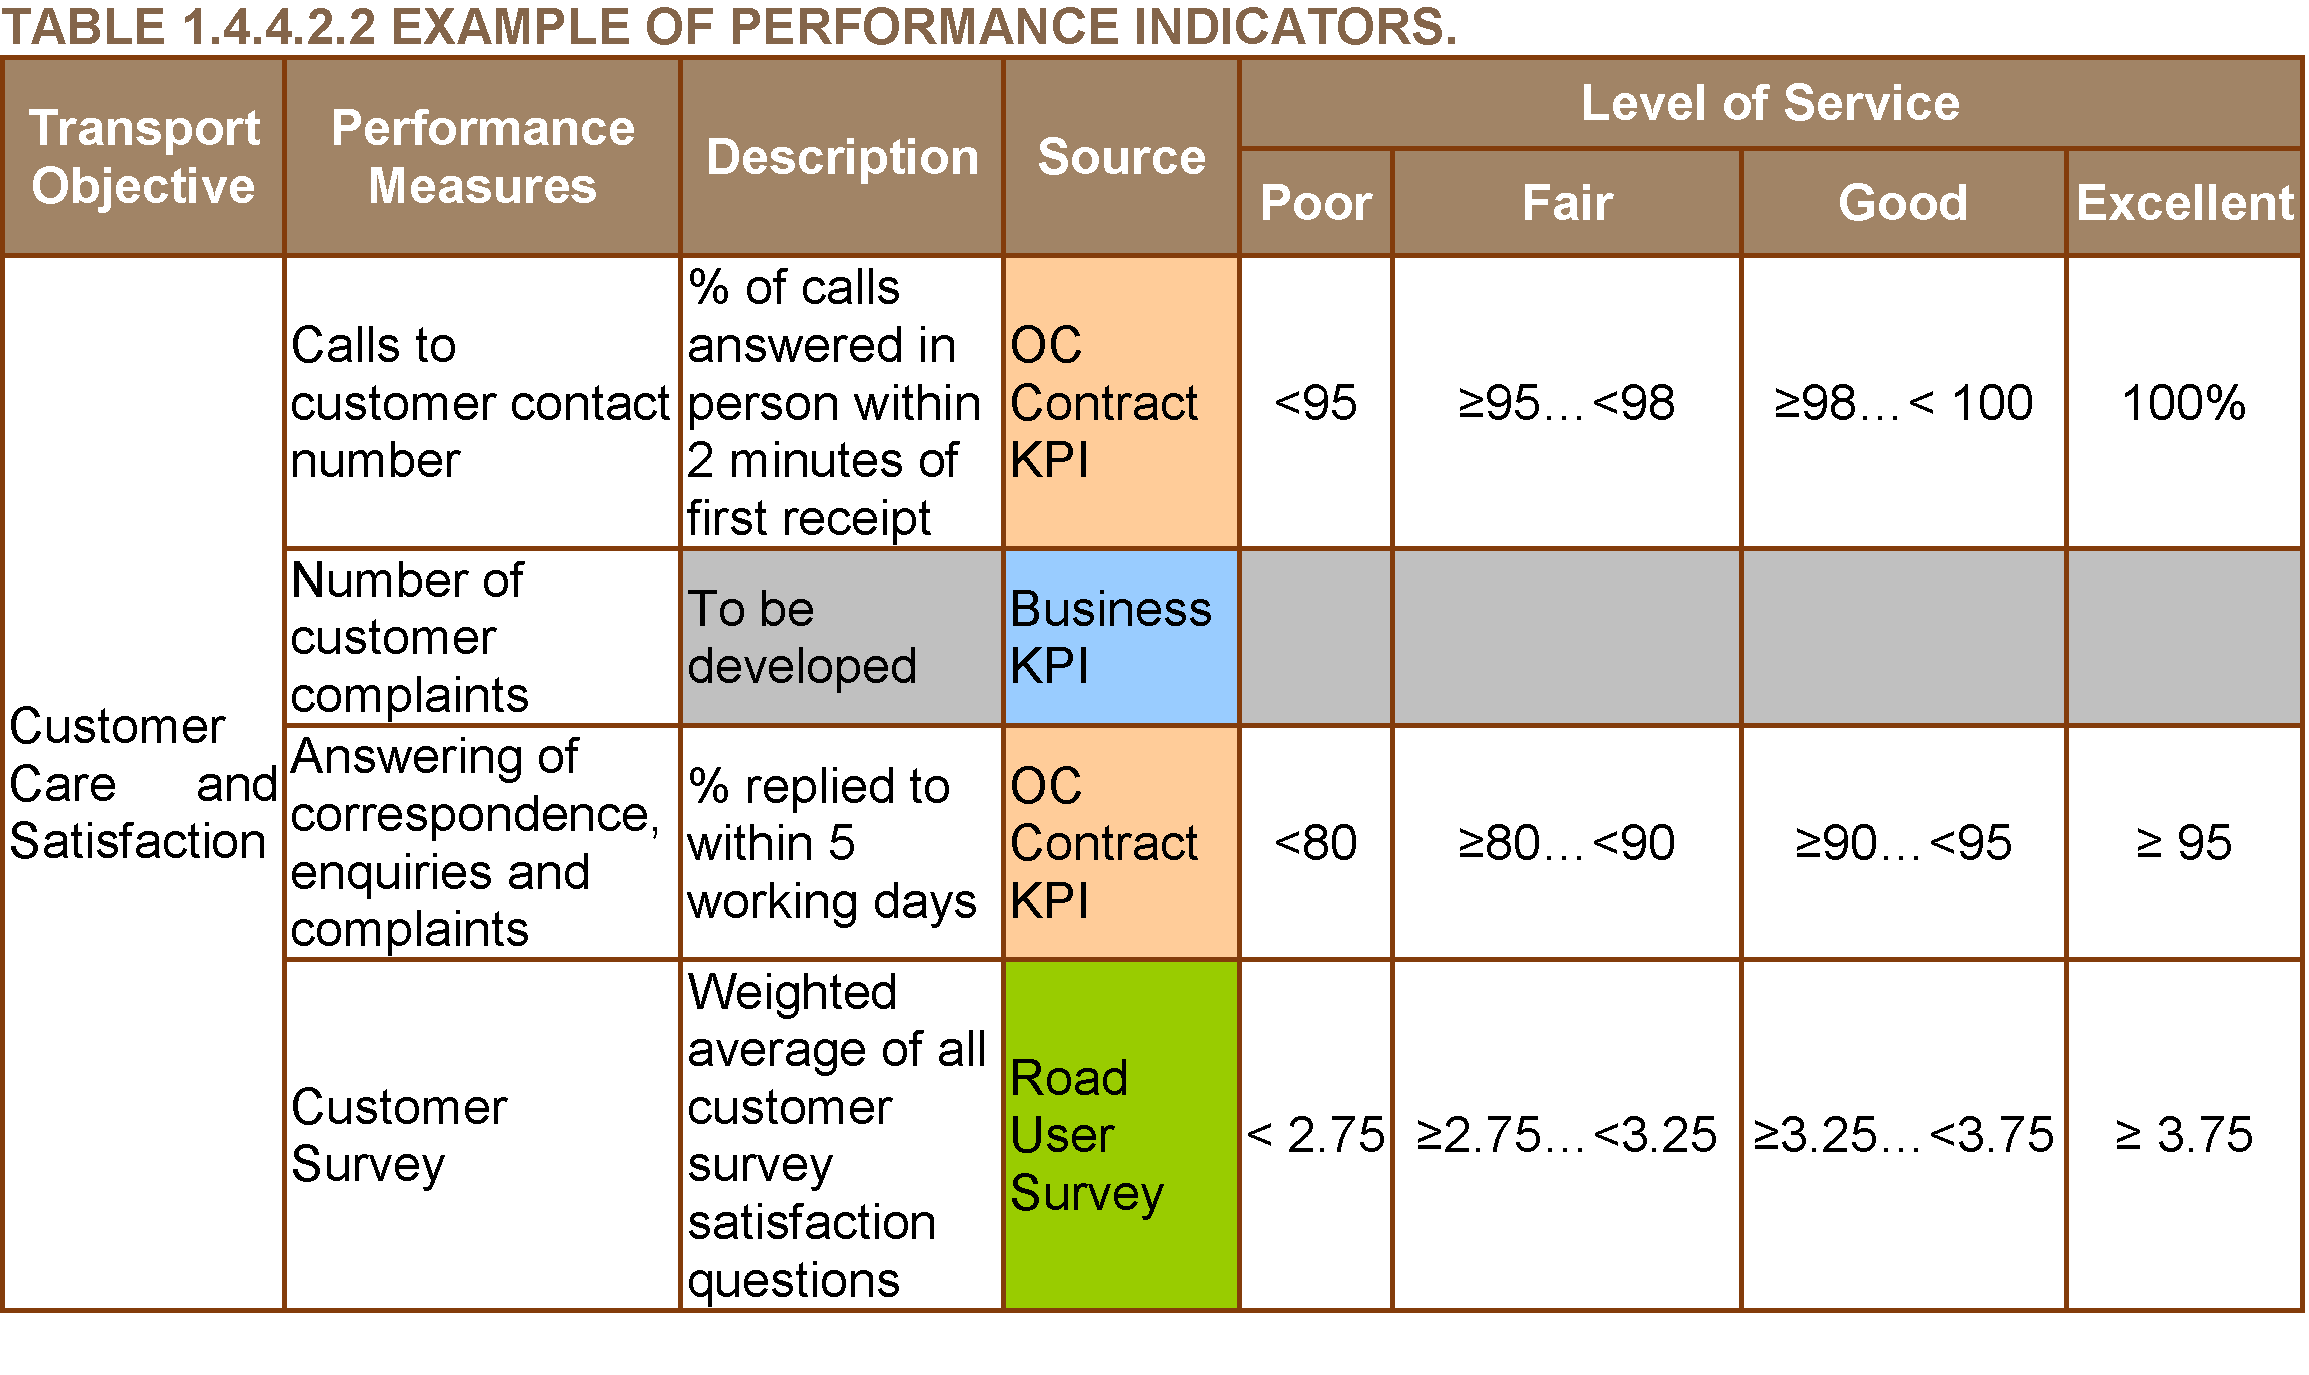
Progress in achieving asset management goals and objectives, as described by levels of service, is quantified by target values of the selected performance measures. Therefore, each performance measure should have a performance target associated with it over a period of time, typically up to five years.
The targets should be easily recognizable and understood by senior decision makers and/or the asset manager depending on whether they are strategic, tactical or operational.
The process of defining performance targets needs to be iterative, determining the best combination of targets against what is affordable. In this process, consideration should be given to:
Definition of targets
Performance targets define quantitatively the performance that needs to be achieved in order to reach the required levels of service. They should be set by staff responsible for asset management, agreed with senior decision makers and be achievable and affordable.
The process of setting performance targets may include steps such as the following (NCHRP, 2006):
Examples of performance targets as defined by various US state DOTs are presented in Table 1.4.4.3.1 Table 1.4.4.3.2 shows examples of targets used in Romania. Both sets of examples refer to pavement preservation.
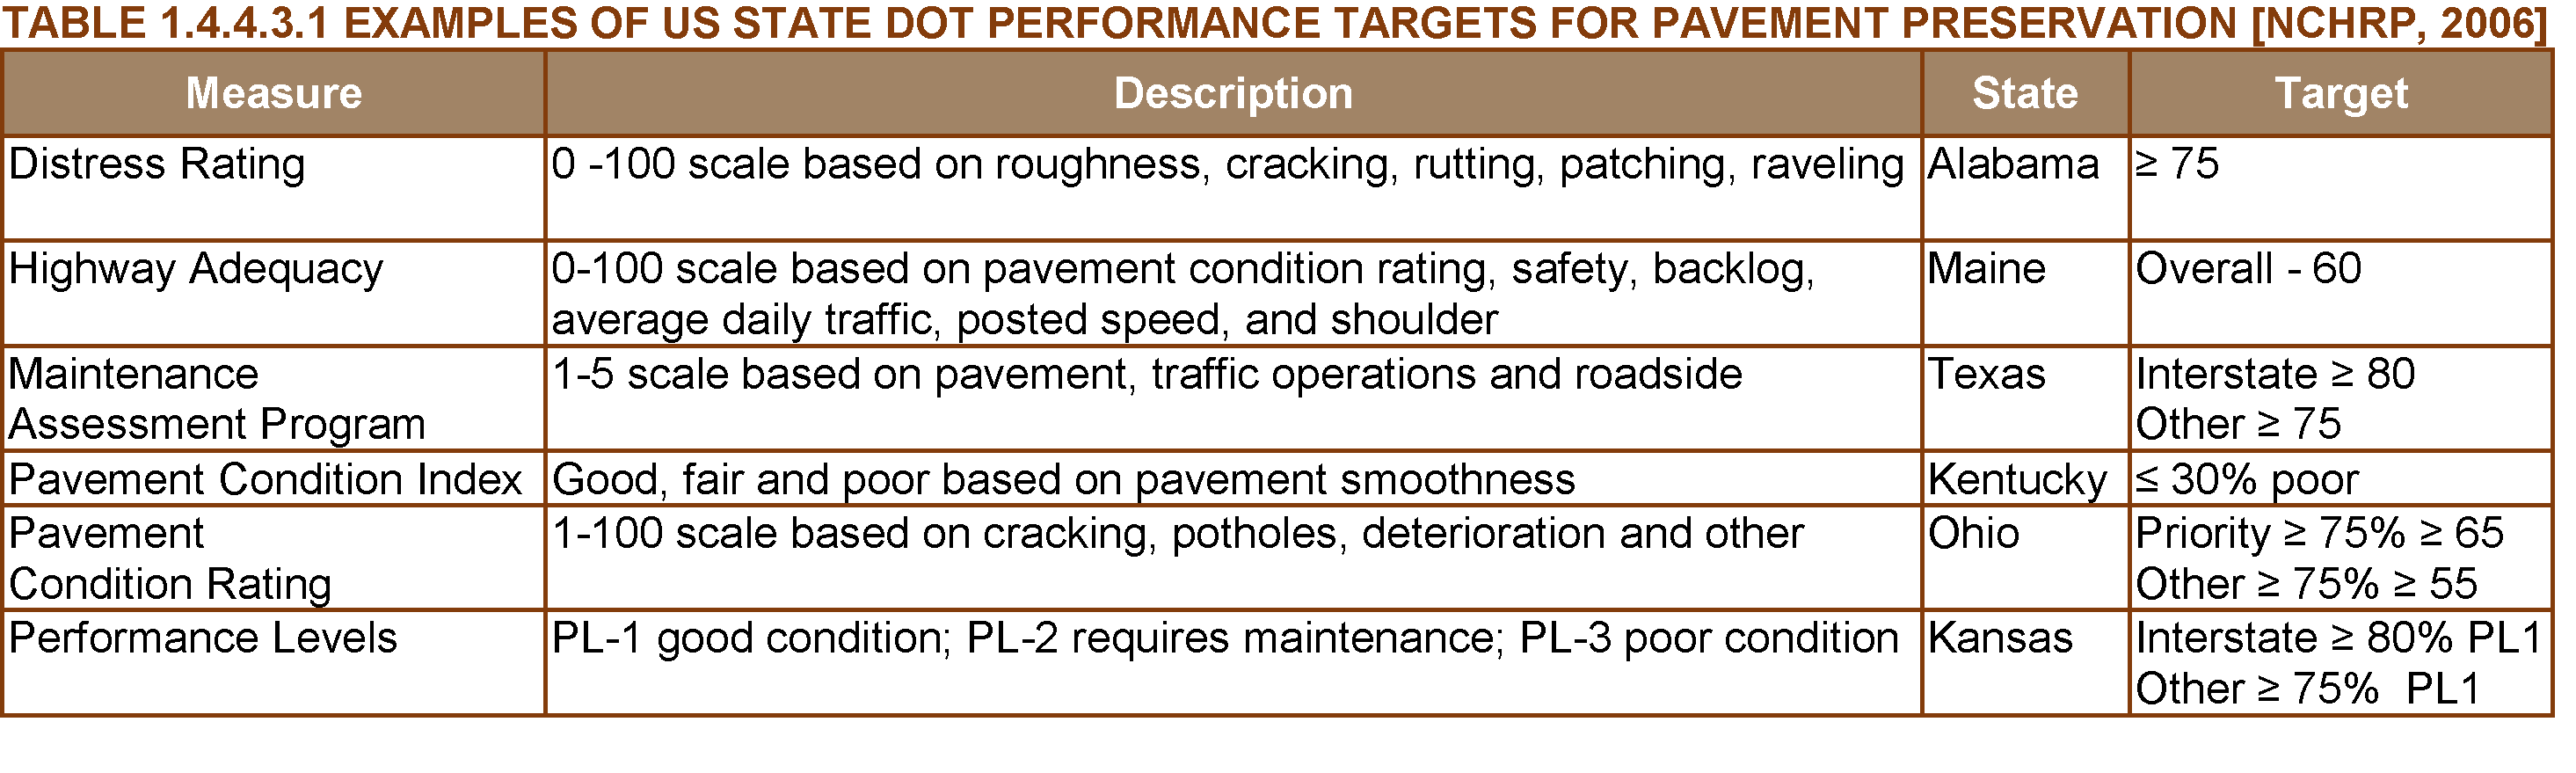
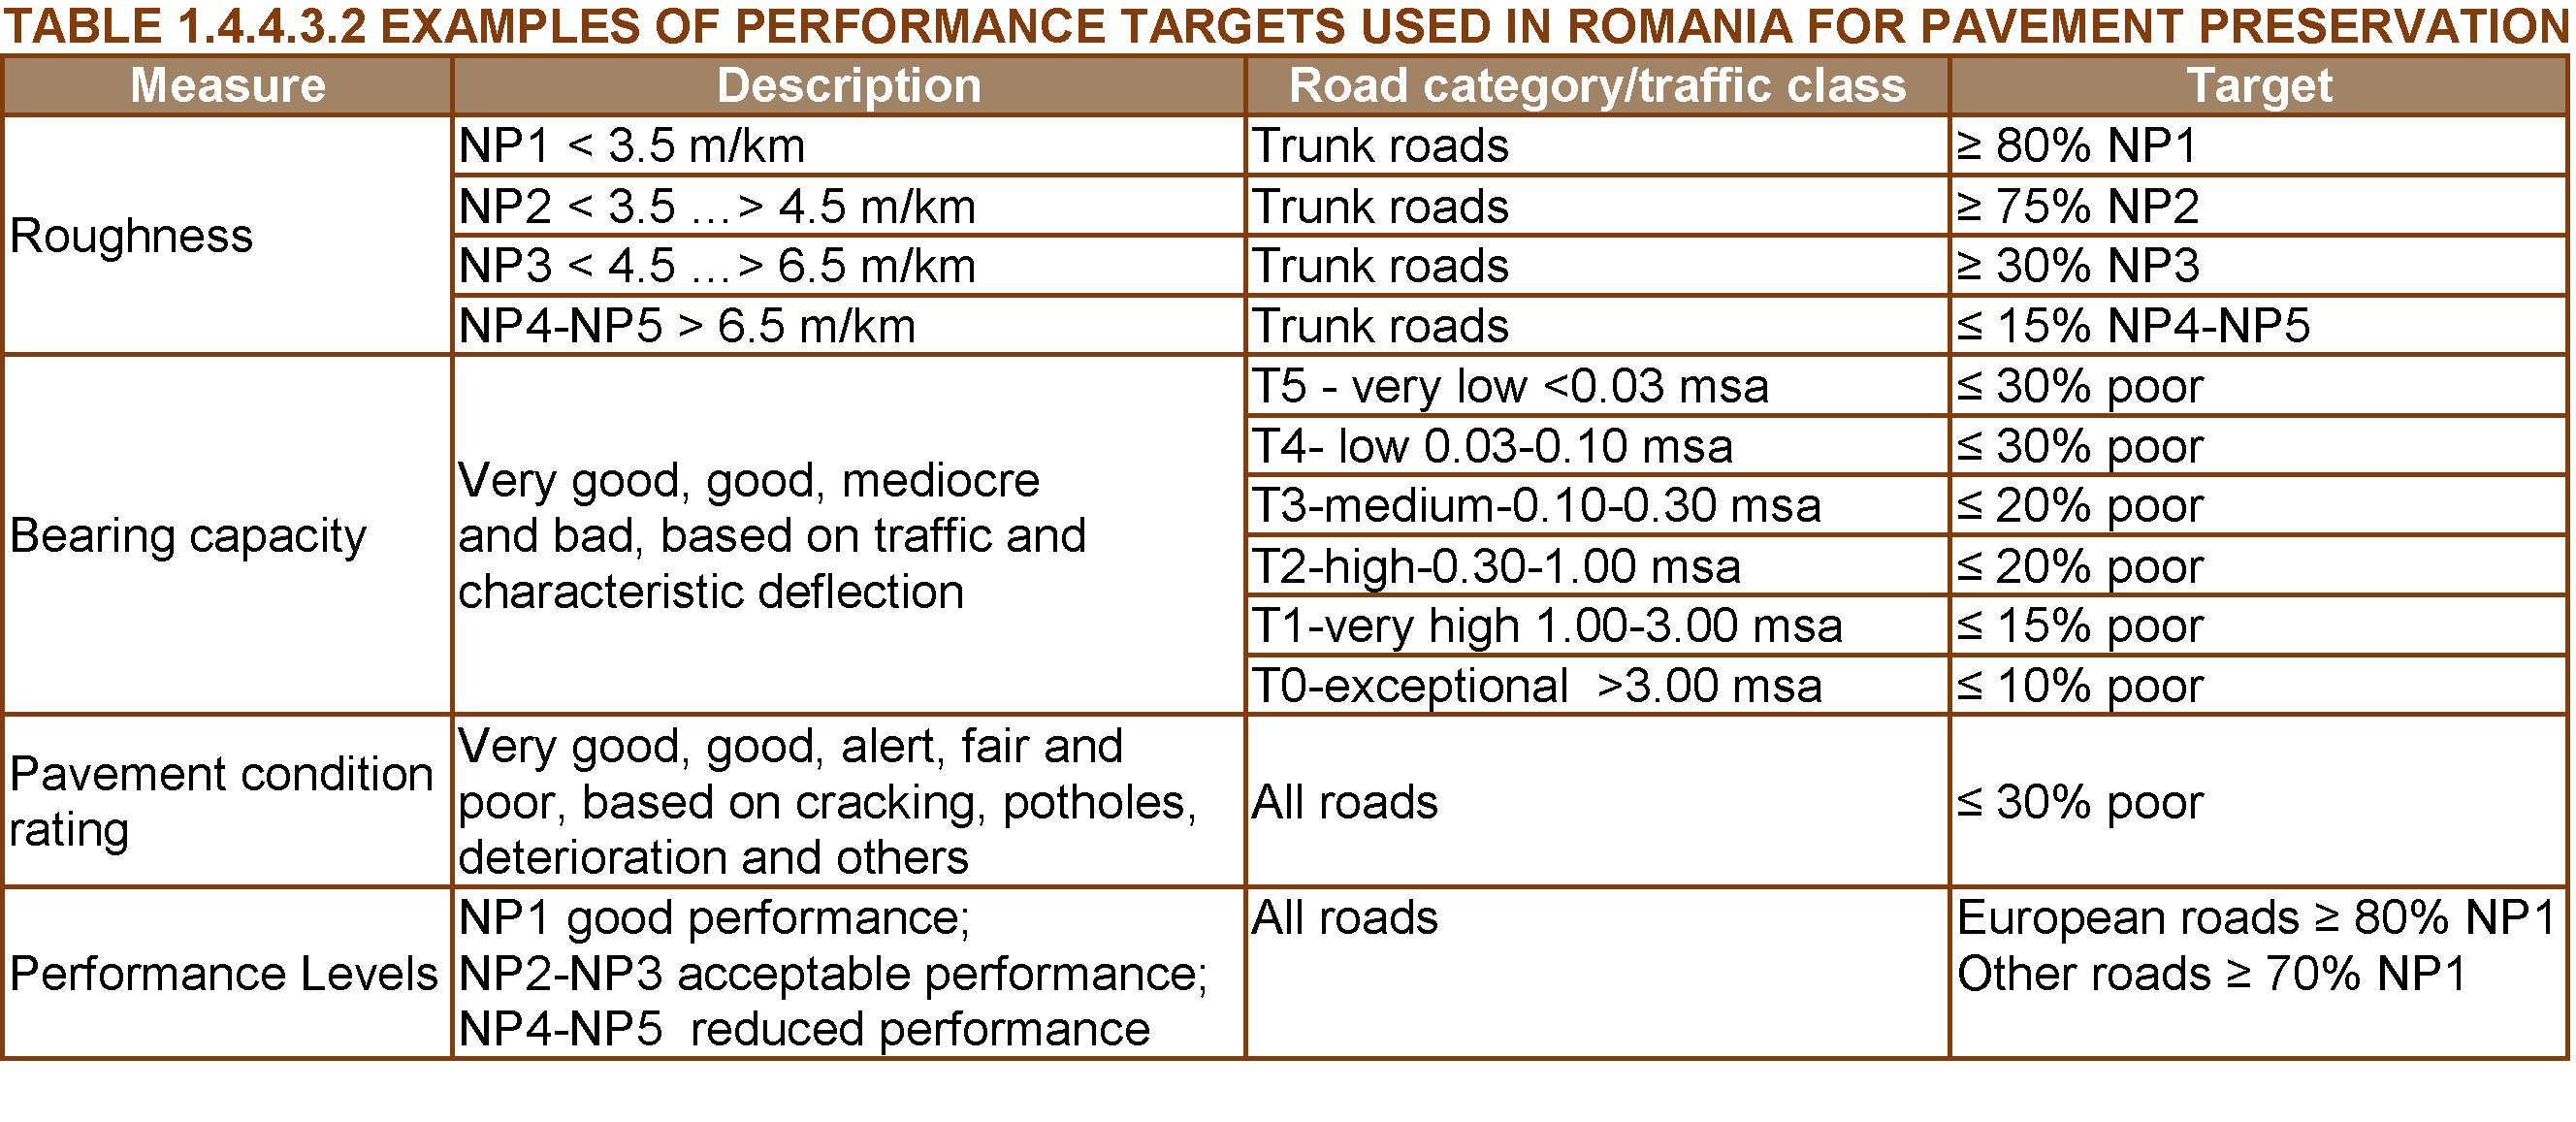
NOTES:
NP1 – very good performance;
NP2 – good performance;
NP3 – medium performance
NP4 - NP5 - poor performance
Traffic expressed in millions of standard axles (msa)
Once performance targets have been developed, they can be used to compare current against desired performance (levels of service). Any gap between the two informs about the works programs necessary to meet the asset management strategy.
An initial evaluation of performance gaps can be undertaken by simply identifying those performance measures where the target measure has not been met. It should be noted however that a performance gap could exist for a number of reasons as follows (see figure 5):
Gap 1: Customer Expectations – Management Perception: The customer’s expectations of the service provided do not match the service provider’s management perception of what is to be provided.
Gap 2: Management Perception – Actual Performance: The management perception of the service quality does not match the actual quality of service being provided
Gap 3: Actual Performance – Specified Performance: The service is not being delivered to the quality specified in the relevant standards and/or contracts.
Gap 4: Actual Performance – Communication to Customers: There has been inadequate communication with the customers resulting in them having a skewed perception of the service delivered.
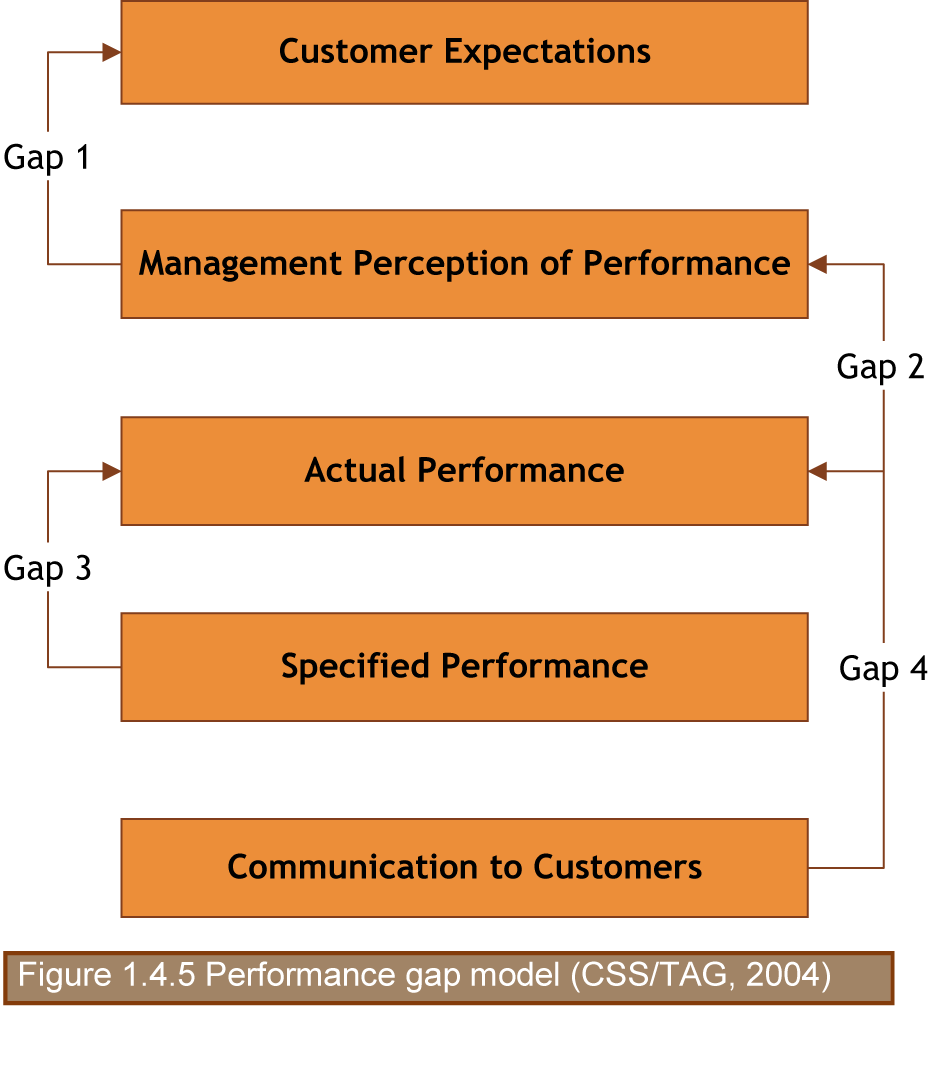
In works planning and programming, performance measures are used to structure the comparison of different options at the network and project levels.
The use of performance measures rarely makes decisions easier or automatic, but it can inform the decision – making process and communicate more effectively the consequences of investment choices.
Finally, attention should be paid to verifying that, after implementation of programs, the desired levels of service are achieved, capturing the lessons learnt from any lack of performance and including these in any revision of performance measures, targets and programs of actions/works. This is part of the approach to performance monitoring described in section 2.2.
AASHTO, 2013. Transportation Asset Management Assessment , Department of Transportation - Federal highway Administration, AASHTO Transportation Asset Management Guide: A focus on implementation — Executive Summary , Federal Highway Administration (FHWA) and AASHTO, June 2013 (http://www.fhwa.dot.gov/asset/pubs/hif13047.pdf).
Federal Highway Administration (FHWA) Transportation Asset Management Expert Task Group. 2013. AASHTO Asset Management Guide—A Focus on Implementation. Executive Summary. American Association of State Highway and Transportation Officials. Washington, DC. Last accessed July 29, 2015 (http://www.fhwa.dot.gov/asset/pubs/hif13047.pdf}.CSS/TAG, 2004. Preparation of a Model Framework for Asset Management (Plans) for a Highway Network in the UK: Stage One Report: Review of International and Cross- Sector Experience, May 2004.
HMEP, 2013. Highway Infrastructure Asset Management, Department for Transport UK, may 2013 (http://www.ukroadsliaisongroup.org/en/utilities/document-summary.cfm?docid=5C49F48E-1CE0-477F-933ACBFA169AF8CB).
United Kingdom Roads Liaison Group (UKRLG) and Highways Maintenance Efficiency Programme (HMEP). 2013. Highway Infrastructure Asset Management Guidance Document. Department for Transport, London. Last accessed July 24, 2015 (http://www.ukroadsliaisongroup.org/en/utilities/document-summary.cfm?docid=5C49F48E-1CE0-477F-933ACBFA169AF8CB).
ISO 55000, 2014. Asset management -- Overview, principles and terminology. ISO standard.
NCHRP 551, 2006. Performance Measures and Targets for Transportation Asset Management, National Cooperative Highway Research Program - Report 551, Transportation Research Board, Washington, D.C. 2006 (http://onlinepubs.trb.org/onlinepubs/nchrp/nchrp_rpt_551.pdf).
PAS 55, 2008. PAS 55: Asset Management – Parts 1 and 2. British Standards Institution's (BSI).
PIARC 2004. The framework for performance indicators, Comité technique 6 Gestion des Routes / Technical Committee 6 Road Management The Framework for Performance Indicators, PIARC Paris France 2004, ISBN 2-84060-165-6 (https://www.piarc.org/en/order-library/13485-en-The%20Framework%20for%20Performance%20Indicators.htm).
PIARC 2012. High level management indicators, Comité technique AIPCR D.1 - Gestion du patrimoine routier/PIARC Technical Committee D.1 - Management of road infrastructure assets, PIARC Paris France 2012, ISBN 978-2-84060-288-1 (http://www.piarc.org/en/order-library/17058-en-High%20level%20management%20indicators.htm?catalog&catalog-topic=33).
The following case studies are presented in this chapter:
CASE STUDY 1: GEPUR guide a single shared methodology for managing an inter-urban or an urban network
CASE STUDY 2: Footway evaluation developed by BRRC
HUGUES ODEON, CEREMA, France
In France, the IQRN method has been used to manage the national road network for about 25 years. But this method is not fit for local road networks, and there is no other simplified method available. The main purpose of the GEPUR project was to provide a single and shared methodology for managing local road networks of Eastern France (ten departments). This methodology was written by officers who are in charge of the daily management of inter-urban and urban road network; the group was led by a representative of the Cerema. The final guide is composed of two parts, the first one for inter-urban networks, and the second one for urban roads. The frame of these two parts of the guide is similar, but the urban roads have specificities that influence their behavior and lifecycle, making it necessary to take them into account.
The aim of the GEPUR project was on one hand to provide a guide available for road network managers and their contracting authorities, and on the other hand to create a group of road network managers who will be able to share their know-how.
The GEPUR project allowed road network managers to build their own methodology together, taking advantage of the experience of each of them.
The GEPUR guide provides an open methodology. Its implementation to a specify network can be different according to the contracting authorities policy, the length of the network and the financial capabilities of the department or the city.
Regarding the asset management plan, the road network manager can opt for different strategies. Usually, the network is divided in three or four classes, and the chosen strategy varies according to the classes.
First, he has to choose between different priorities:
Then, he has to define different technics for maintenance. Each of them has benefits and limits which must be taken into account. For example, the routine maintenance can only maintain the quality level of the road for a few years, a surface dressing can restore the surface characteristics of the pavement (impermeability, skid resistance) and an asphalt concrete can moreover contribute to strengthen the structure.
It is then possible to define which technics will be used on each class of the network, what the maintenance frequency is for each of them, and what average percentage of surface will be treated with each technic. For example (Table 1.4.7.1), on the class 1 network, it could be possible to adopt 15% of very thin asphalt concrete, 15% of thin asphalt concrete, 20% of asphalt concrete, and 50% of surface dressing. On the class 3, these percentages can respectively be 0%, 25%, 0% and 60%, with 15% of specific asphalt concrete for flexible pavement. The durability of each technic also depends on the traffic of the road, and consequently of the class (Table 1.4.7.2).
Table 1.4.7.1: Average percentage of each technics per class (%)
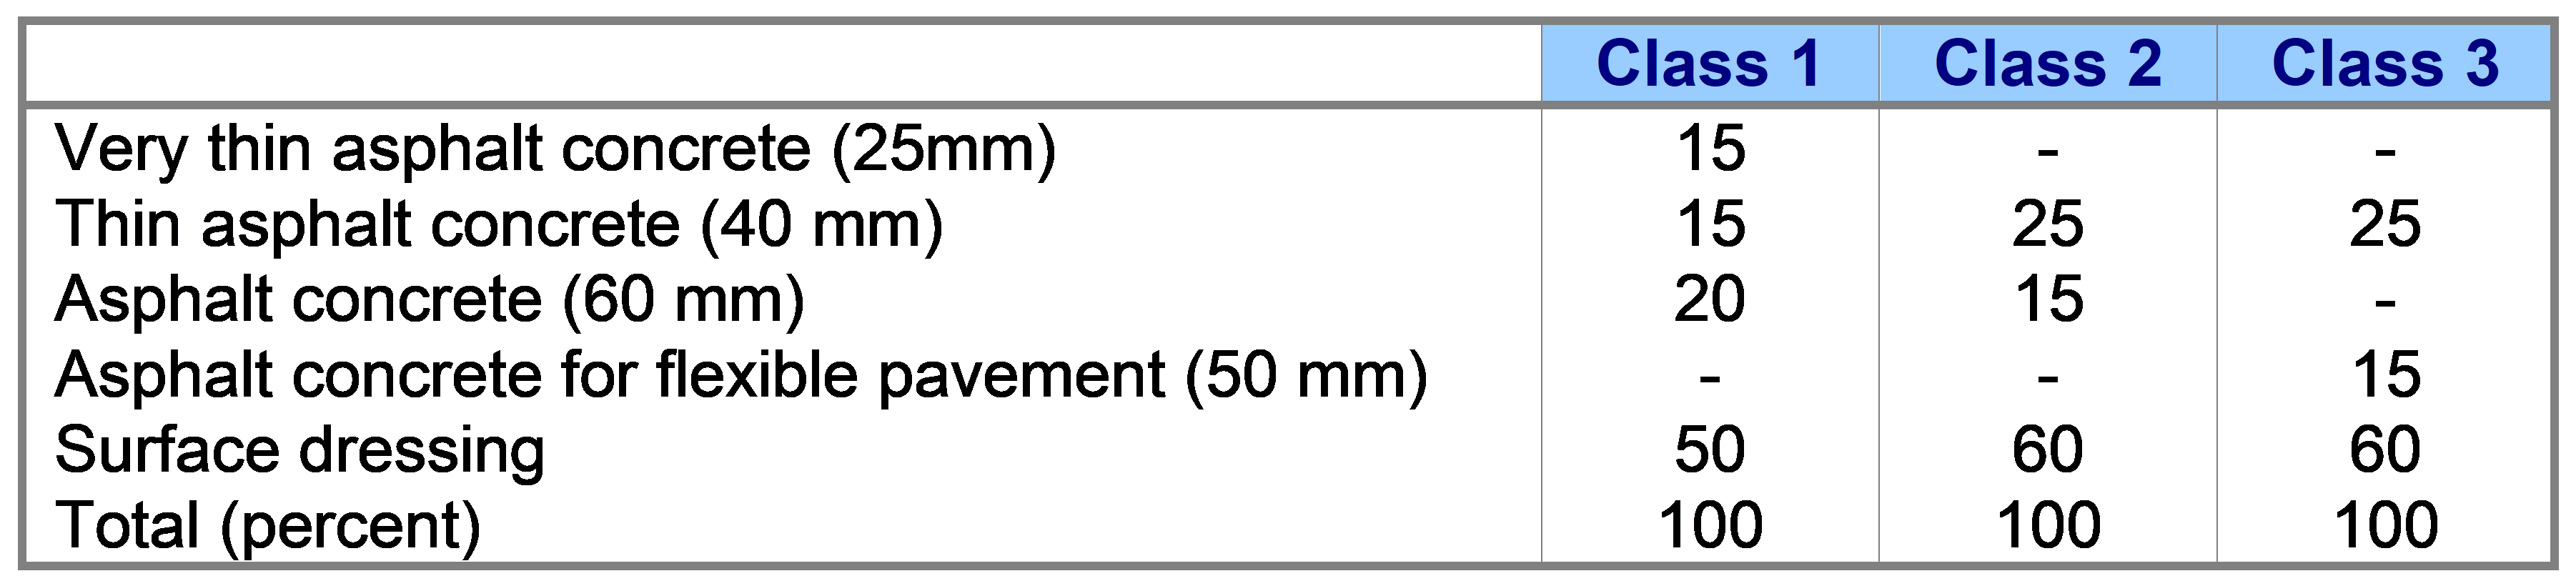
Table 1.4.7.2: Average durability of the different maintenance technics (years)
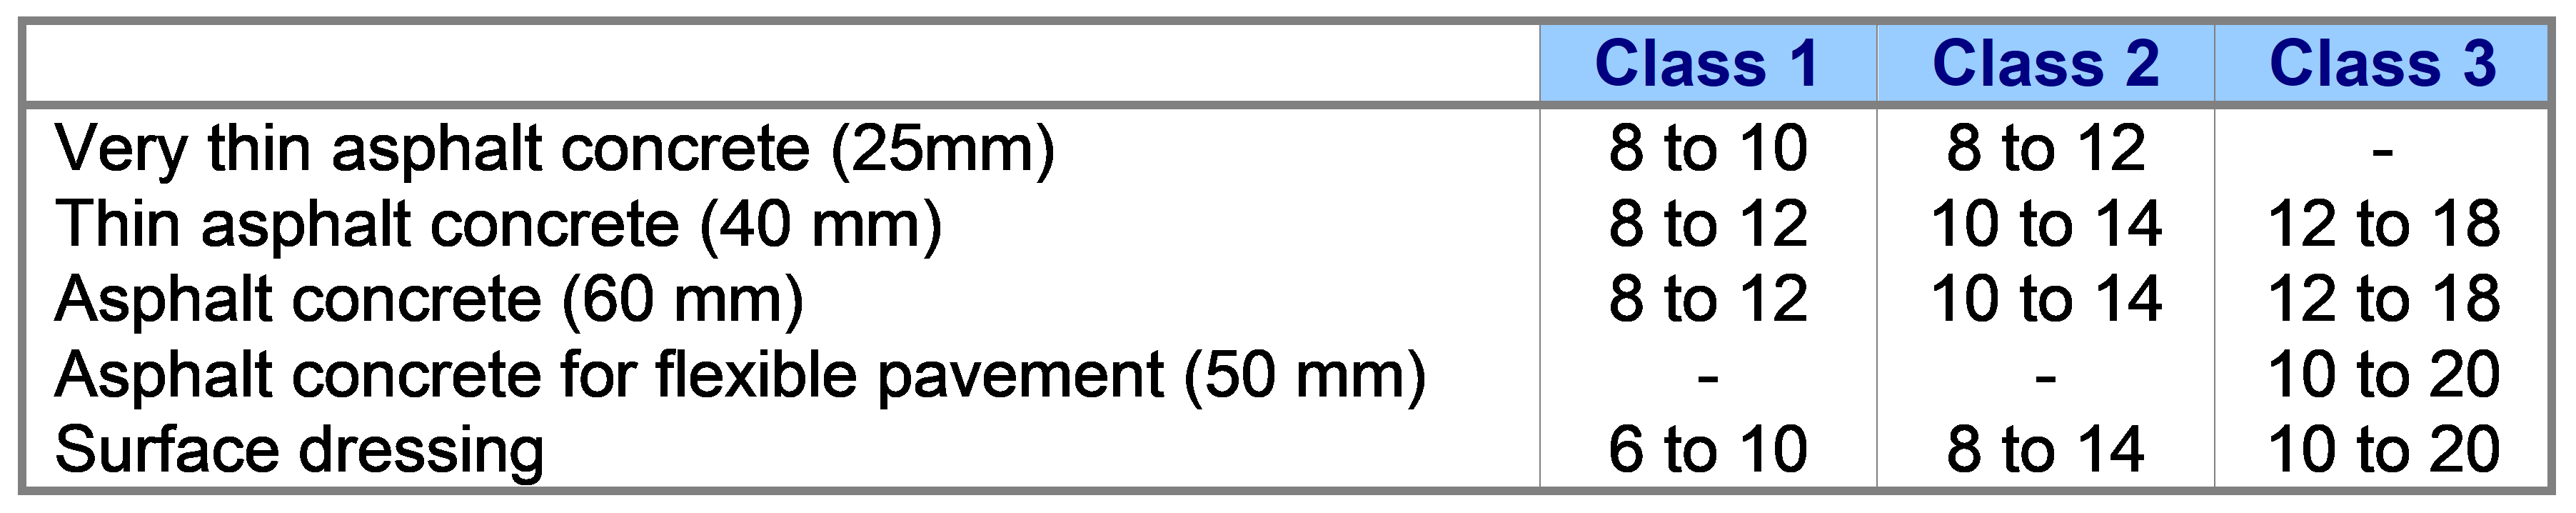
Finally, the road network manager defines an asset management plan for each class of the network (Figure 1.4.7.1), describing the type of maintenance to be applied and its average durability for a long cycle life (30 years for example). It is then possible to evaluate the global cost of this asset management plan over 30 years, and to adjust it to the financial capabilities of the department.
Figure 1.4.7.1: Asset management plan depending on the type of structure (flexible, bituminous, rigid) and traffic
The GEPUR guide provides a tool to the road network managers and their contracting authorities, which allows them to define their own asset management plan, according to their quality policy and the financial capabilities. This guide is in two parts, the first one for inter-urban road network, and the second one for the urban road network.
Group. 2016. GEPUR Part 1 : inter-urban network. IDRRIM. Paris (Fr), June 2016. https://www.idrrim.com/publications/4484.htm
Group. 2018. GEPUR Part 2 : urban network. IDRRIM. Paris (Fr), to be published.
Odéon H., Jung V., Schang J.P. (2015) : GEPUR, une méthode de gestion d’un réseau routier par et pour les collectivités locales, AIPCR 2015, Séoul (Corée du Sud), nov.
Odéon H., Schang J.-P., Jung V. (2017) : GEPUR : a method for managing a road network by and for local authorities, JTTE, USA, Marc-Apr, pp. 104-115.
TIM MASSART, BRRC, Belgium
Walking and cycling are green transport modes which should be given more attention in future. The quality of footways is not always very good. Maintenance planning and budgeting are mostly based on ad hoc repairs.
The problem is the lack of a complete evaluation method. We have developed an evaluation method for footways.
Our approach is based on a network analysis with a wheelchair, which is the most “sensitive” type of footway user. This wheelchair is equipped with sensors and a skid resistance measuring device. Three parameters (comfort/longitudinal unevenness in the direction of travel, gradient in the direction of travel, and crossfall) can be measured in one run, and a skid resistance measurement is made in each section of the network.
We would like to present this measuring equipment with results maintained untill now. Furthermore we would like to promote this approach and show the good relation between the objective measuring device and the subjective rating of the testpanel.
Efficient inventorying and inspection of footways.
The objective of this tool is to measure in 1 pass the comfort, crossfall and longitudinal slope of a footway in an objective way.
By measuring the 3 characteristics, mentioned above, in an objective way, we eliminate subjective complaints from citizens.
At the national and international level, there is currently no objective tool to determine this quality of pedestrian pavements continuously, quickly and cost-effectively. The concept is all too often approached subjectively, on the basis of the feeling that we get as a traffic participant in a public space. That is why the Belgian Road Research Center decided in 2015 to develop a measuring instrument to assess pavements on three criteria that are fundamental for pedestrians: flatness (comfort), skid resistance (resistance to slipping) and slope (transverse and longitudinal).
Relevant technical parameters to be collected for footway evaluation are the following:
Footway width
Different users need different footway widths. In this concept we use a wheelchair. We assume that people with impaired mobility are the most “sensitive” users of a footway. If people with a wheelchair, baby car or other vehicle can travel in an acceptable way, the criterion is met.
Longitudinal unevenness / comfort
The feeling of comfort on a footway varies widely with the type of user. In the concept proposed in this article, we will measure comfort with a wheelchair equipped with an accelerometer. This evaluation is objective and stringent, because a wheelchair user suffers the most from lack of comfort on a footway.
Crossfall / gradient
Crossfall should normally be lower than 2 %. This parameter will be measured continuously in the concept proposed below.
Basic concept (V0)
After analysing the available tools and the way inspections are made in other countries, we found that no existing device can measure all the relevant characteristics at an affordable price. That is why we are suggesting the concept described below. (This measurement method remains to be refined and the measuring equipment still needs to be developed.)
The basic component of the method is a wheelchair. We propose to convert it into a measuring vehicle. The chassis of the wheelchair as well as the wheels and the load (weight in the wheelchair) will be determined experimentally, as a first step. It seems interesting to choose the chassis and wheels so as to minimize suspension and damping, with a view to obtaining a highly sensitive measuring device.
Figure 1.4.7.2: Basic concept (Source: BRRC)
A smartphone is fixed onto the chassis and the following parameters can be measured:
In 2016, a first prototype (V0) was developed by the CRR. This was materialized by a wheelchair on which smartphones containing a GPS and an accelerometer had been fixed (equipment integrated by default in all smartphones). This equipment provided figures concerning the comfort of the coating (rating out of 10). This comfort is evaluated via the accelerometer which will measure the vertical accelerations generated by the surface of the coating on the wheelchair and therefore in fine on the user. In order to measure also the adhesion of the coating, a complementary tool available to the BRRC has been used: the Portable Friction Tester (PFT - more information available on www.brrc.be/fr/article/f1301_06 and www.vti.se/en/Publications/Publication/road-marking-friction_669533).
At the end of 2016, surveys were carried out with this prototype and the PFT tool on eleven "test" sites located in the city center of Brussels, each with a different coating: two asphalt, two concrete and seven natural stone .
In April 2017 and in collaboration with Brussels Mobility, the adherence and flatness of these eleven sites were then evaluated by different users during a morning organized by the CRR. The objective of this approach was to verify if the results obtained by the measuring equipment, reflected the feeling of pedestrians. In total, twenty-eight participants took part in this field exercise: eighteen valid pedestrians and ten people with reduced mobility (people in wheelchairs, people walking with difficulty, people with visual impairments). A test sheet was completed by each participant and for each site.
Figure 1.4.7.3: Evaluation of the footway by user (Source: BRRC)
At the end of the analysis and as illustrated in the graph of Figure 1.4.7.4, a classification of the sites according to the comfort of the coating perceived by the users was carried out. The classification obtained from the subjective data collected by the twenty-eight users (light blue on the graph), compared to that obtained with the encrypted data collected by the prototype (dark blue), shows that a correlation exists on this notion of comfort.
Figure 1.4.7.4: Comfort ranking (Source: BRRC)
Encouraged by this encouraging observation, the BRRC decided during the summer of 2017 to develop a second prototype (V1) with several objectives:
Presented in preview on the stand of the BRRC at the Belgian Road Congress in Brussels at the beginning of October 2017, this equipment allows to measure continuously and in a "geolocated" way the comfort and the longitudinal and transversal slopes of the sidewalks and other pedestrian spaces. The measurement of adhesion can currently not be performed by this equipment and always requires the use of additional equipment (PFT tool for continuous measurement (tests in progress), SRT pendulum (Skid Resistance Tester for point measurement). This second prototype and the sensors that compose it are shown in Figure 1.4.7.5.
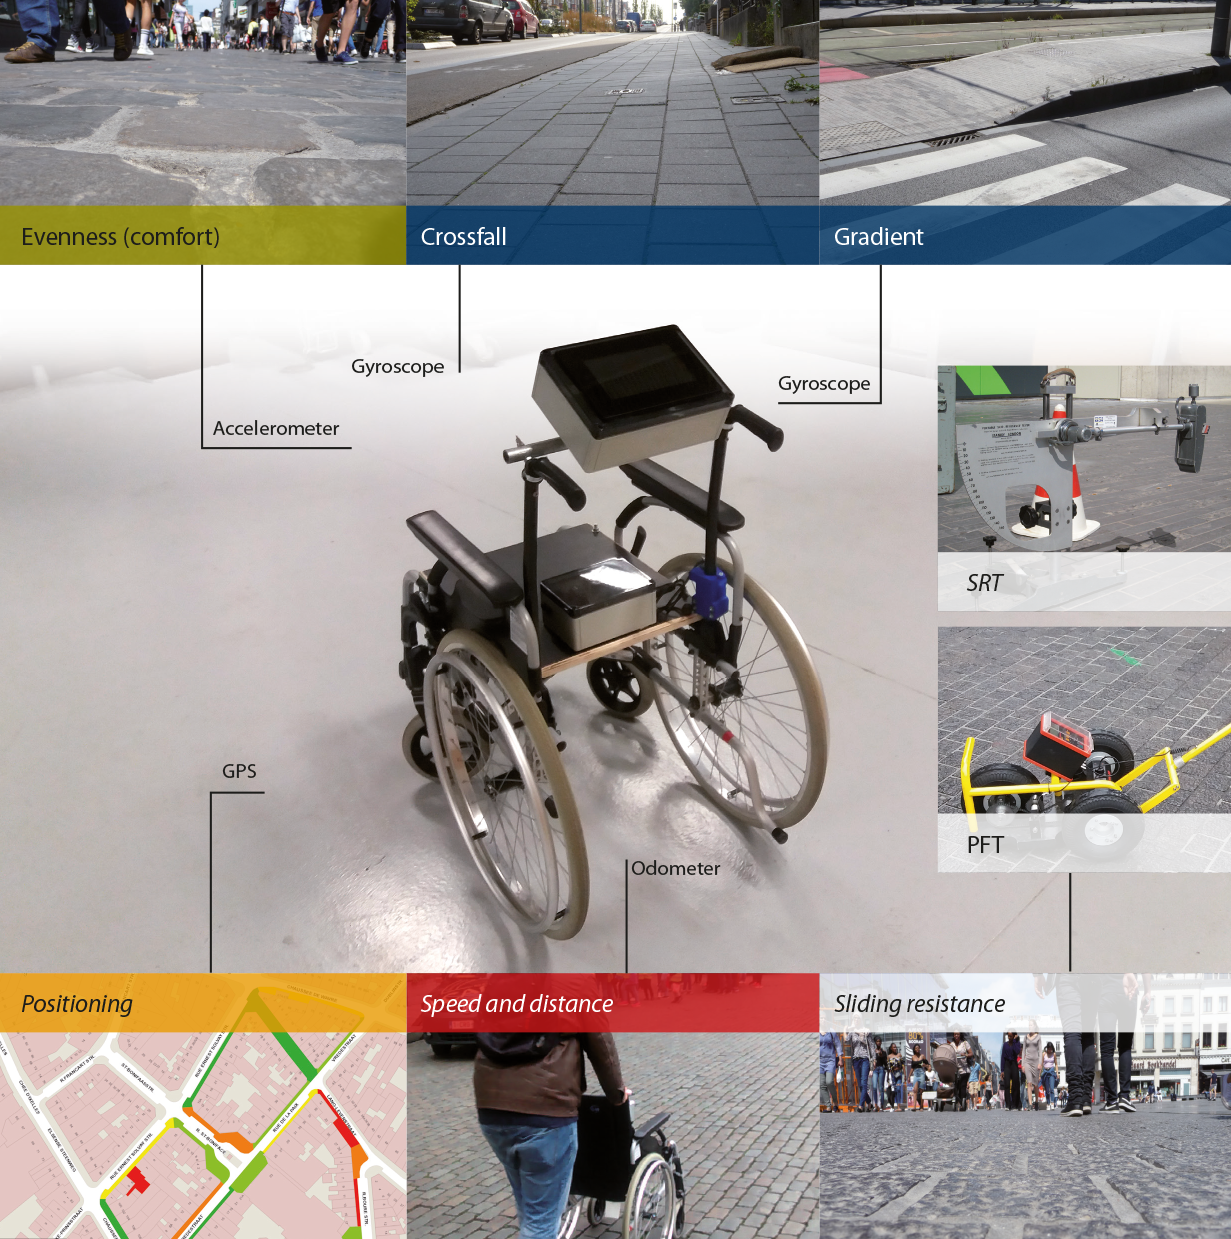
Figure 1.4.7.5: Second prototype (Source: BRRC)
In summer 2018 we have surveyed a complete city center in Belgium with the measurement equipment. In the map beneath, you can find the results on the comfort of the footways for the complete city center.
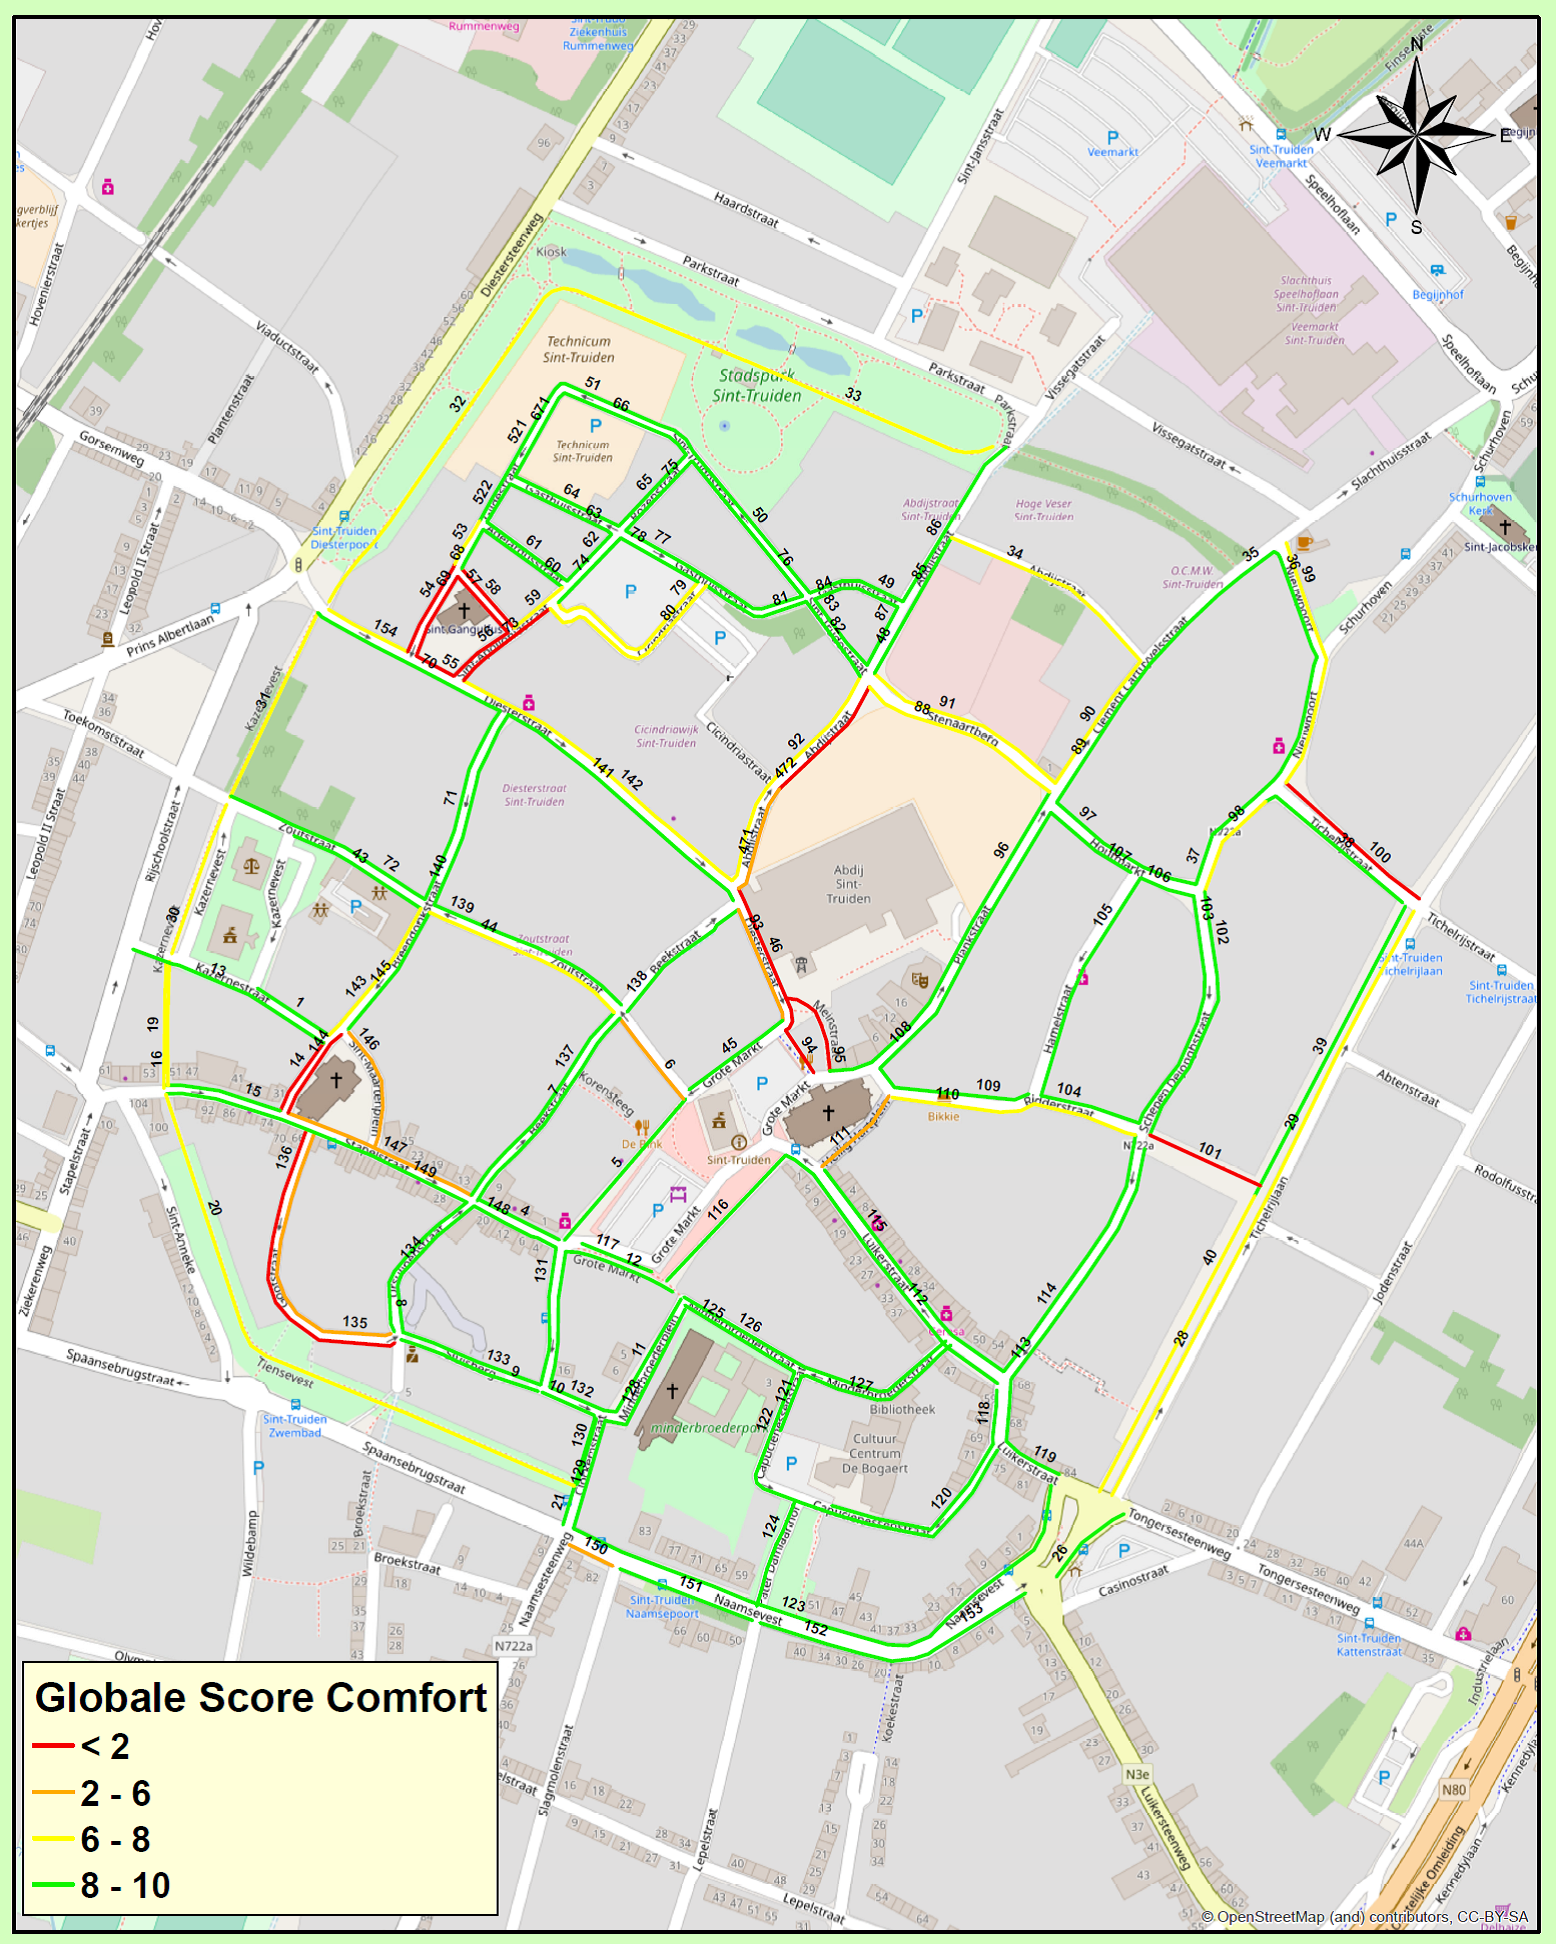
Figure 1.4.7.6: Comfort assessment for a whole network (Source: BRRC)
This functional equipment is now integrated in the family of roadside inspection equipment available at the BRRC. It can be used to respond to external technical assistance specifically oriented to the quality of use of pedestrian coatings.
The road administrator will be able to categorize different pedestrian coatings based on comfort (wheelcair equipment) and adhesion measurements (PFT). The following figure shows a decision grid that can be used to trigger an intervention. In the green area (VG Very Good) we have a pedestrian coating with very good scores on comfort and adhesion. In the red zones we have at least one problem (adhesion or comfort). Based on this we can choose a substantiated measure.
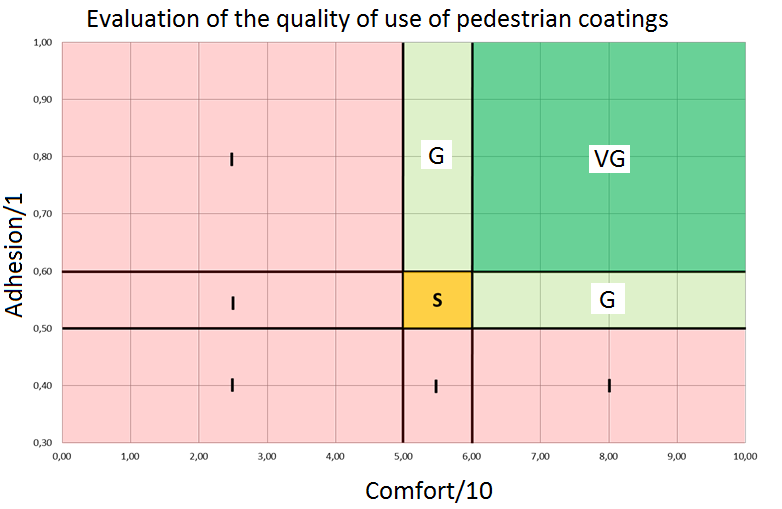
Figure 1.4.7.7: Evaluation grid for footway coatings (Source: BRRC)
The concept presented above has been tested in actual practice. We will explore different strategies to get this equipment on the market.
Walking and cycling are green transport modes which will get more attention in future. The quality of footways is not always very good. In most cities, road managers have difficulties in estimating the quality level of their footway network. Maintenance planning and budgeting are mostly based on ad hoc repairs. With this complete evaluation method administrators will be able to manage this asset in a more efficient way and with a well determined approach.
After this inspection, the administrator will have a good overview of the quality of his footway network. He will easily find those footways who need a maintenance. On the other hand, experience will be gained for different types of pavements for footways. With this experience, the administrator will be able to decide wich type of pavement is suitable for which footway.
Tim Massart, 2018. The Belgian Road Research Center strives to develop a Tool that measures the usability of pedestrian surfacing/ Routes/Roads n°377 – 2nd quarter 2018. Location.