
The data collection process begins with the establishment of data needs. Data needs will vary from agency to agency depending on the complexity of the transportation network, the level of maturity of the agency, available technology and indices used to reflect the condition of the assets (U.K. Roads 2013). For relatively small and less complex networks, this may consist of a visual survey to establish an overall condition index. Larger networks in more developed countries my include the use of digital survey vehicles and other equipment that measure asset attributes using digital imaging, laser technology and equipment that measures the in-situ strength of the asset. Regardless of the method used, quality control and assurance procedures should be established to ensure the consistency of the condition assessments. While multiple asset attributes may be measured to assist in making detailed project level maintenance and rehabilitation decisions, these attributes may be combined to provide a single measure of asset condition for network level asset management.
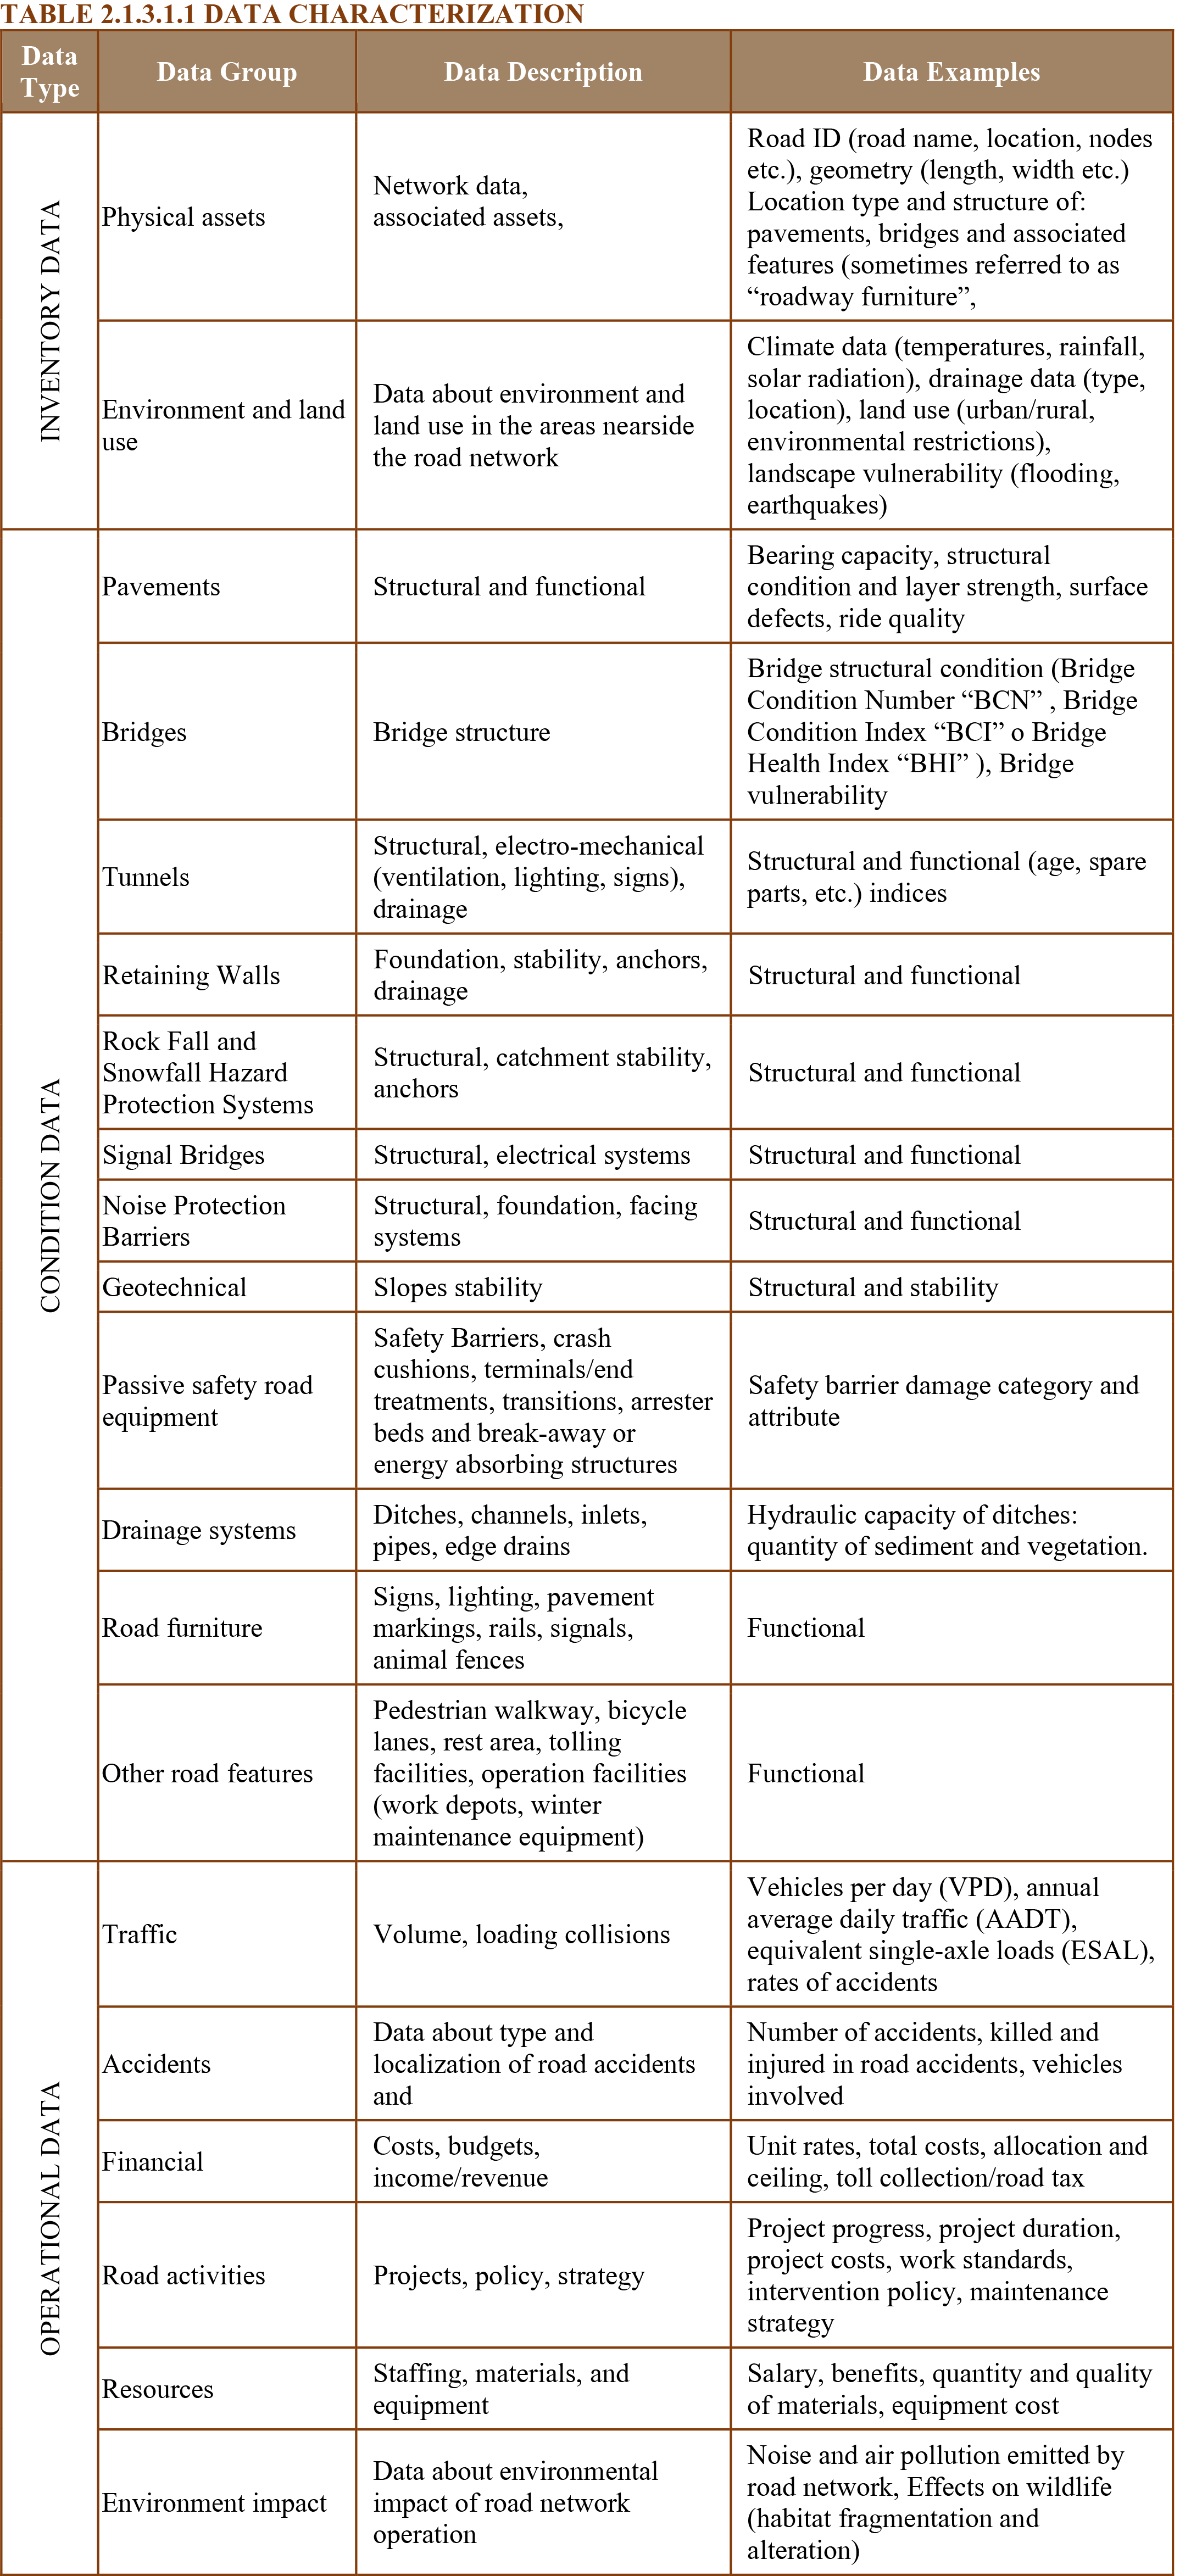
Road data can broadly be categorized into various data groups, as shown in Table 2.1.3.1.1.
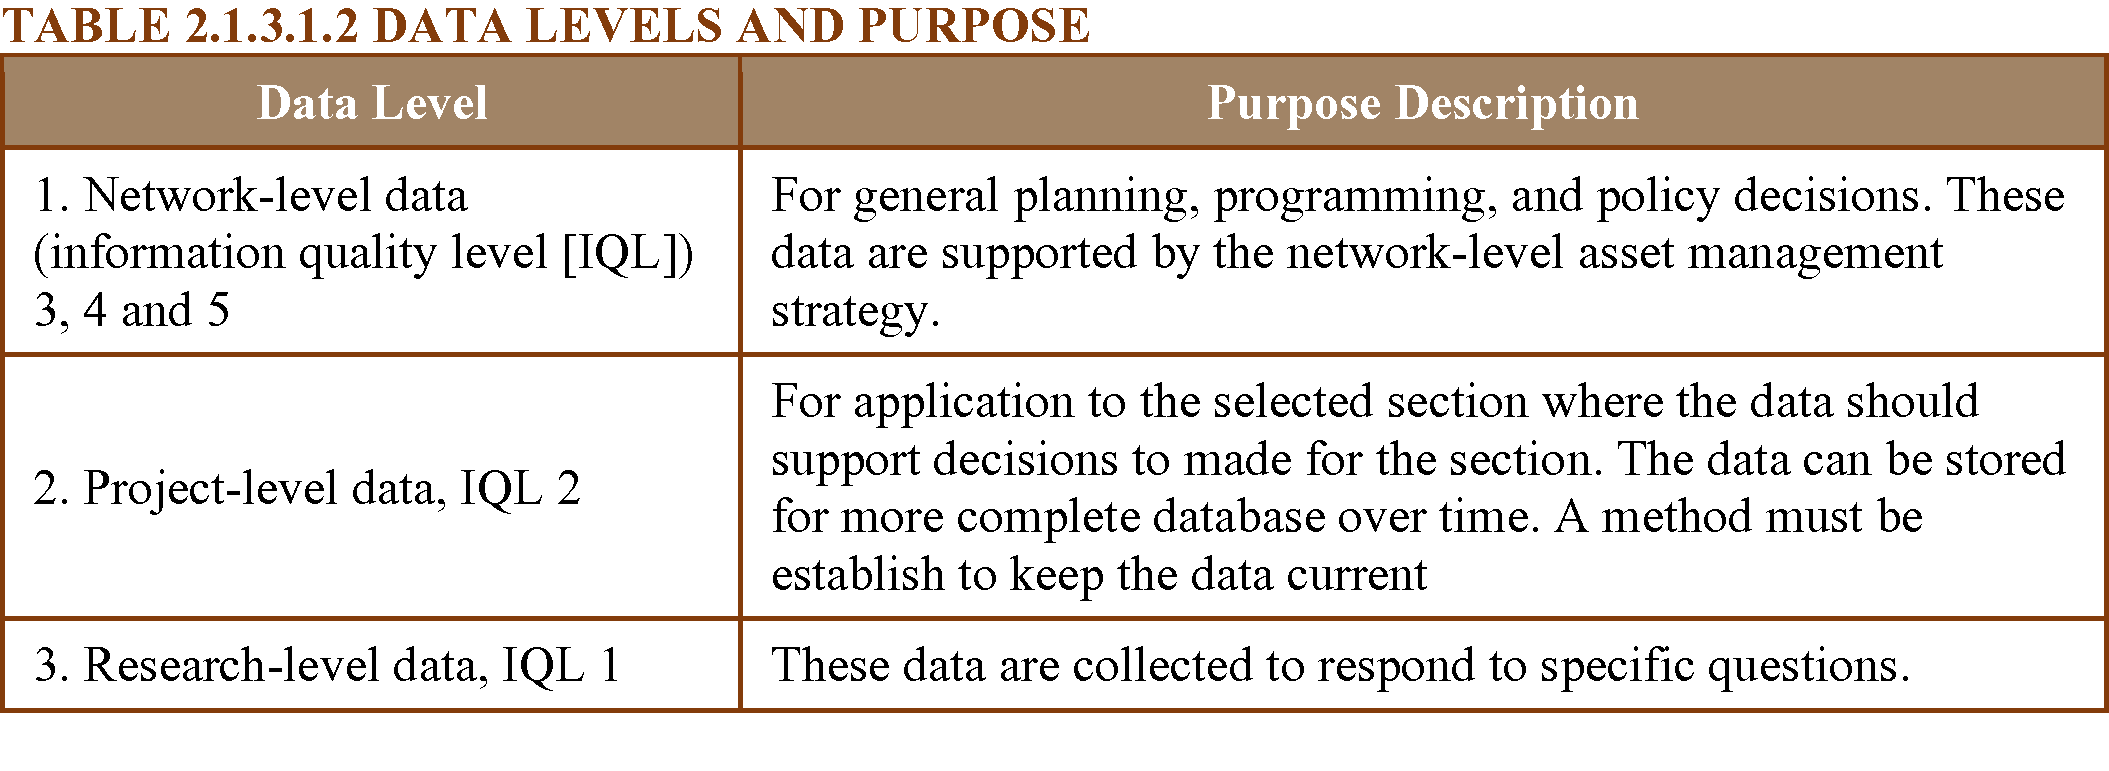
When collecting data, the road organization needs to consider the level of analysis for which it will be used, as summarized in Table 2.1.3.1.2.
The amount of data to be collected and the frequency at which data will be collected will depend on the following:
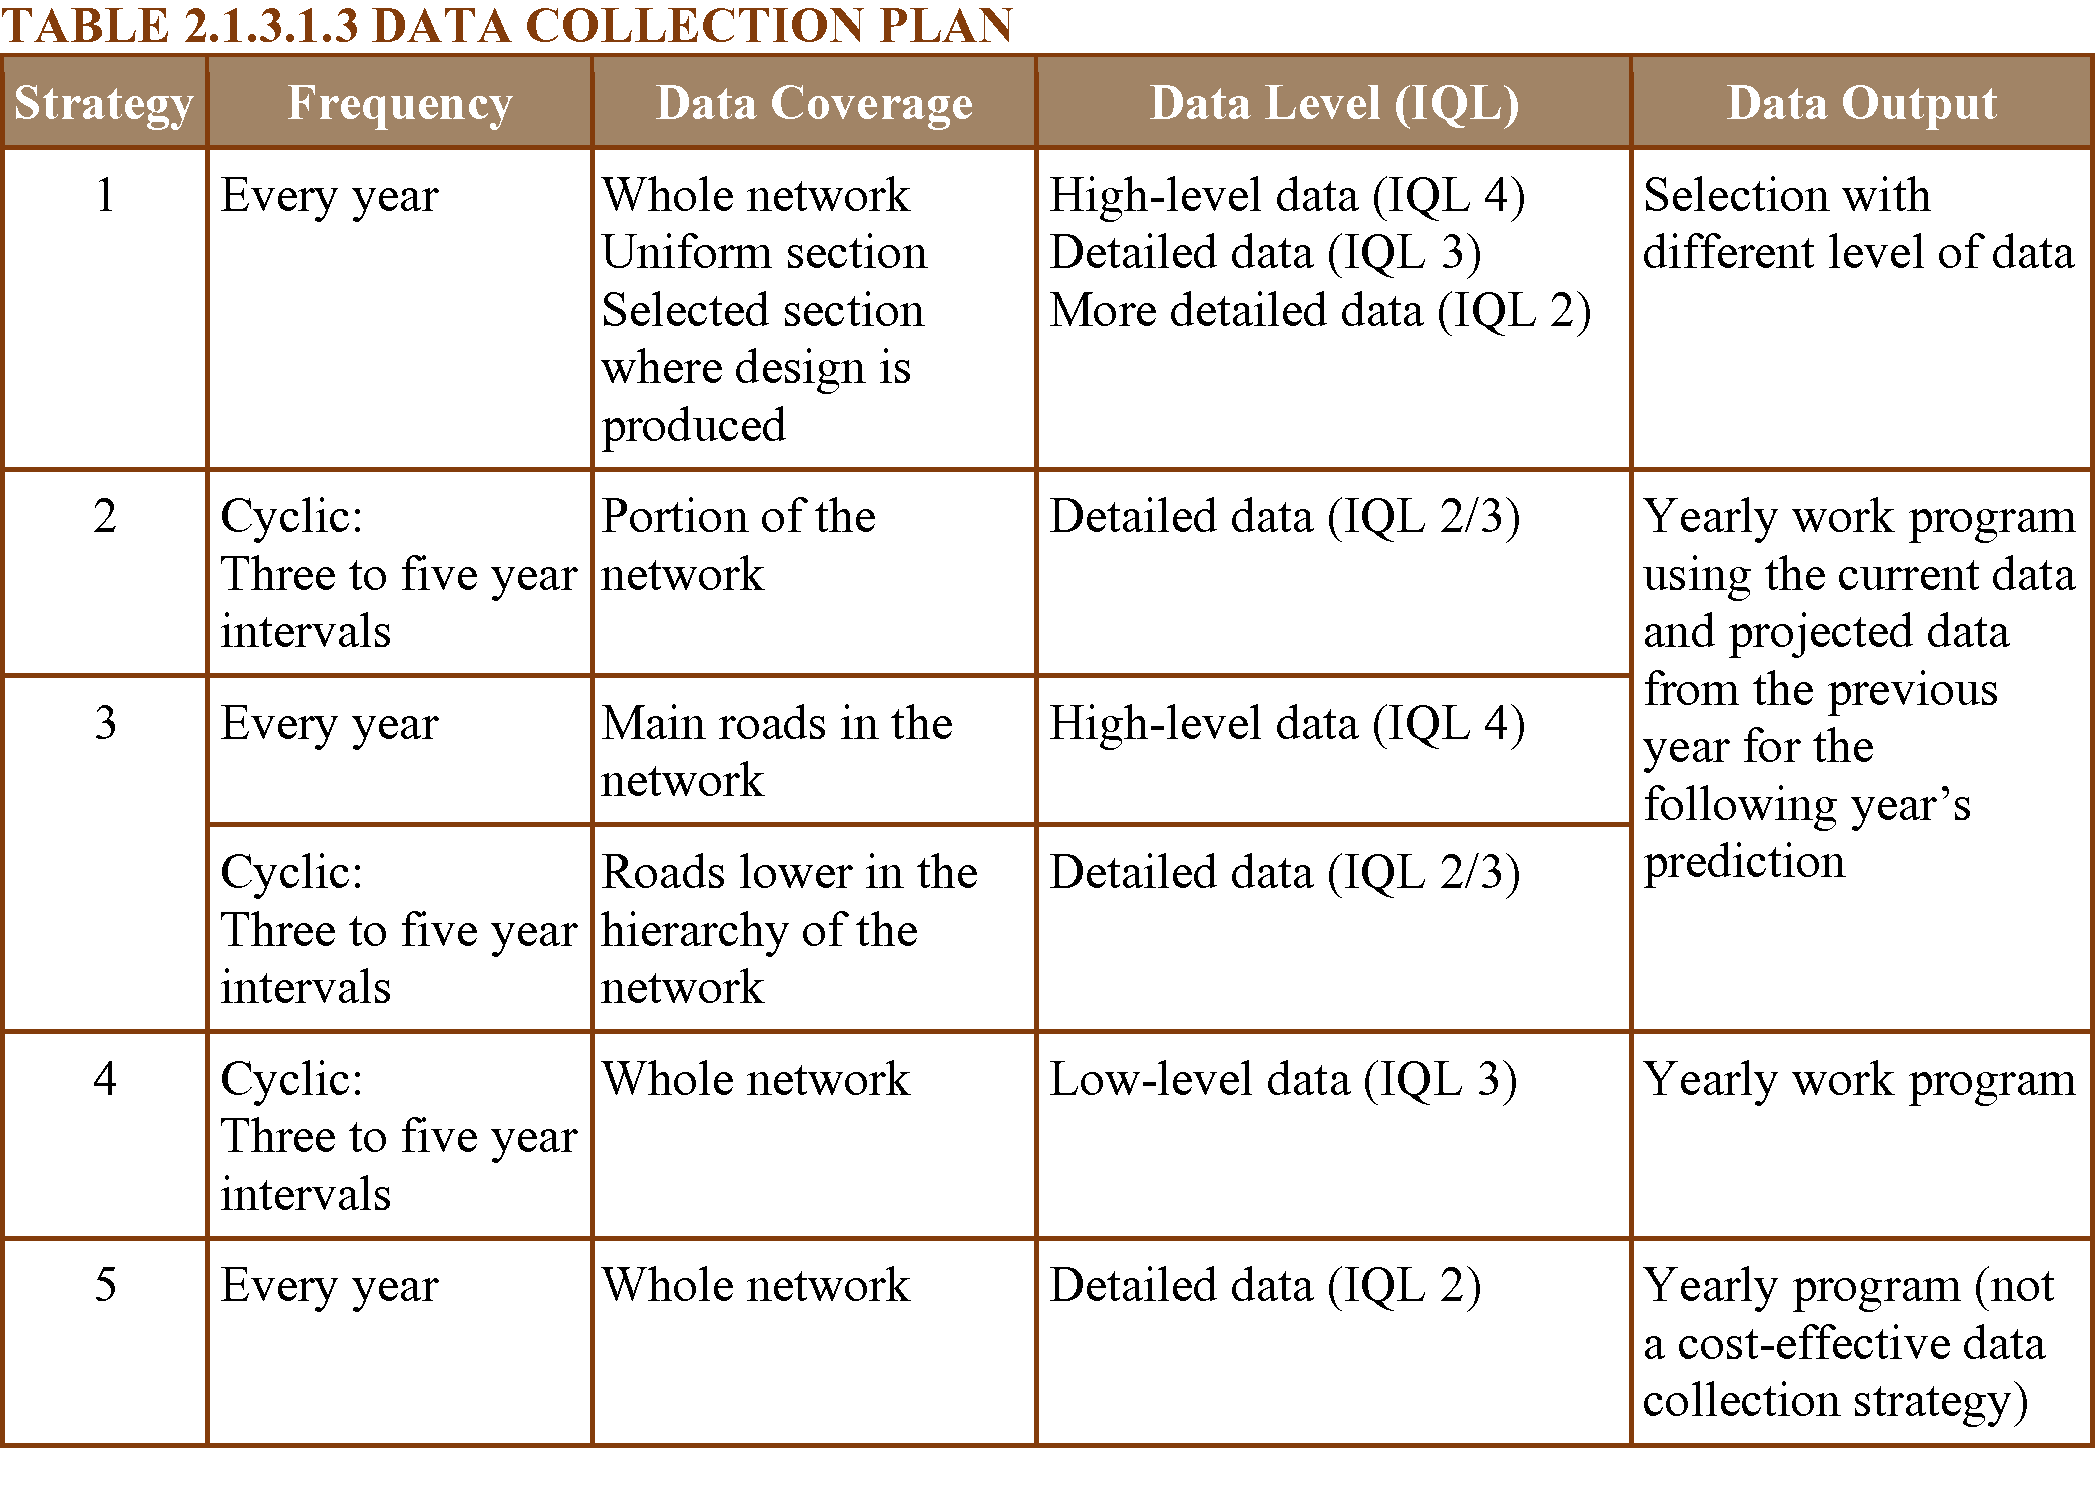
The road data collected should be programmed or strategized to match their function in the asset management process and the data IQL. A data collection program that can be adapted by other transportation agencies is shown in Table 2.1.3.1.3.
Traditional methods used for the collection of Asset Management data include manual, automated, semi-automated, and remote collection. For manual collection the data are documented either with pen and paper, or in more recent cases, with handheld computers equipped with GPS. Automated collection involves the use of road sensors or multipurpose vehicle equipped with a position/navigation system (e.g. distance-measuring device and GPS antennas), a combinations of different sensing technologies (e.g. video cameras, gyroscopes, laser sensors, etc.) as well as computer hardware in order to capture, store, and process the collected data. Semi-automated methods involve similar equipment as the completely automated method but with a lesser degree of automation. Remote Collection method pertains to the use of satellite imagery and remote sensing applications (e.g. high-resolution images acquired through satellites, aerial photos, etc.).
In the last decades, data collection have shown a trend toward automation, computerization and digitalization. Furthermore, there is a great expectation of taking the advantage of big data (e.g. data collected by users by smartphone) in the asset management process.
The following factors determine the selection of technologies and equipment for data collection:
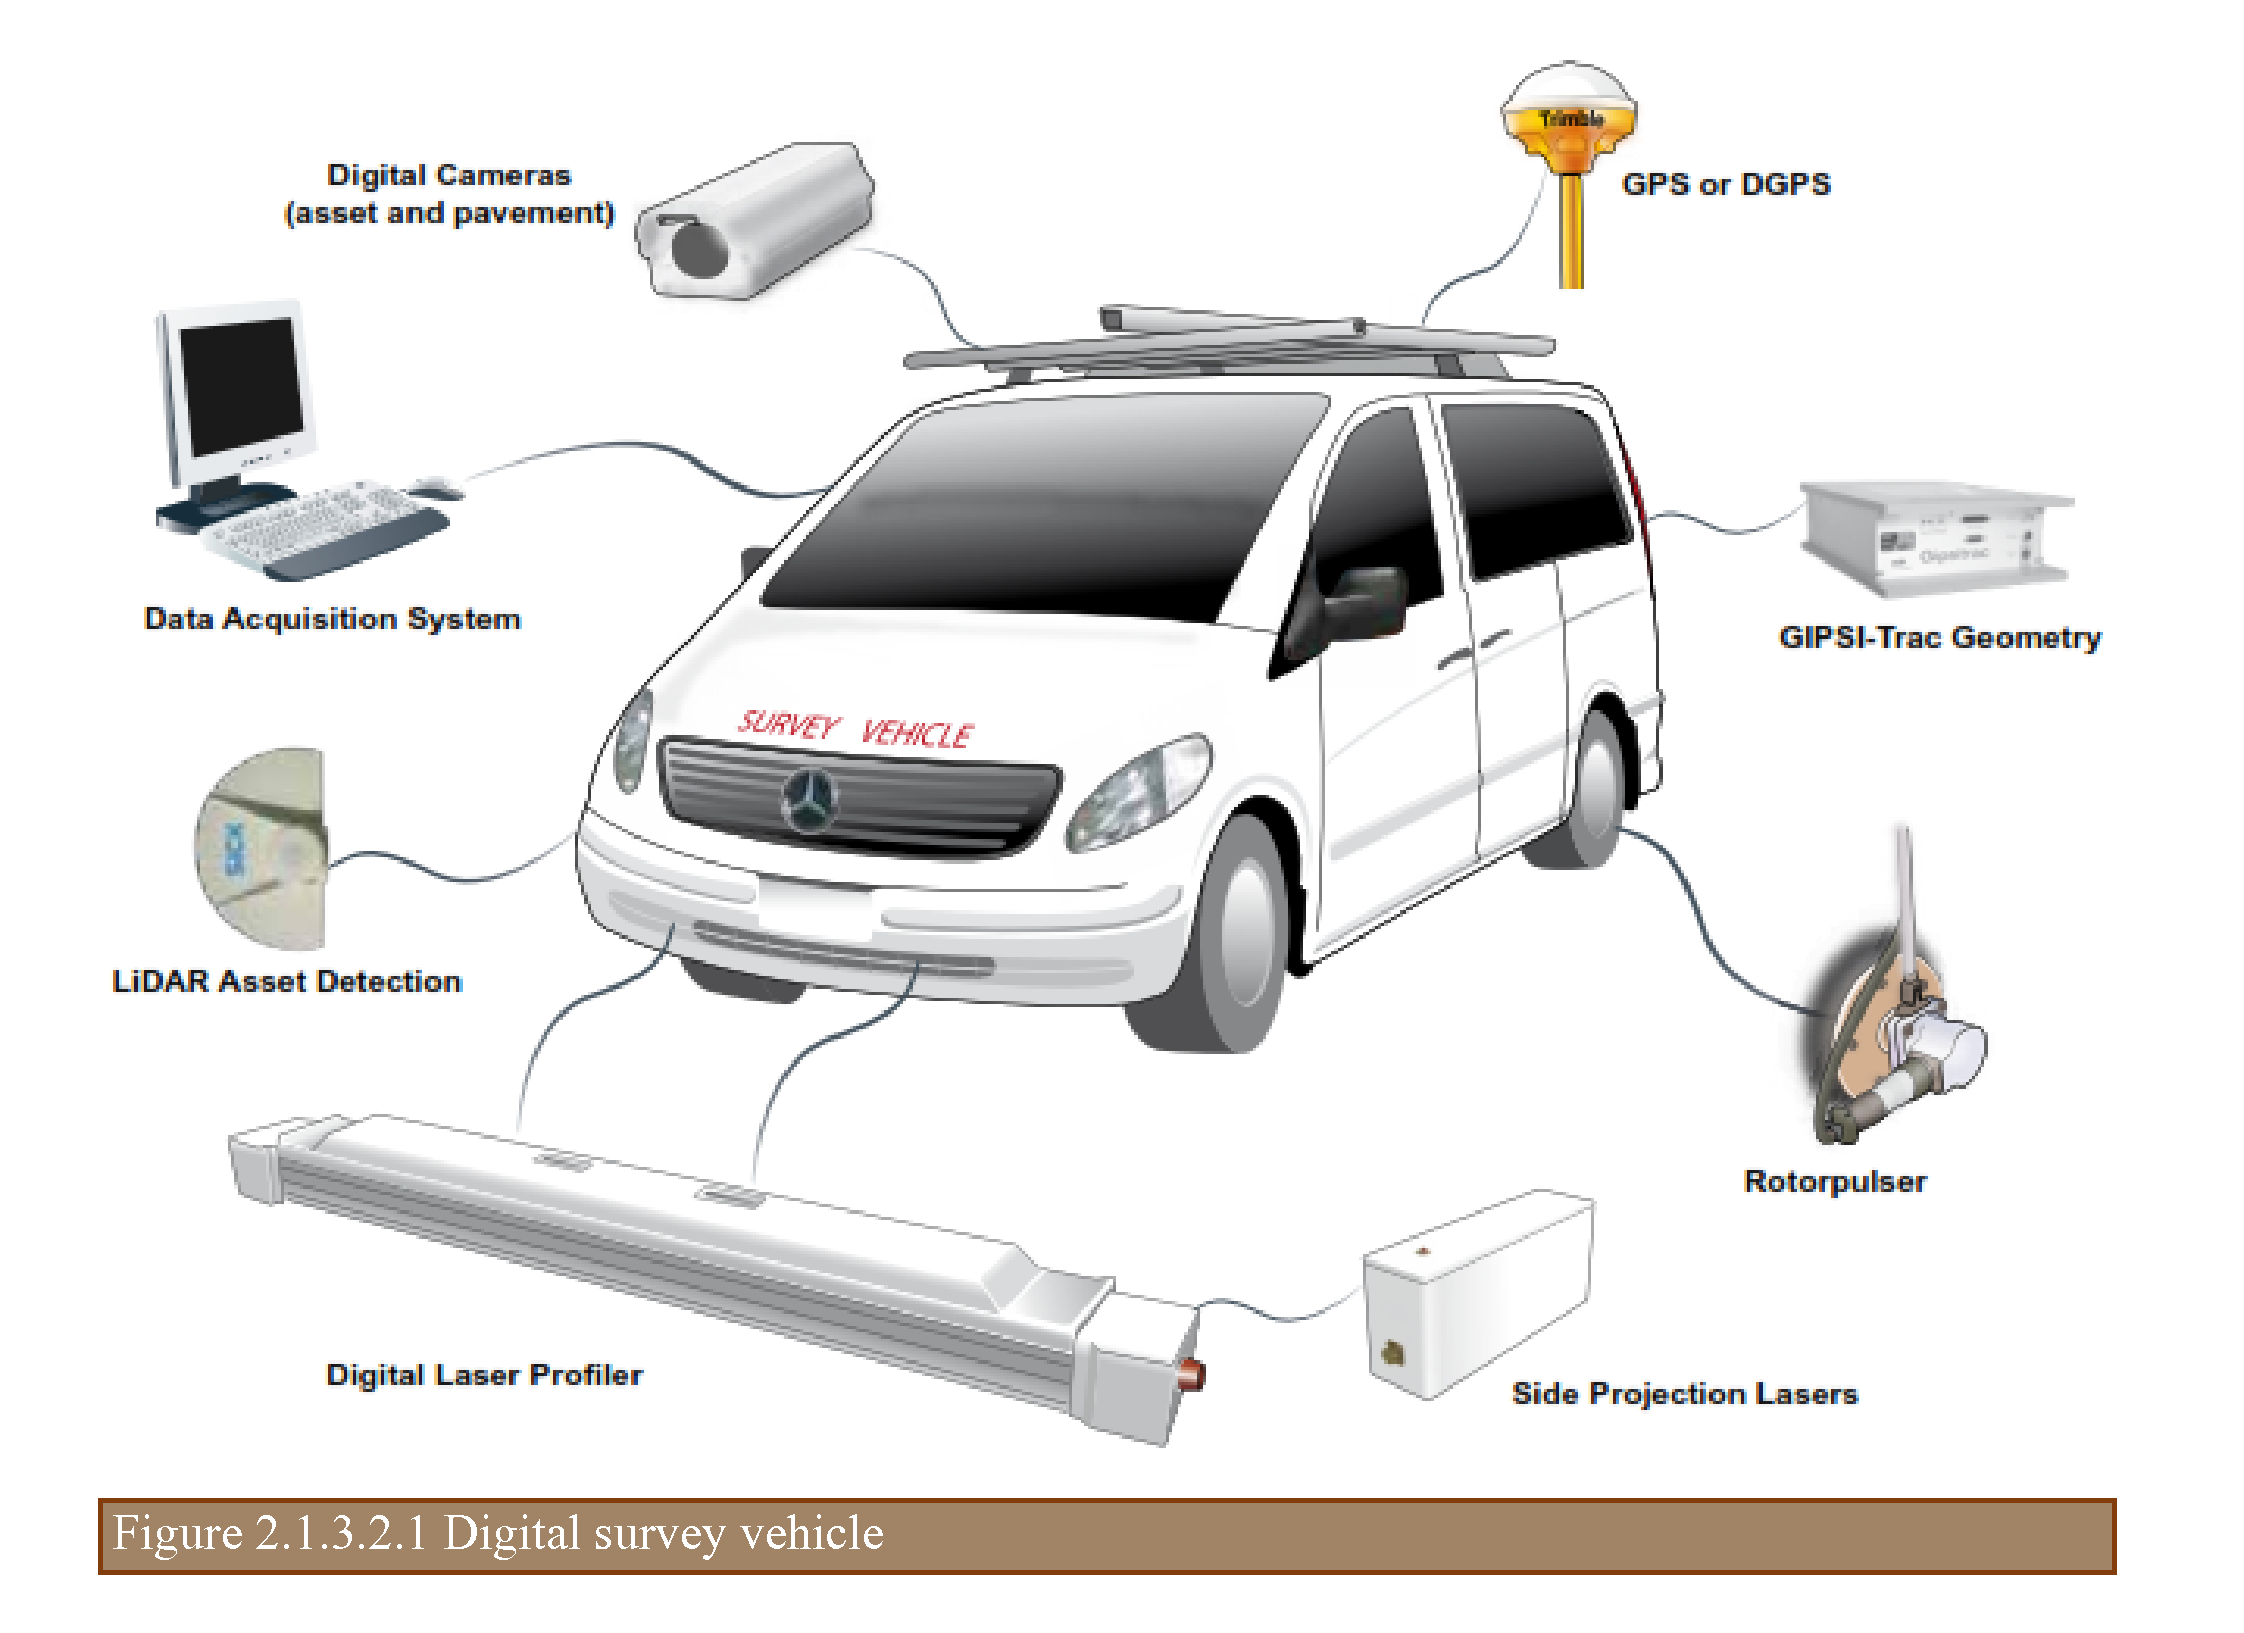
It will be advantageous if the equipment or methods employed in data collection can collect road data in a single operation so that the collection will be cost-effective and consistent in referencing. The equipment for data collection can be divided into two main categories:
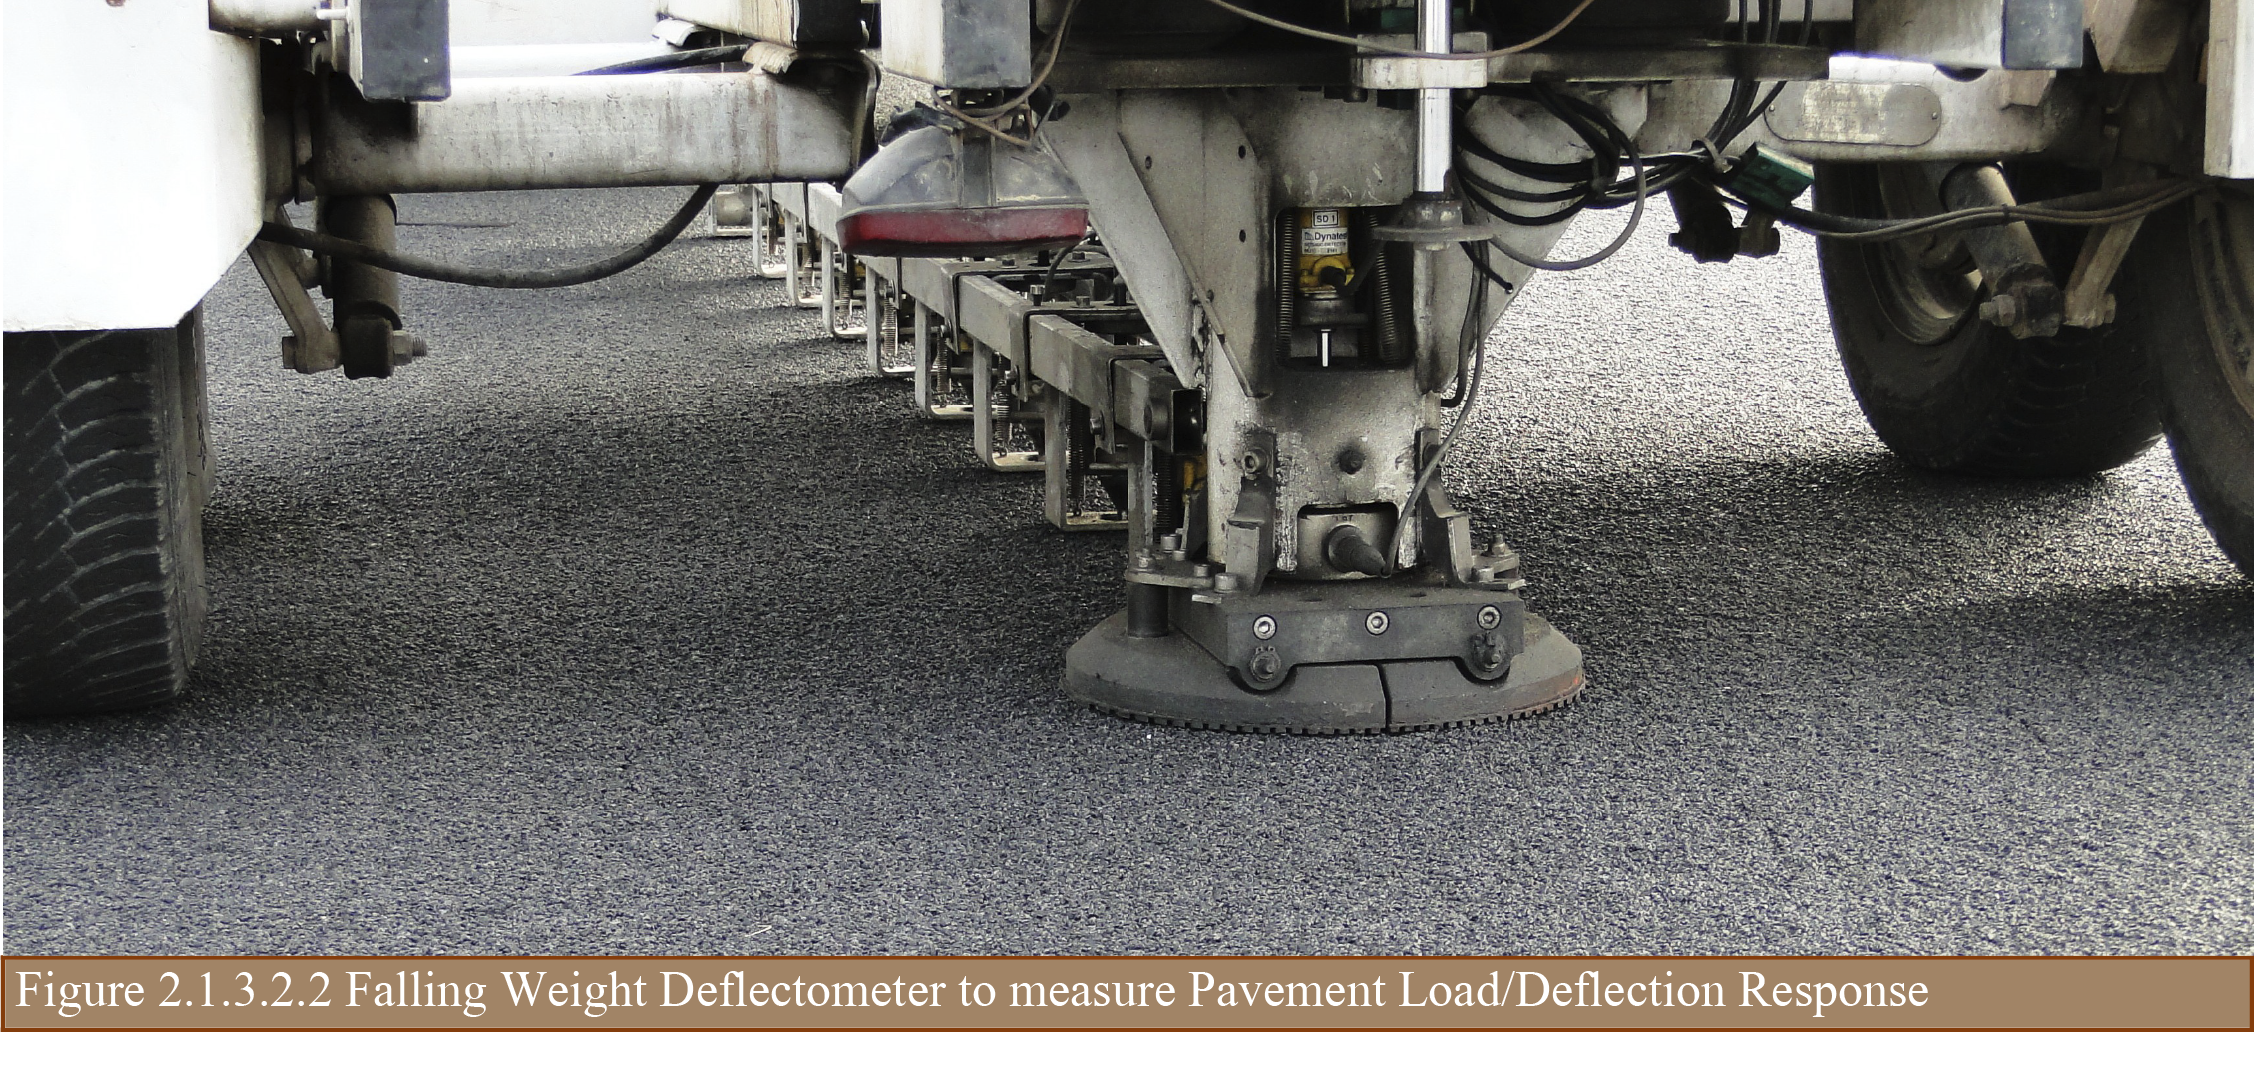
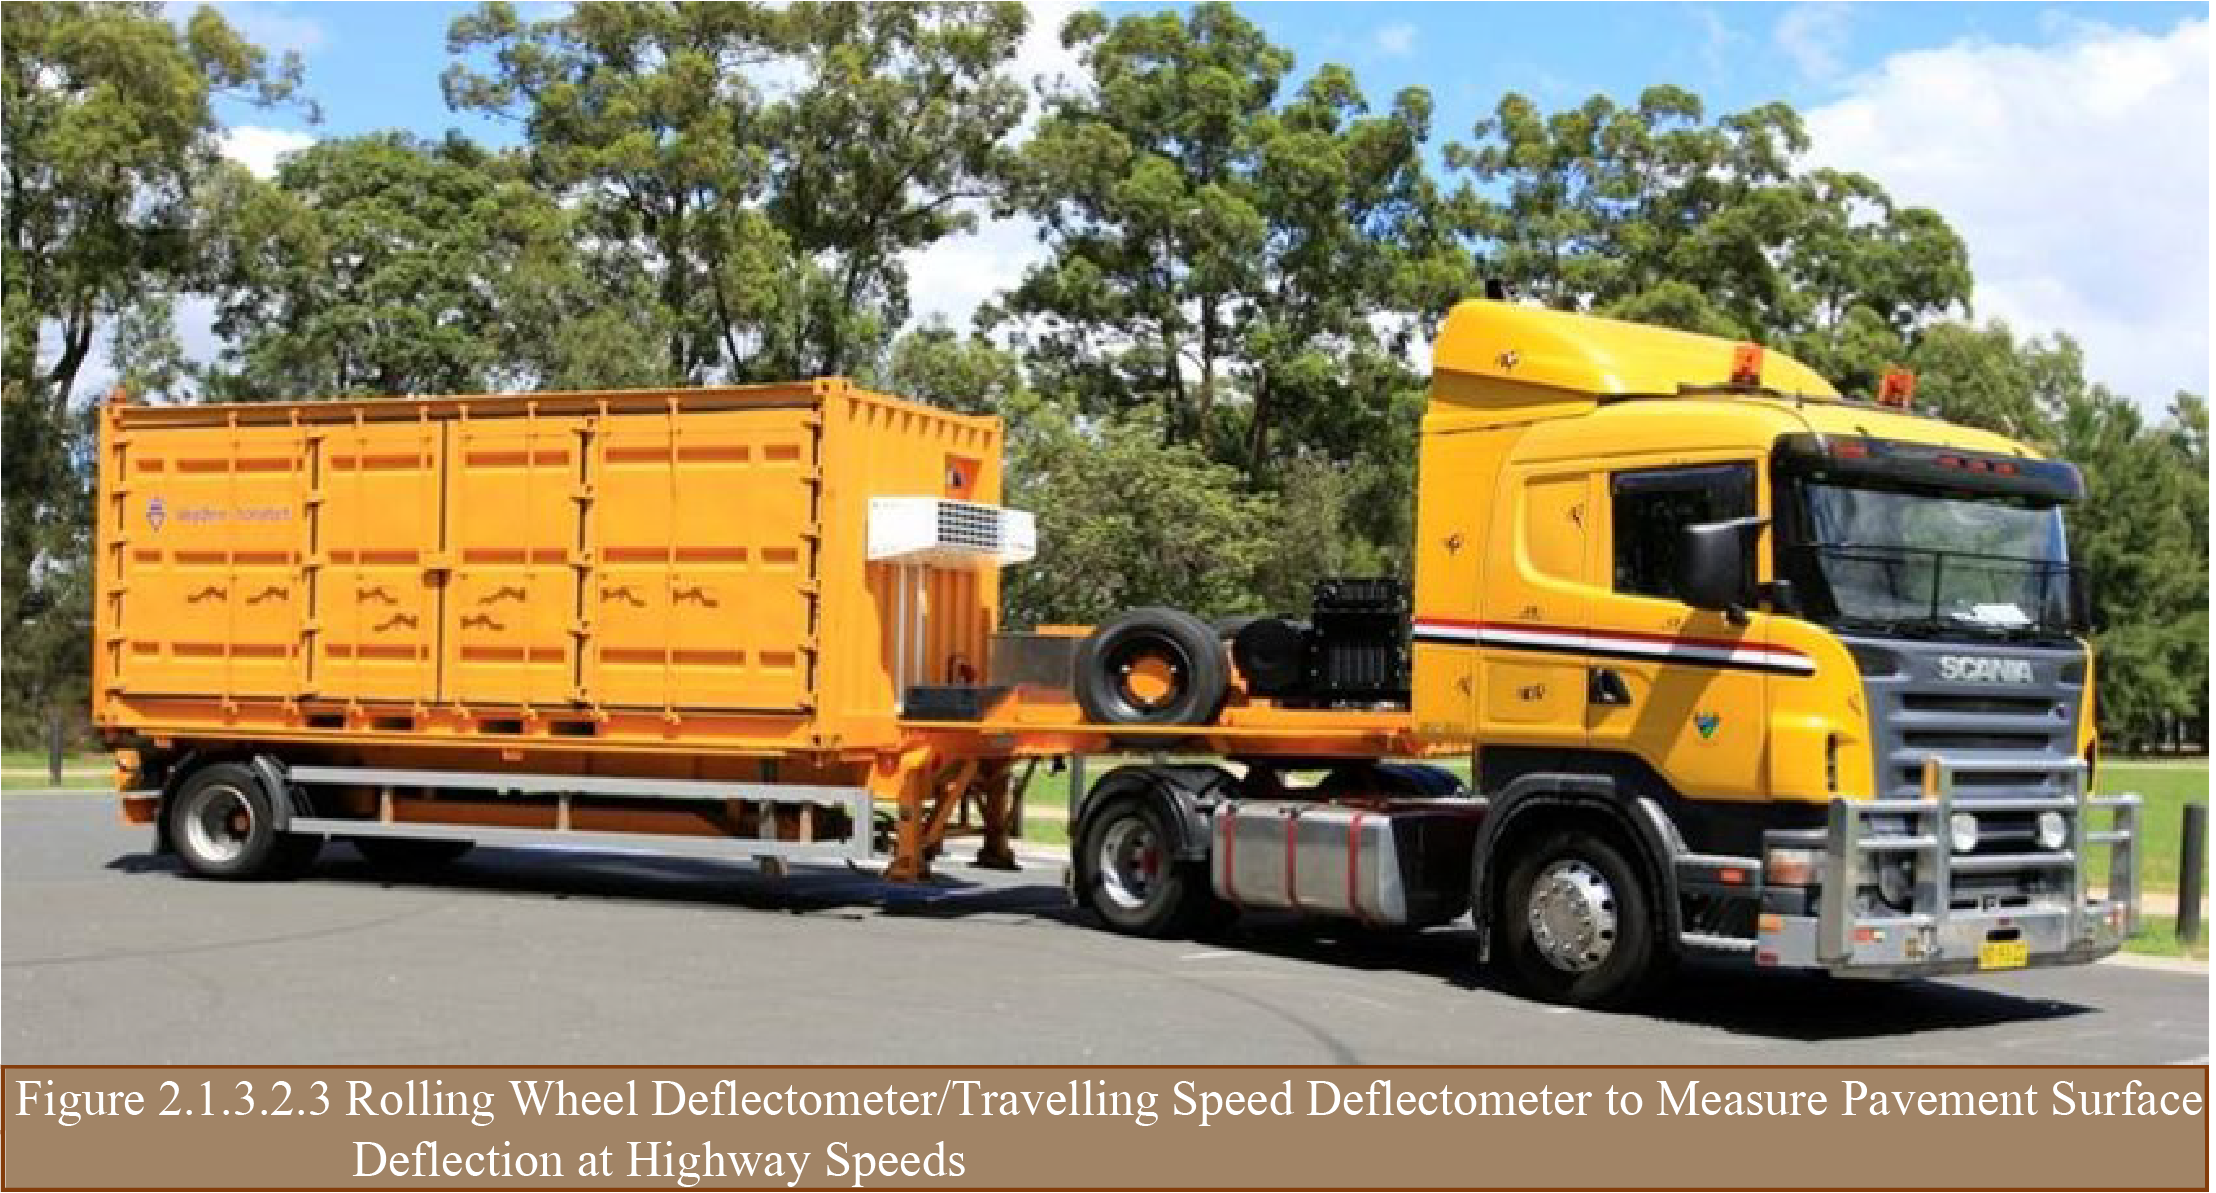
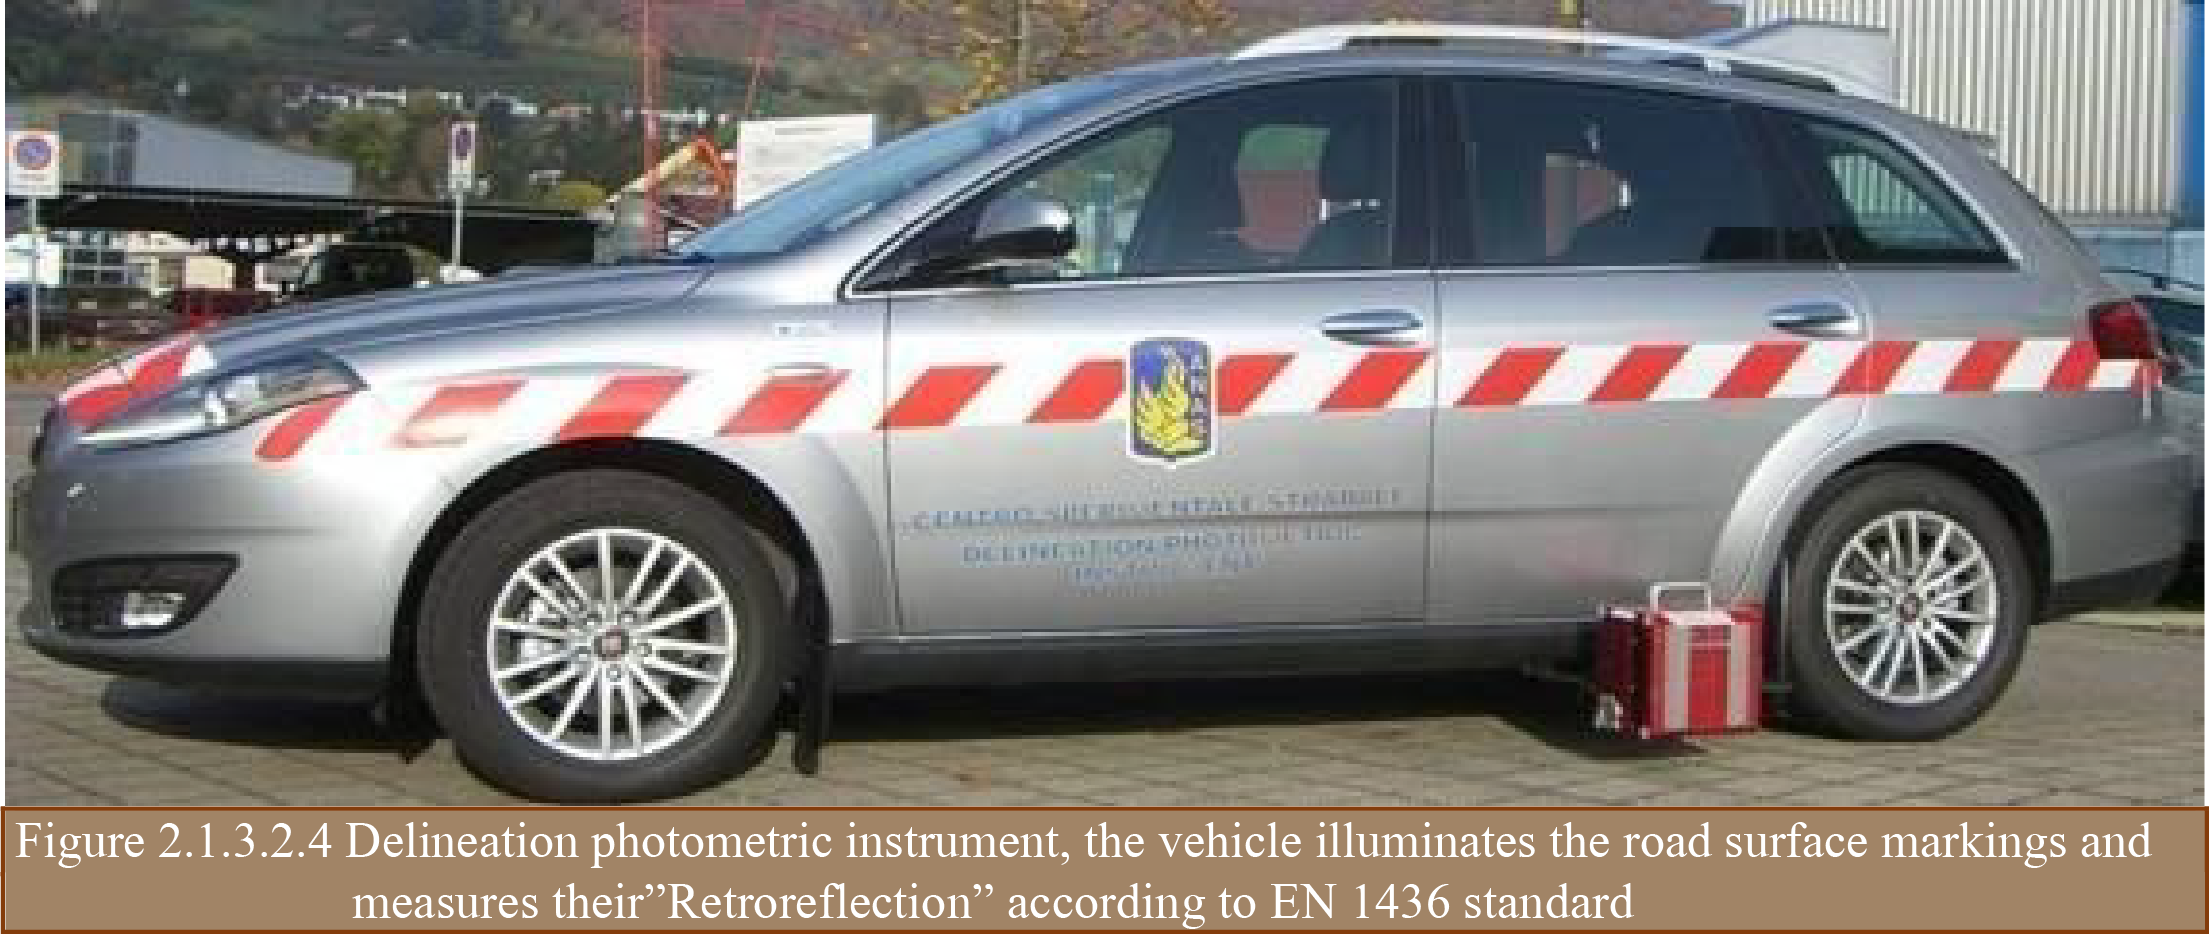
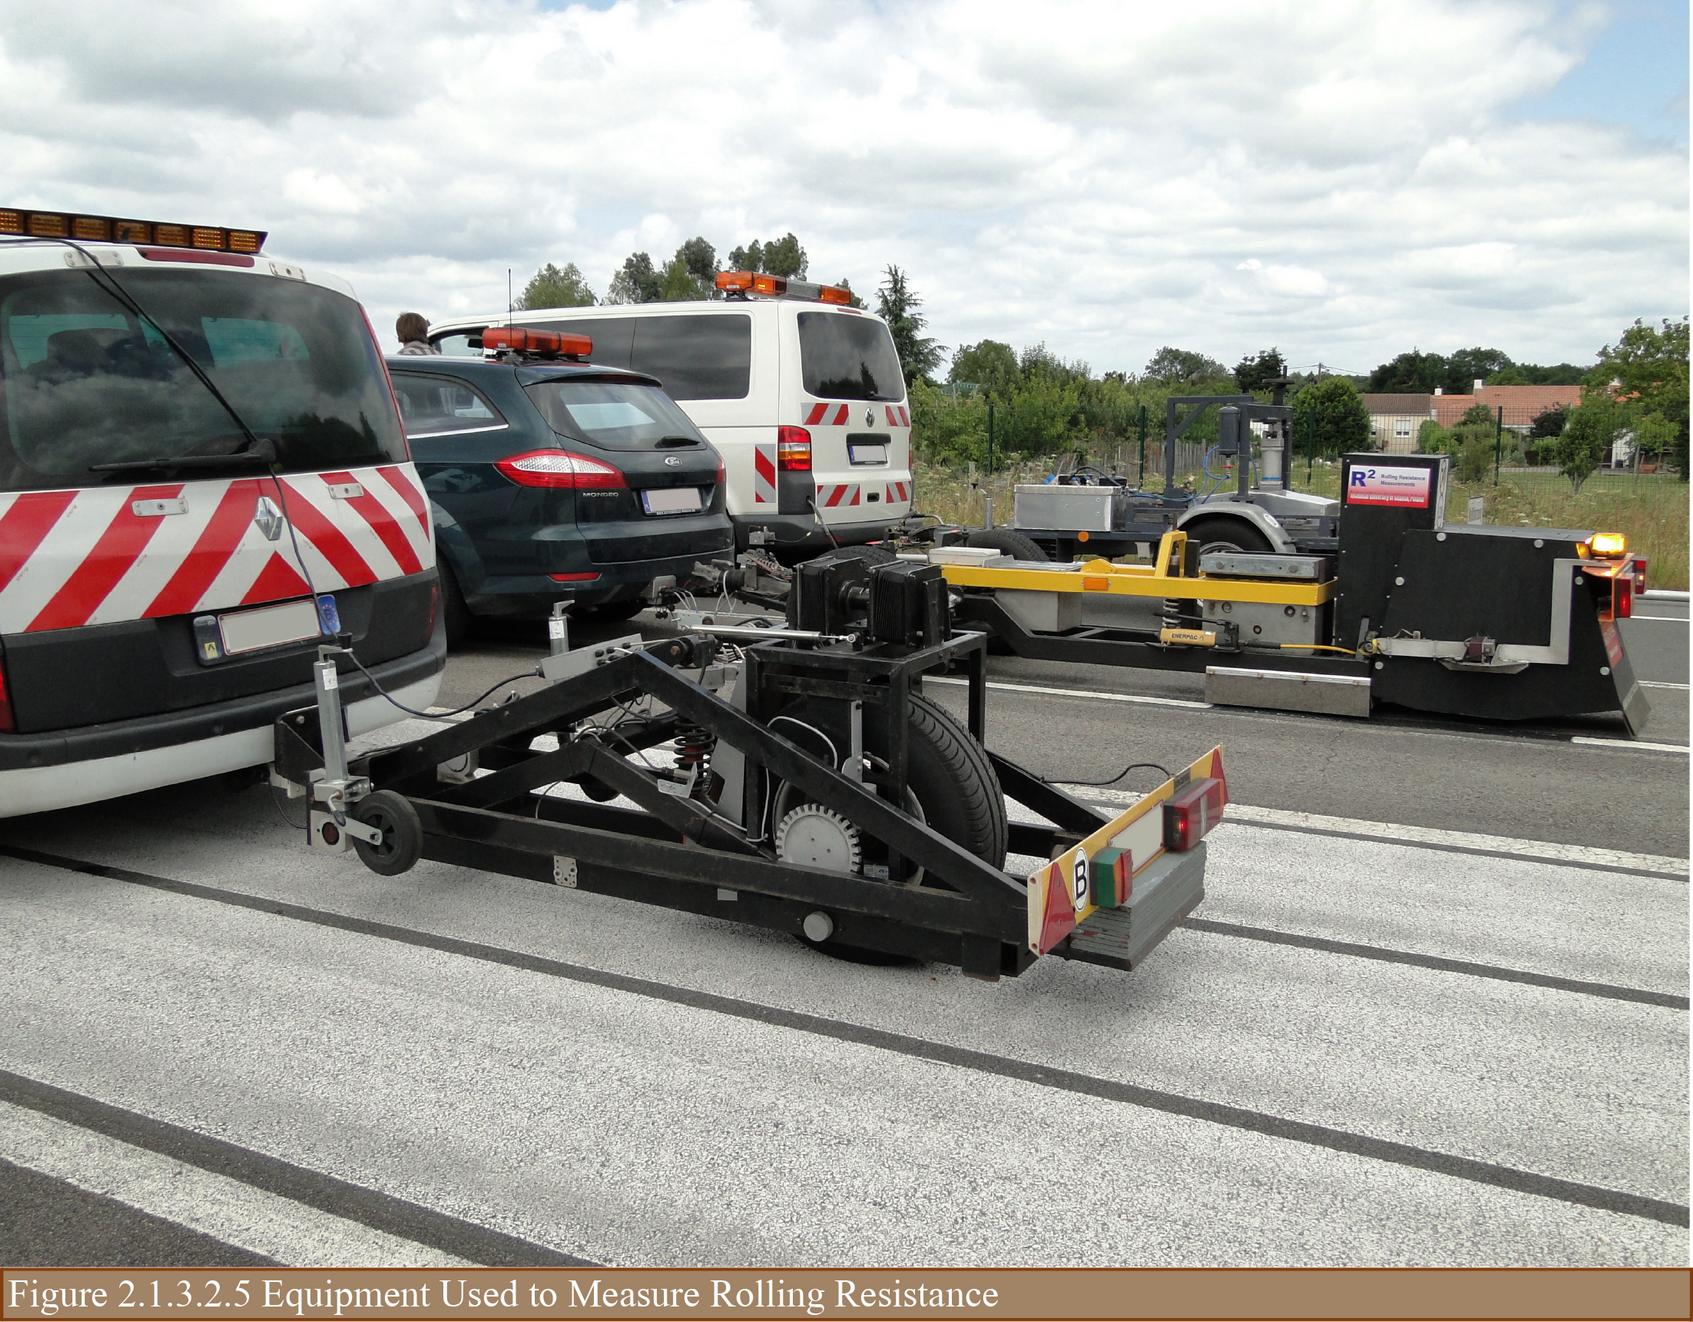
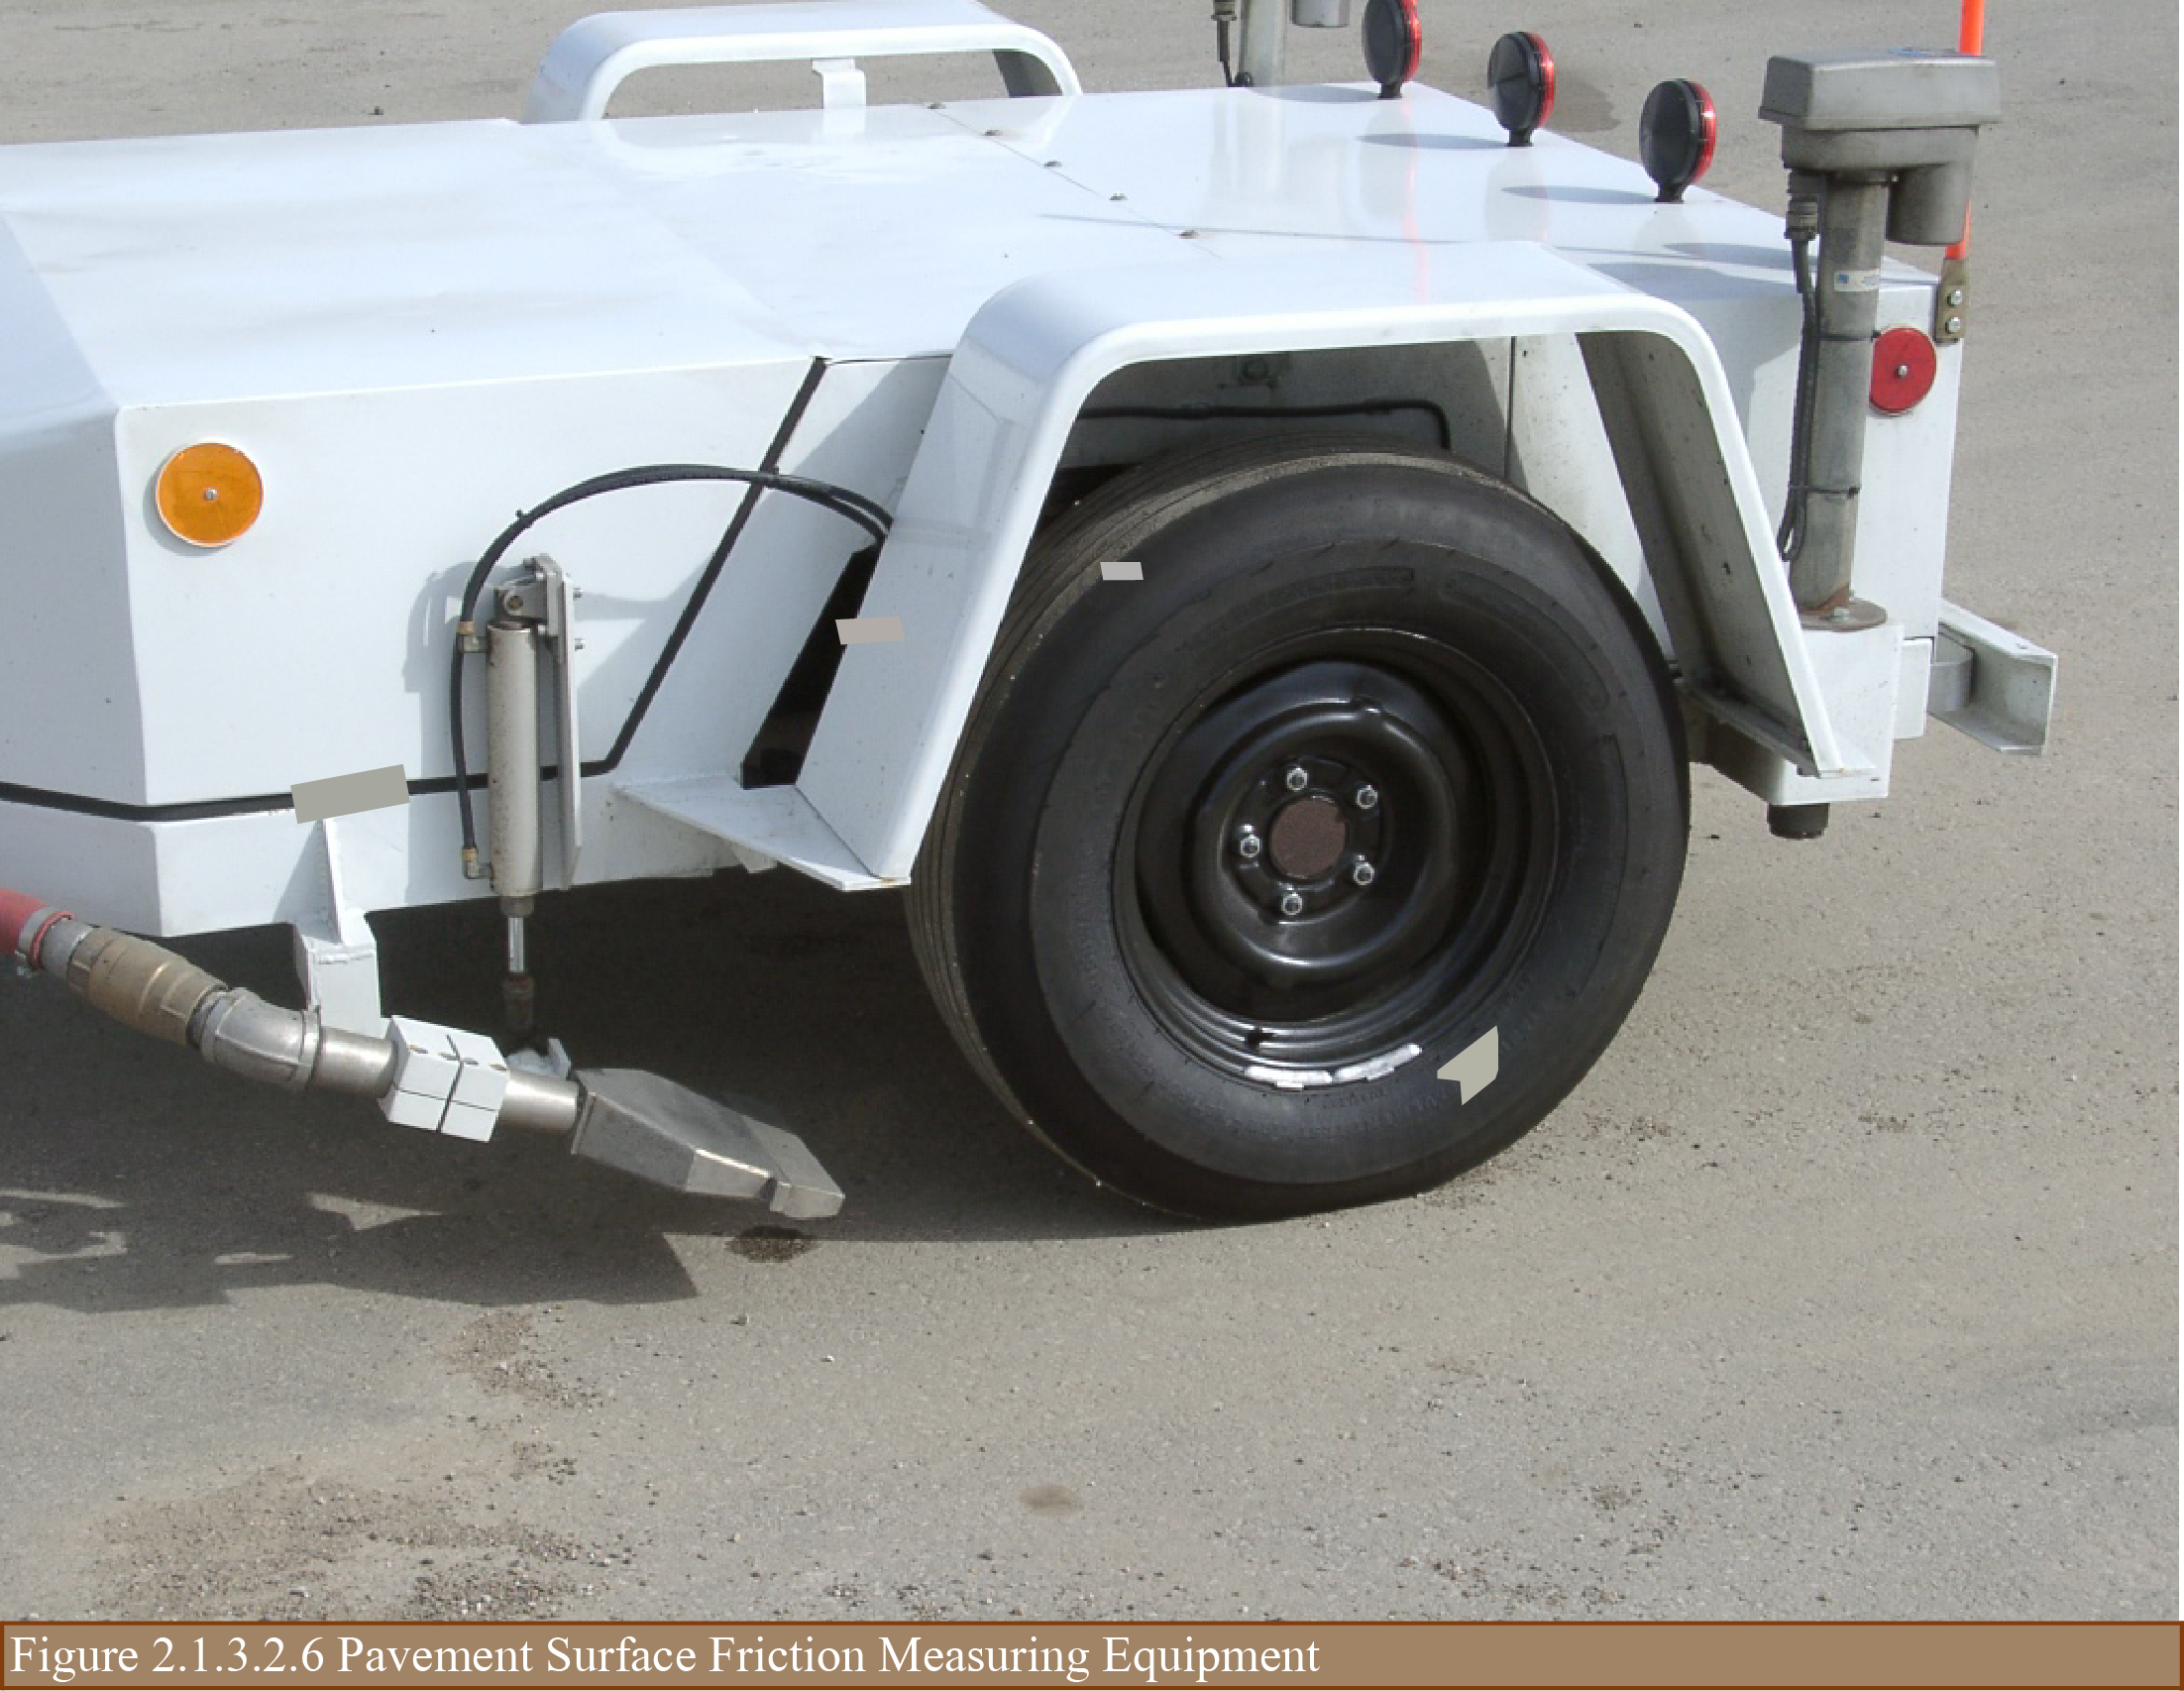
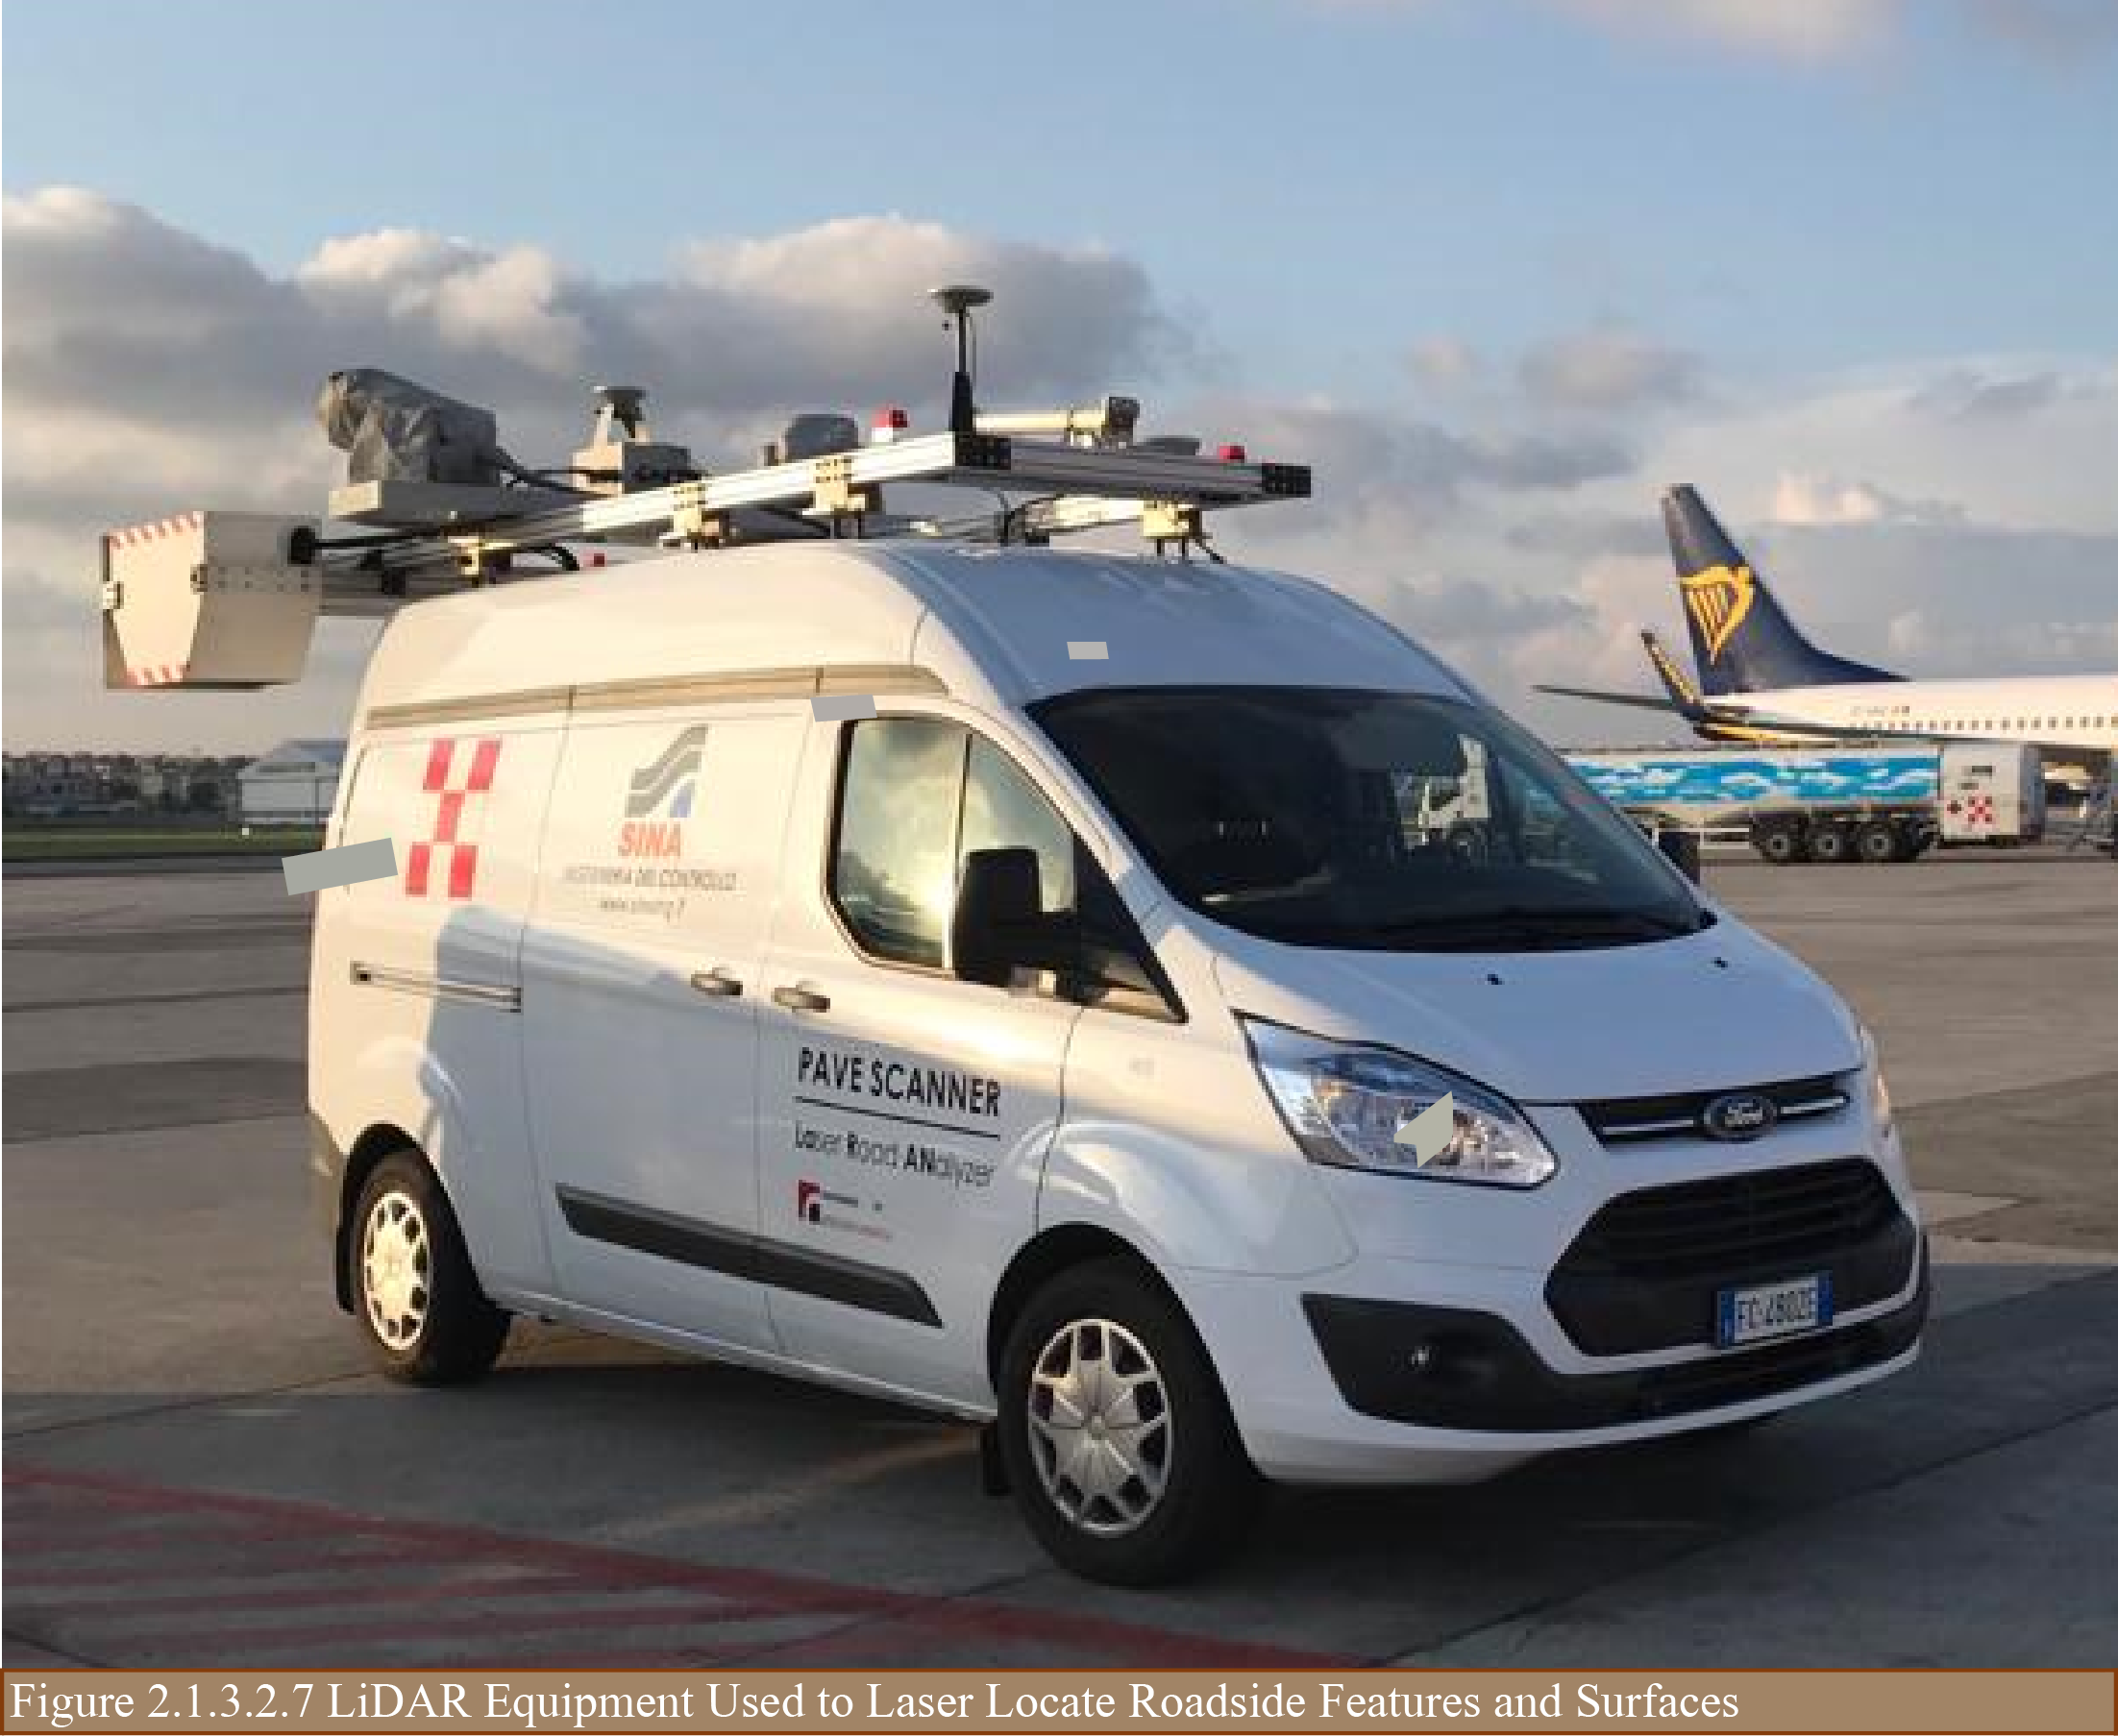
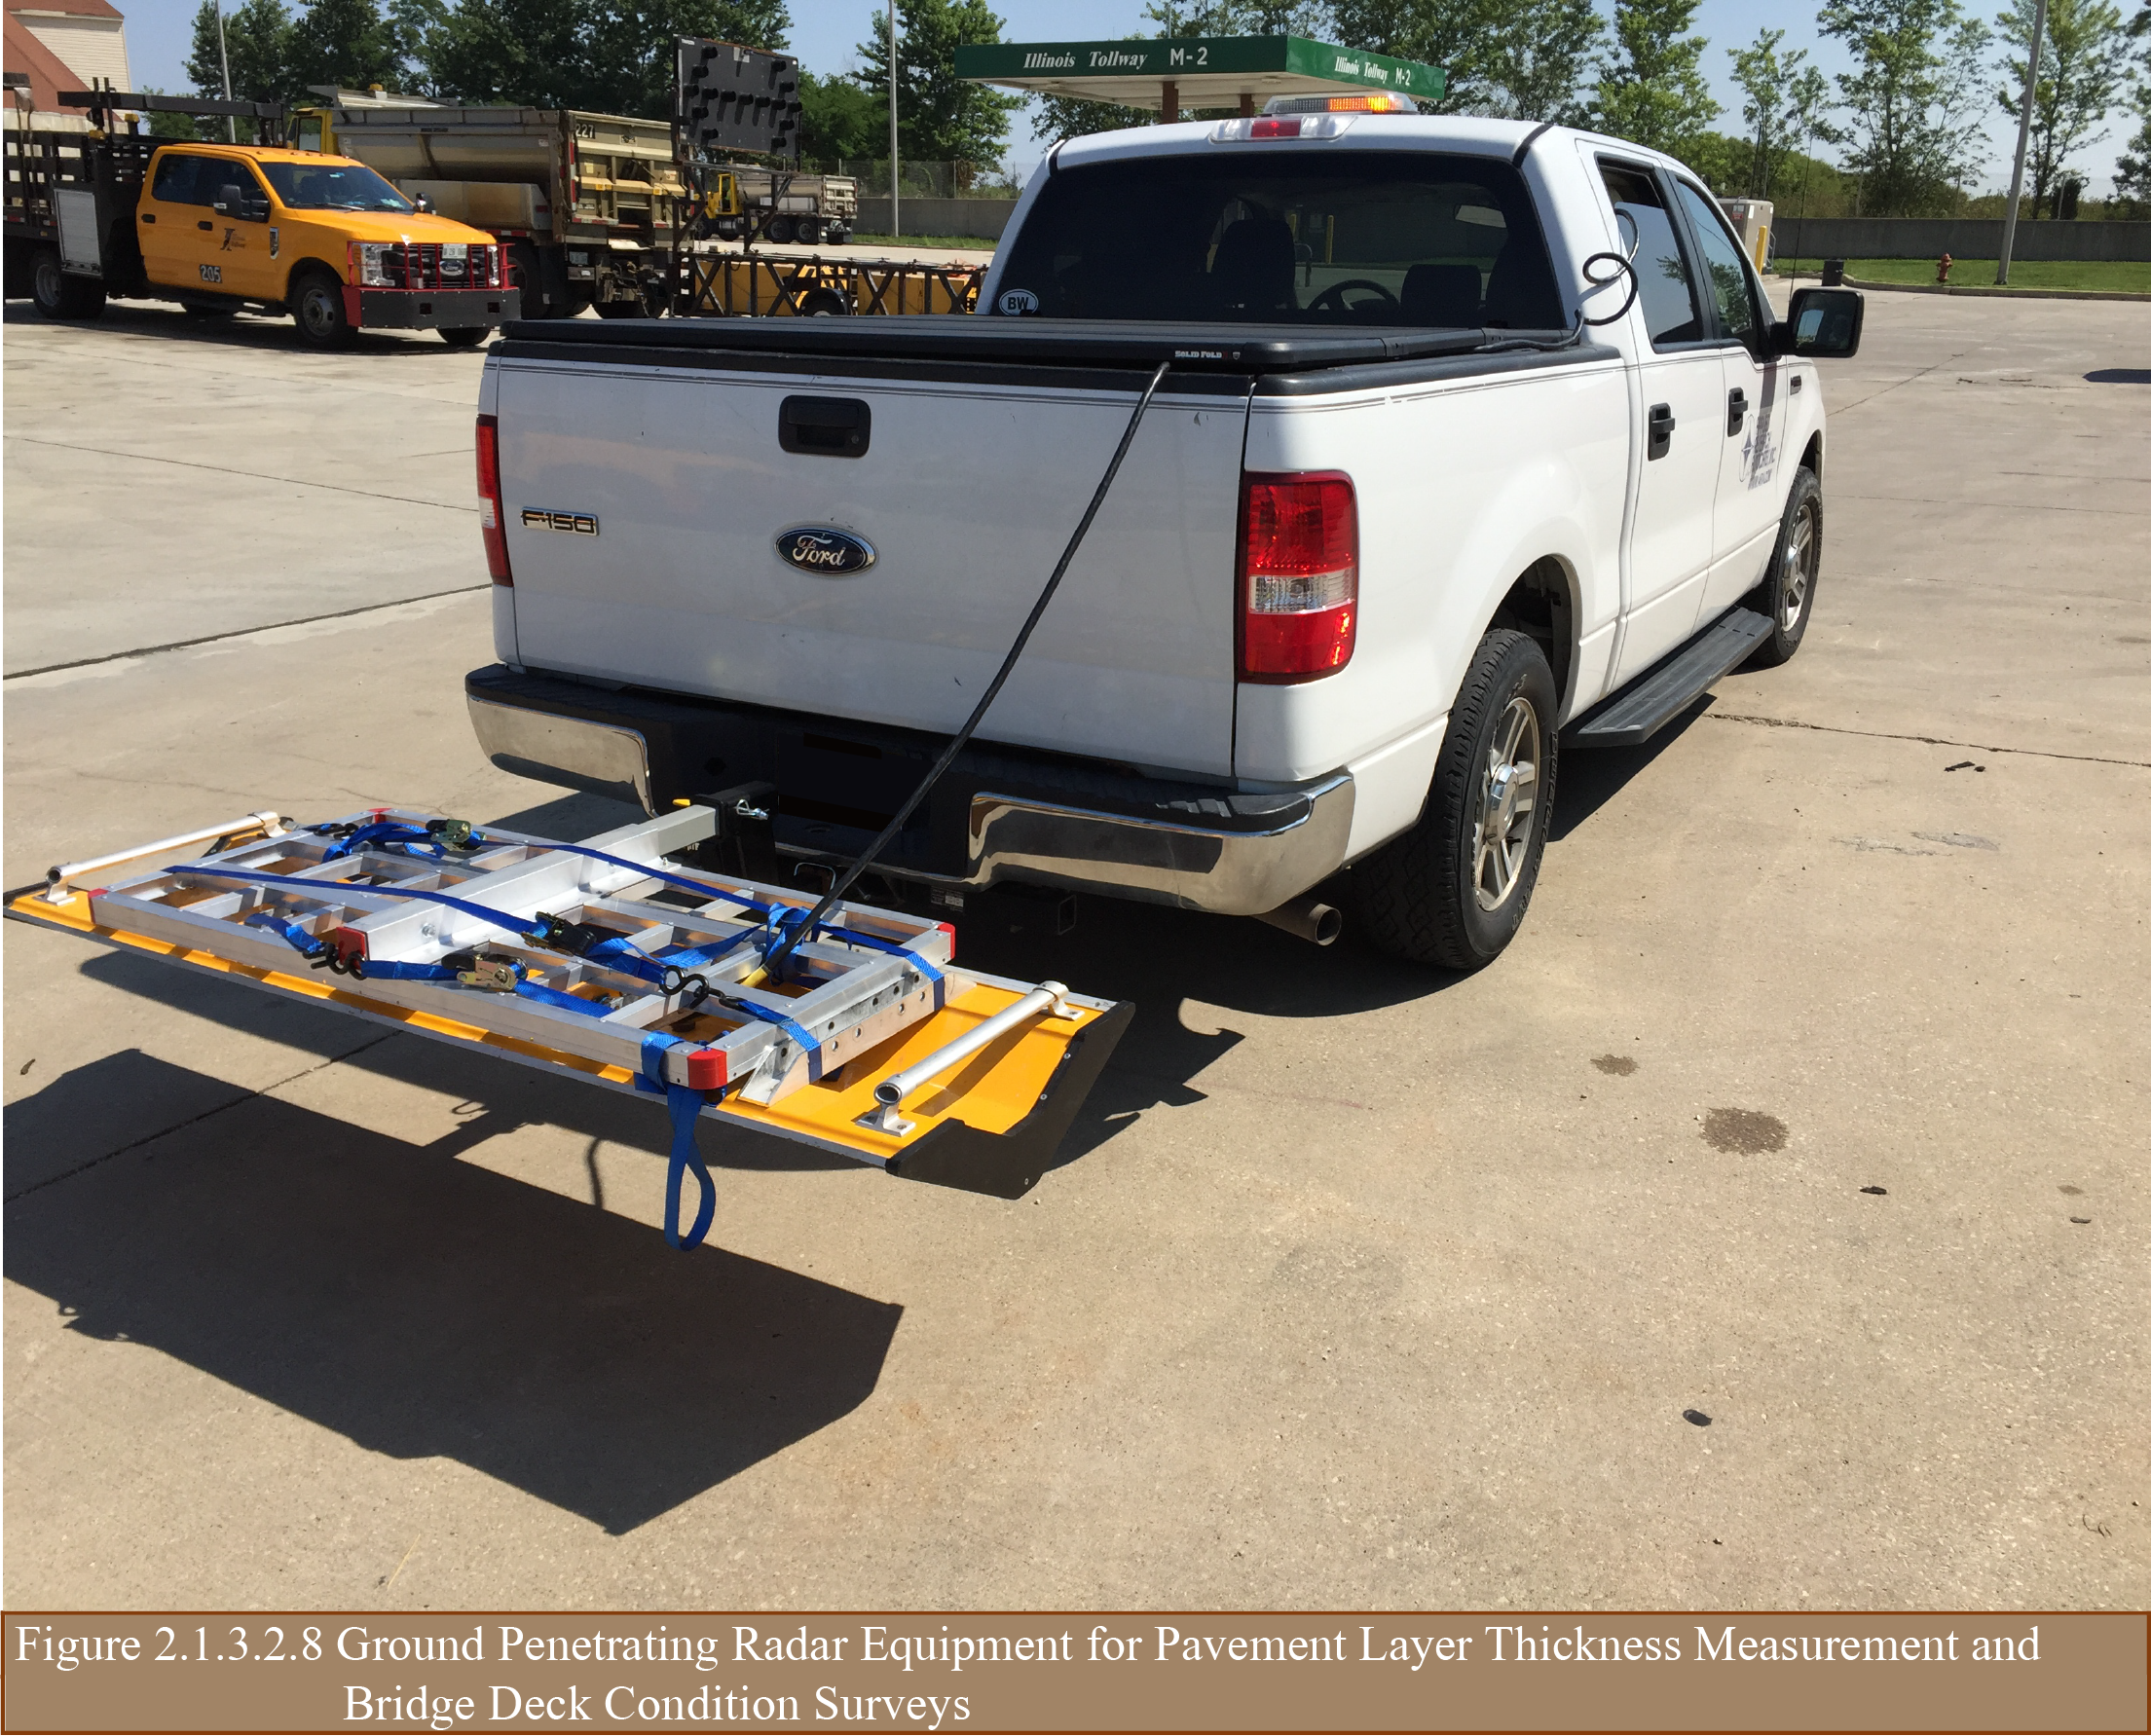
Various other types of technology for data collection are widely available, e.g., drones to inspect bridges, surface profilers, Falling Weight Deflectometers (FWD) for measuring the structural capacity of the pavement and to back-calculate pavement and subgrade layer properties, or continuous deflection measurement systems such as the Rolling Wheel Deflectometer (RWD), RWDVision and Travelling Speed Deflectometer (TSD), equipment to measure paint marking condition and retroreflectivity, rolling resistance, pavement surface friction, light detection and ranging (LiDAR) to map roadside equipment and features, ground penetrating radar (GPR) to determine pavement layer thicknesses and bridge surface condition and rolling resistance equipment. PIARC has recently completed a special report (PIARC 2018) on the use of unmanned aerial systems use for asset condition inspection and data collection.
Figures 2.1.3.2.1 through 2.1.3.2.9 show some examples of data collection equipment and systems.
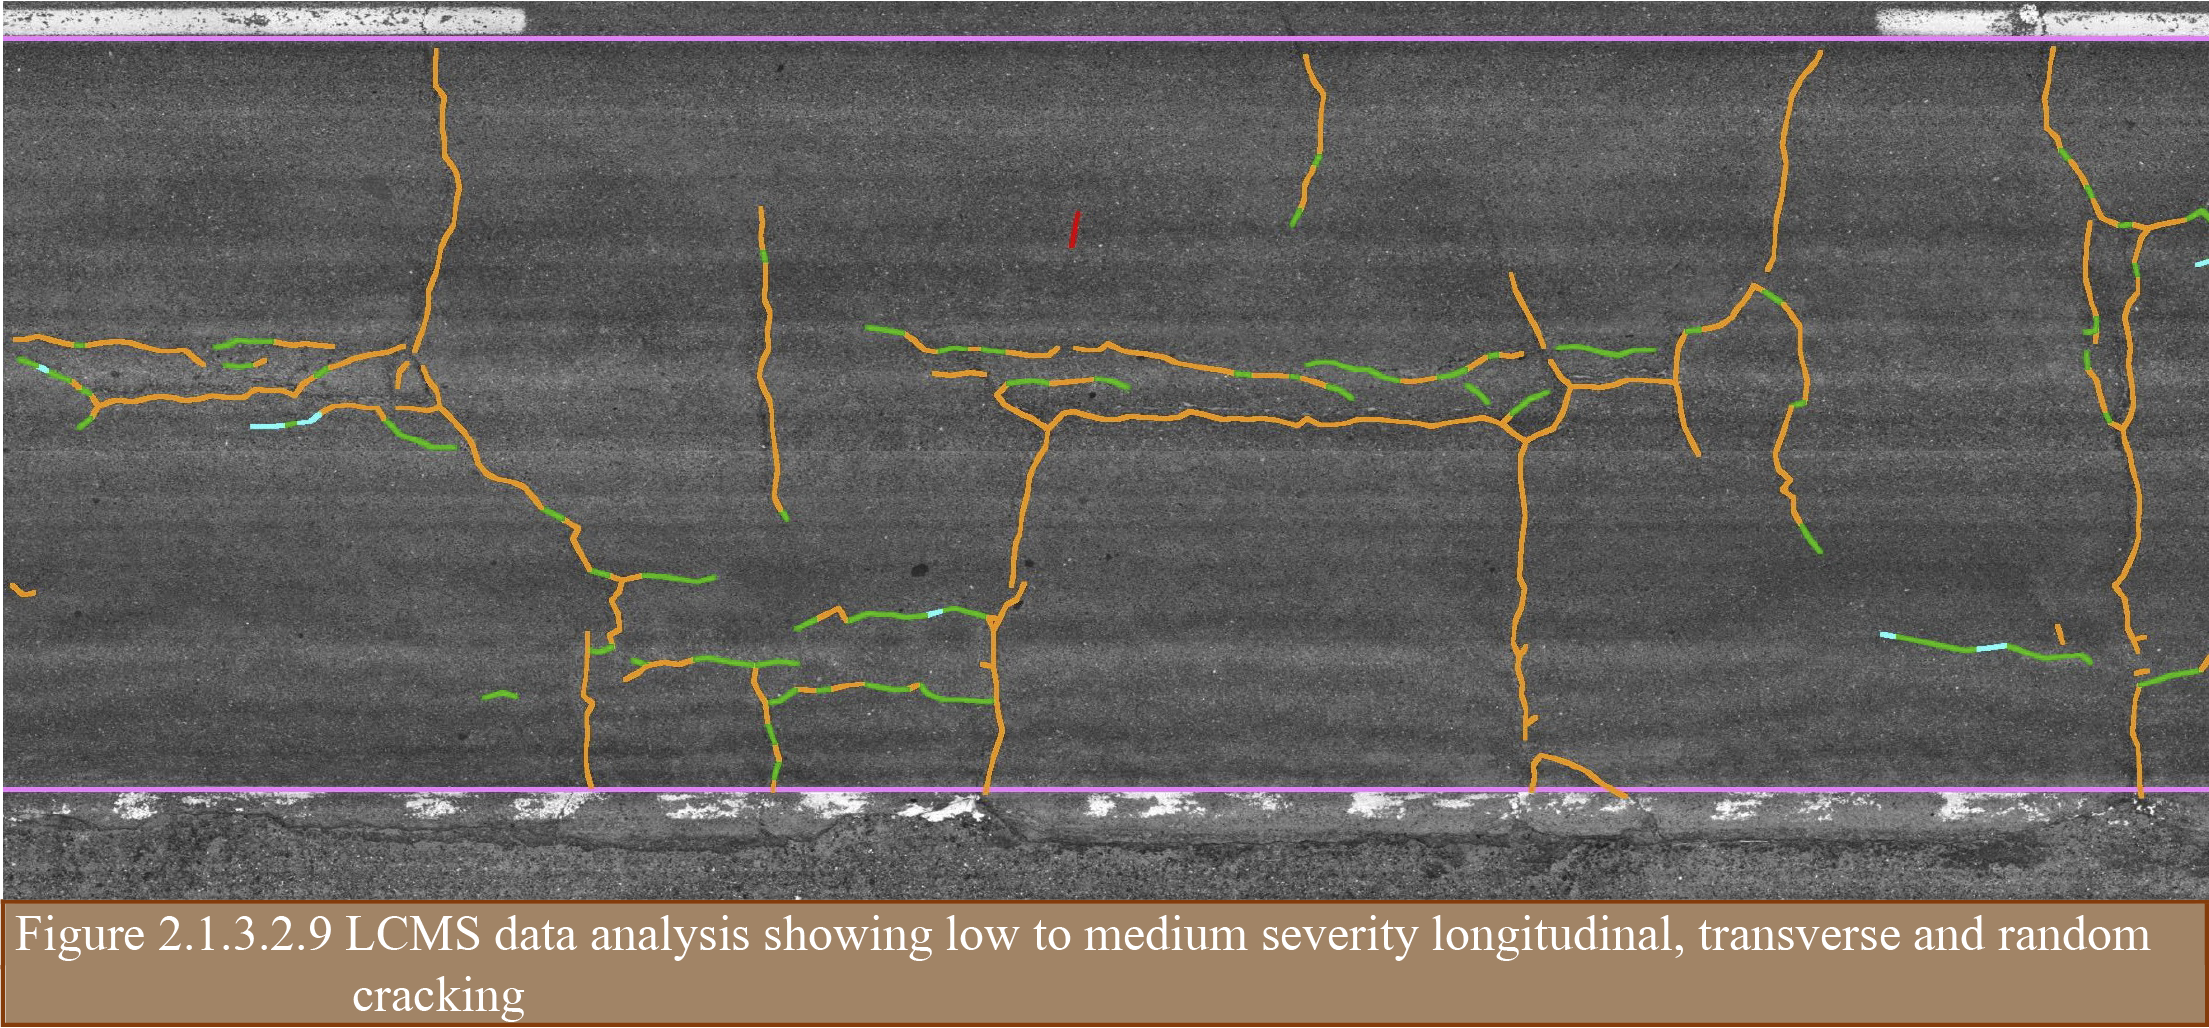
Recent additions to digital survey vehicles include the use of laser crack measurement systems (LCMS). The LCMS is a high-speed 3D laser scanning system that scans a pavement width of 4 m using 4,000 points, and provides a transverse accuracy of 1 mm and a vertical accuracy of 0.5 mm. e frequency is operator-configurable between 5,600 or 11,200 Hz. The resulting resolution and accuracy is 5 to 10 times that which is available from typical mobile LiDAR systems.
Additionally, the LCMS is capable of a fully automatic inspection of the pavement condition, and can measure the following key parameters:
An example of the LCMS crack detection output for an asphalt pavement surface is shown in Figure 2.1.3.2.9.
Bridges are different from other asset classes because they have many features, all of which significantly impact safety, performance, and management costs. Therefore, bridge data is often extensive and complex. The data that supports assessment of safety, performance, and cost include bridge condition data and bridge inventory data such as bridge type and material, service and usage, geometry, load capacity, and potential work needs and costs. Bridge inventory and condition data is collected to support management of individual bridges as well as management of the roadway network.
With respect to condition data, there are different systems of inspection and data collection. One system can be termed general condition rating assessment. Following this system, the major components of a bridge are each independently assessed for condition. Major components include the deck, superstructure, and substructure. Each component is assigned a single numeric value representative of the overall condition of the component. An example of a general condition rating numeric scale is shown in Table 2.1.3.1.4.
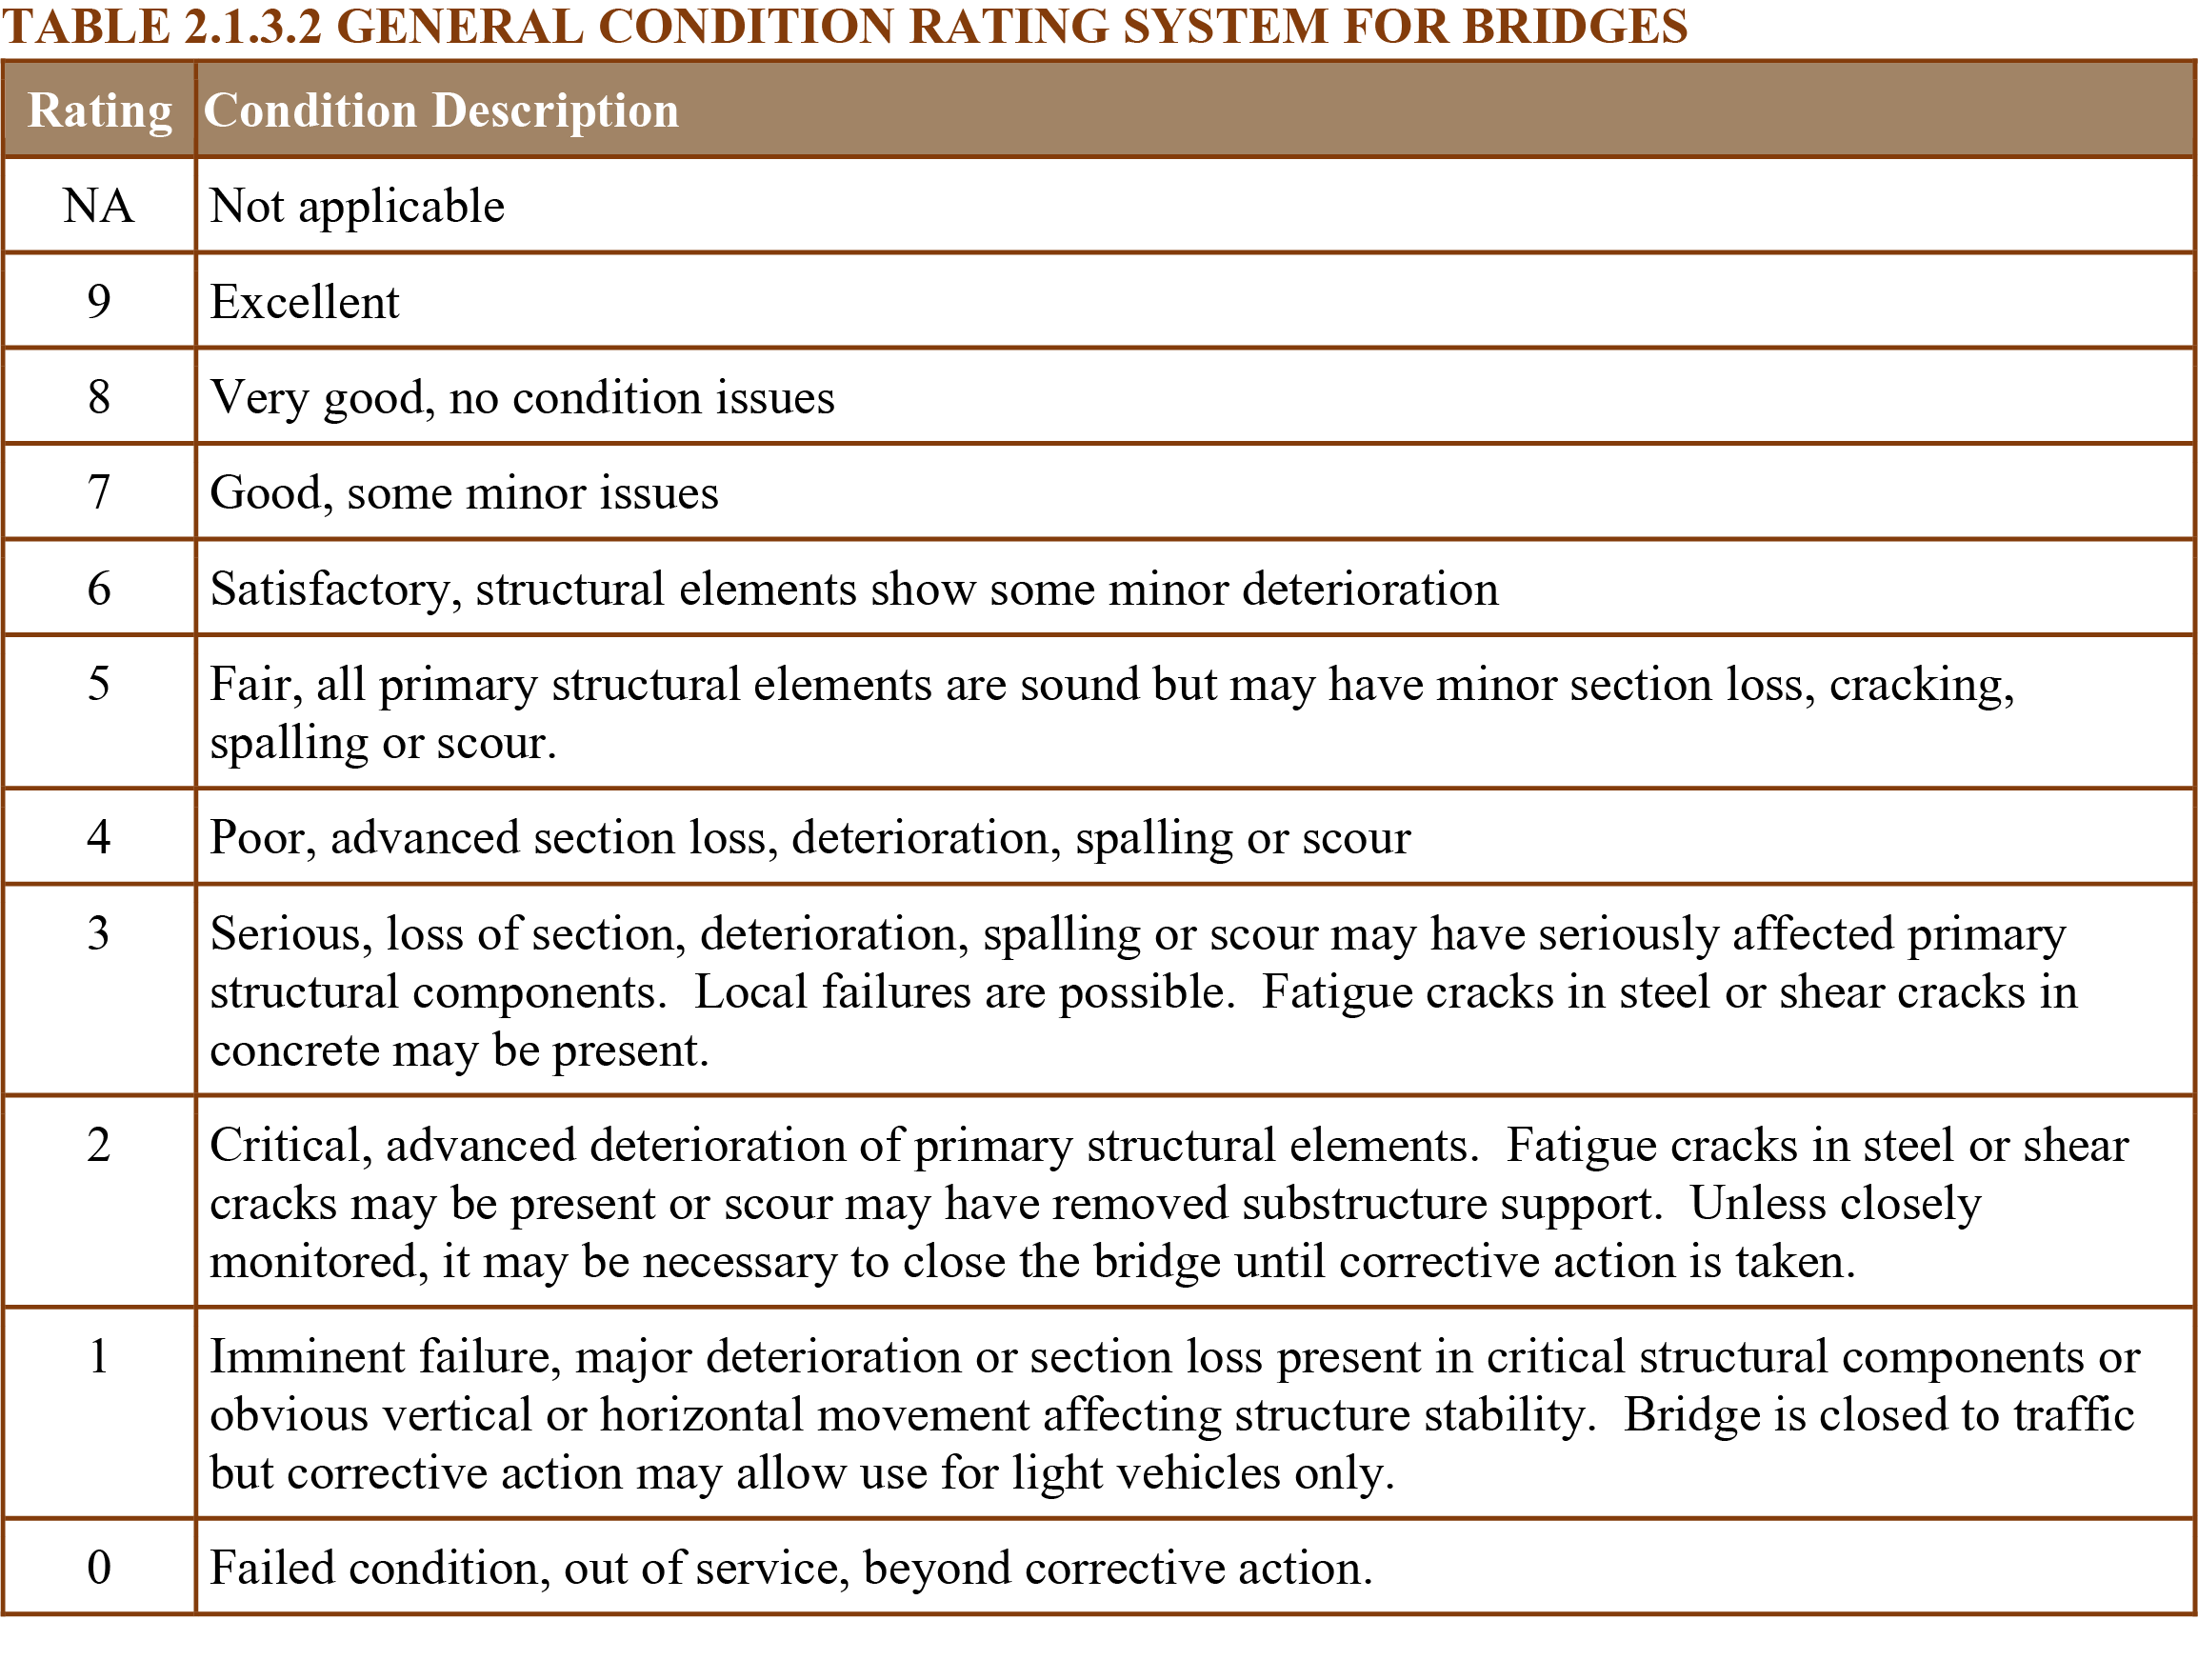
Bridge owners use the general condition ratings to assess the overall condition of bridges and support basic bridge management activities such as identifying high level bridge needs, establishing performance measures, and establishing intervals between inspections.
Another system of condition inspection and data collection is termed element condition assessment. This system subdivides the components into elements that are more granular than components, and it quantifies the type, severity, and extent of defects that are present. First, the unique elements of a bridge for which condition data can be collected are identified. Then the amount of each element is quantified with respect to its size (area or length) or number of elements. During each inspection, the condition of each element is evaluated and the total quantity is distributed among several condition states depending on the type and severity of defects. The use of four condition states is common where condition state number one represents a like-new condition and condition state number four represents a severe condition that warrants structural review, repair, or replacement. This system is also valuable because it identifies the condition of features that are vital to protecting the bridge and preventing deterioration such as protective deck overlays, deck joints, coatings, and erosion protection. The condition of these elements significantly affect bridge service life and life-cycle cost to manage bridges. Bridge owners can use the element condition data for advanced bridge management activities such as accurate identification of bridge maintenance, preservation, and repair needs and associated costs, detailed performance measures that focus on specific bridge features (for example protective systems that extend service life), and asset valuation computations.
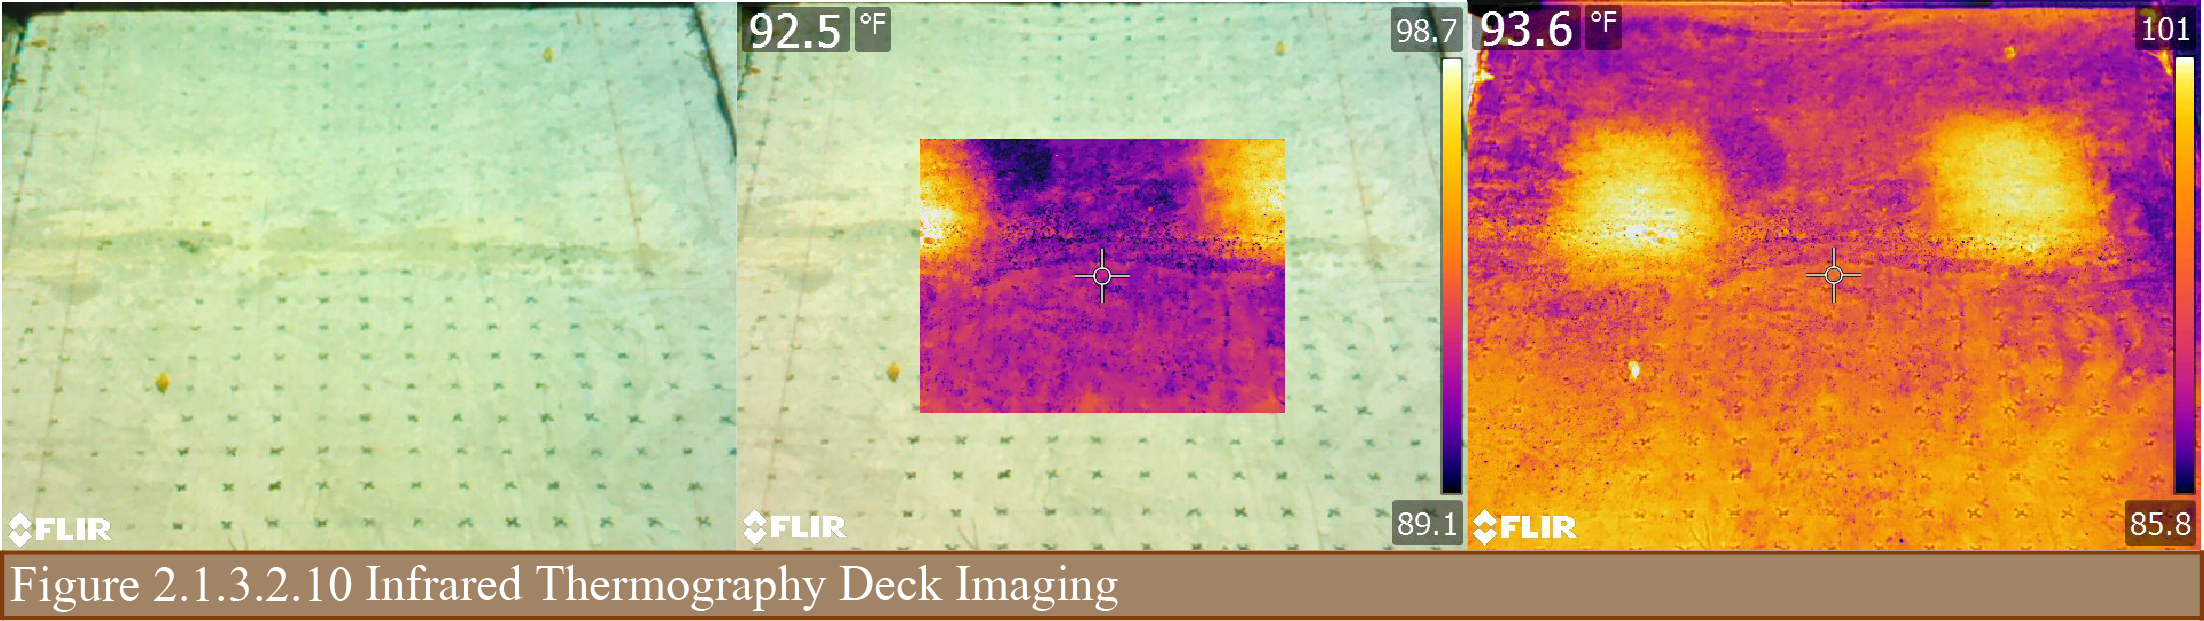
Condition data for bridges is normally collected by visual means supplemented by simple hand held devices including sounding tools (hammers) to determine material integrity, dimensional measurement tools (rulers, calipers, etc.) to determine corroded steel remaining thickness, crack dimensions, displacements, etc., and waterway probing sticks to determine integrity of soil foundation material. Advanced tools may be used to investigate known problems and vulnerabilities, or to provide more accurate assessment of phenomenon and deficiencies that are difficult to detect visually. For example, bridge decks are normally difficult to assess without interrupting traffic, and are commonly composed of reinforced concrete, a material type whose defects may not be detected by visual means. Some owners are using vehicle mounted infrared thermography or ground penetrating radar to assess bridge deck condition. This data collection can proceed at normal roadway travel speeds and produce sufficient data to identify early prevention treatment needs, determine the most cost effective work action for decks (preservation, rehabilitation, or replacement), or assist in future planning and budgeting.
Infrared thermography assessment measures temperature variations across the surface of an object. Radiated temperature variations result from differences in thermal conductivity, specific heat capacity, and mass density (Figure 2.1.3.2.10). When solar radiation heats up a bridge deck, the absorbed energy is gradually emitted. Delamination, voids, and other anomalies have different properties than the surrounding concrete and will emit different radiation. Infrared thermography performs well identifying locations of horizontal cracking or voids. The two predominant modes of bridge deck deterioration result in horizontal cracking or planar voids. Corrosion of multiple and adjacent bridge deck reinforcing steel bars results in delamination which is horizontal planar cracking induced by steel volume increase from corrosion. Bridge deck rigid overlay deterioration often starts as debonding from the deck substrate which appears as horizontal voids. Infrared thermography surveys are conducted using infrared cameras in combination with conventional video imaging. A manual review of the images is then performed to estimate location, magnitude, and severity of deterioration which shows up as locations of greater emittance.
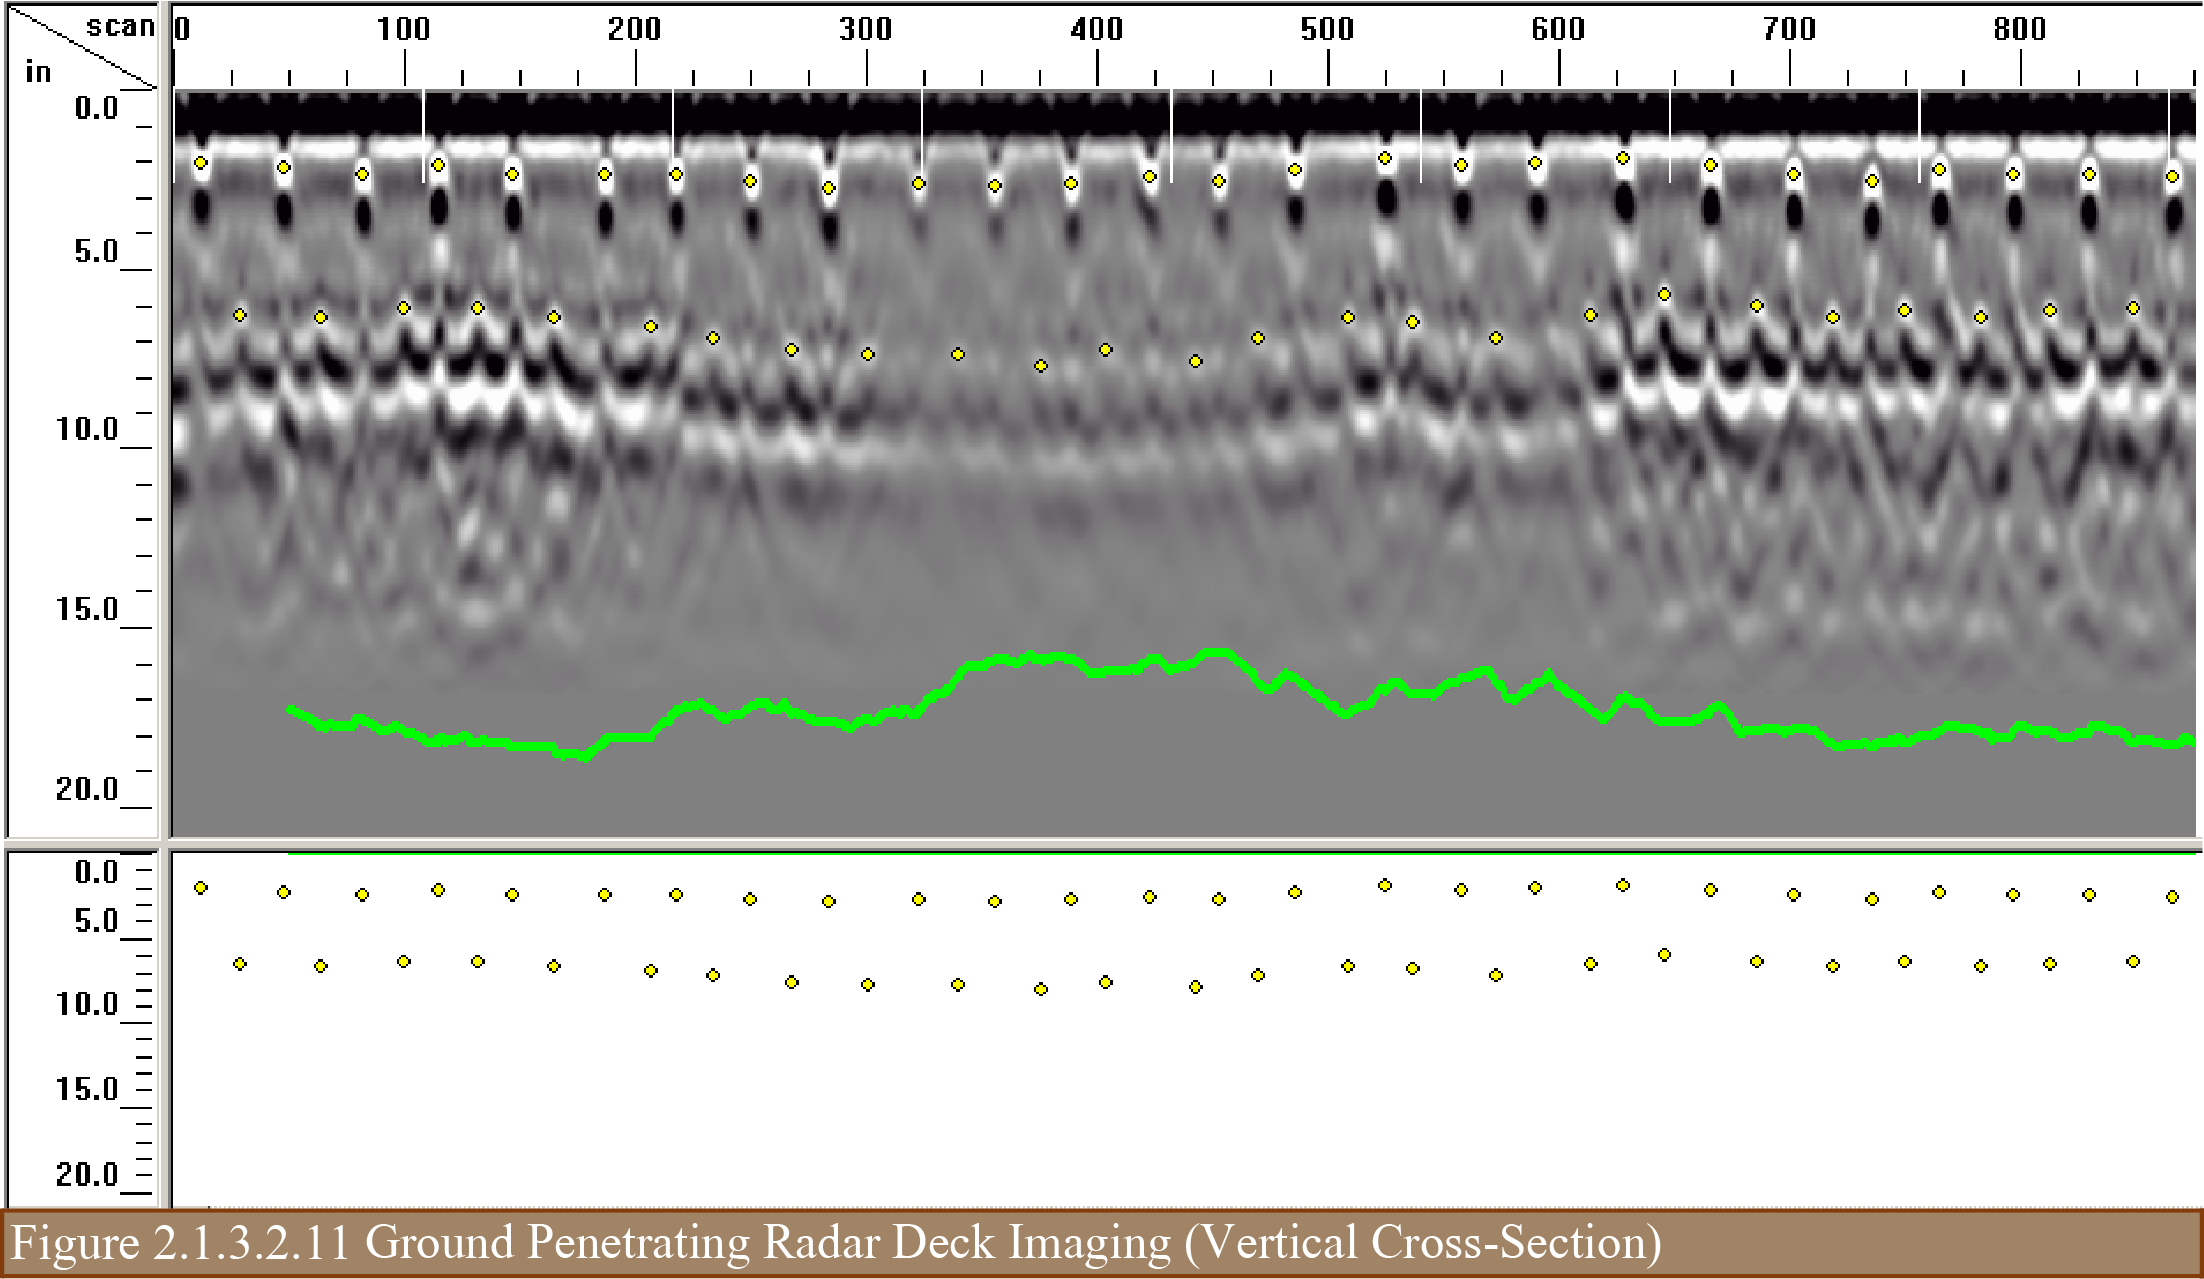
Assessment by ground penetrating radar involves transmitting electromagnetic waves and measuring the reflections (Figure 2.1.3.2.11). The amplitude, frequency, and properties of the reflected waves are dependent on the material properties. A portion of the energy is reflected from material differences, interfaces, and discontinuities. The deck surface, reinforcing steel surface, and large voids are the predominant reflectors. Ground penetrating radar does not perform as well as infrared thermography at identifying deck delamination and overlay debonding, but it performs well mapping reinforcing steel depth and assessing the potential for concrete deterioration and delamination. The attenuation of the signal at the level of reinforcing steel is normally used to represent the condition of the deck. When an antenna is centered directly above the steel, the highest amplitude return is obtained. This amplitude will be highest when the location is in good condition and lowest when corrosion and delamination is present. The technology requires specialized expertise for data collection and post processing for correct interpretation of results. Similar to infrared thermography, the data can be used to estimate location, magnitude, and severity of deterioration.
It is important to ensure the quality of data during its collection. Quality control and assurance is important during all stages and processes including pre-survey calibration, during the survey, validation, daily checks, continuous monitoring of equipment and results, correct processing, and the storing and securing of data.
A detailed quality management plan (QMP) should be prepared for the data collection. The QMP is expected to ensure that the acquisition of the required data meets the road organization’s needs and specifications. The QMP has to address, among other considerations, the following issues:
Condition indices describe a set of discrete, ordered states determining the rating of asset condition parameters. Trained condition rating personnel may assess the current state of the asset and assign a rating to that asset. However, the subjective rating can vary by rater.
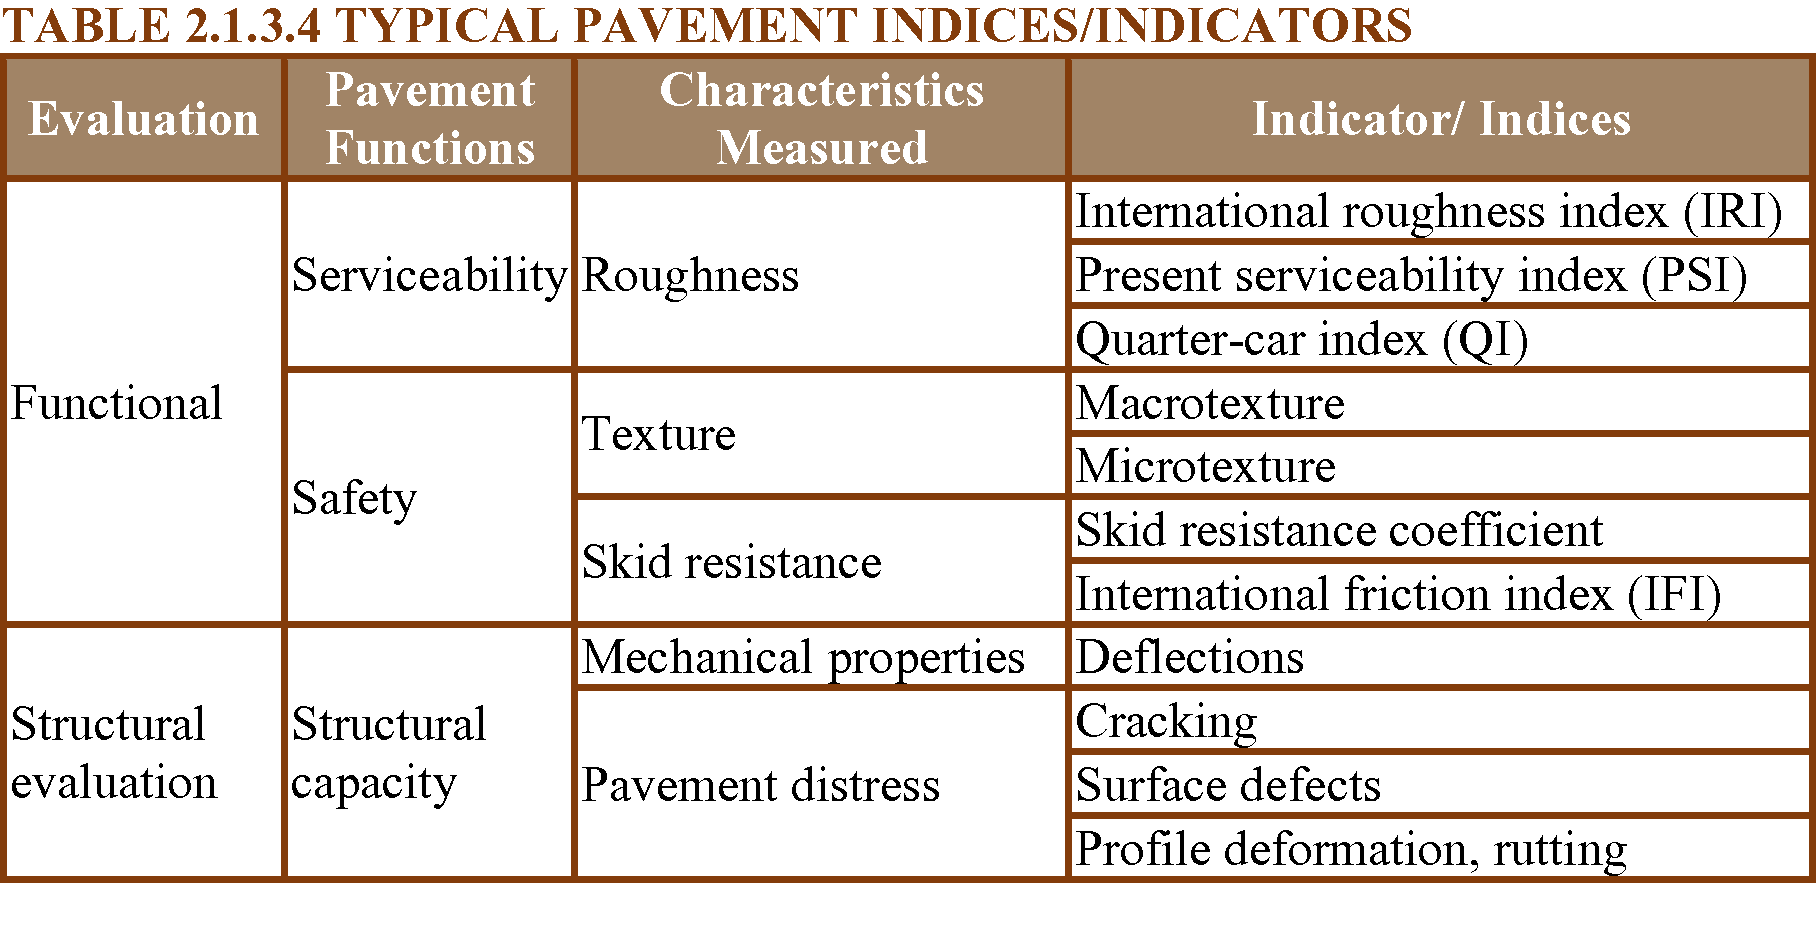
The pavement conditions normally evaluated for asset management are as follows:
The above characteristics are measured in the field by acceptable equipment and methodologies and are quantified by means of indicators or condition indices. Typical pavement condition indicators and indices are shown in Table 2.1.3.4.
Bridge condition indices are typically represented by condition states of individual elements that are then combined in to component rating, e.g. deck rating and then an overall bridge condition index (BCI).