
The asset management strategy should be a clear and concise high level document setting out how road infrastructure asset management is delivered for the road organization, to meet its long-term corporate goals and objectives.
The following chapter focuses on the explaining what is an asset management strategy, the reasons for a road organization having one; which objectives this strategy should comply, and what aspects should be covered. It also provides information regarding the maturity levels applied for an organization demonstrating asset management strategy principles.
The asset management strategy should be a clear and concise high level document setting out how road infrastructure asset management is delivered for the road organization to meet its long-term corporate goals and objectives.
The development of an asset management strategy is one of the key components in the asset management framework. The key objective of the asset management strategy is to provide direction to the management and maintenance (PIARC 2013) of the road assets by providing a line of sight between the organizational goals and its asset management activities and ensuring that the required results are achieved.
The asset management strategy (PIARC 2014) sets out what the long-term objectives of the organization are for managing its road infrastructure assets. It should also describe how they are met. The organization’s long-term objectives should include meeting its legal obligations, managing the requirements of road users, meeting the demands from central government and the organization itself, as well as summarizing the overall requirements for the performance of road infrastructure within the context of any constraints, such as funding.
The asset management strategy sets a clear direction for the implementation of asset management and provides a link with other relevant transportation and funding strategies (PIARC 2016), including those of donor agencies. It provides the basis for the organization to adopt asset management principles to achieve greater efficiency and value for money as well as improve the organization’s overall performance. It can also describe the economic benefits of investing in the maintenance of roads. The strategy also sets out how asset management activities are implemented, measured, and continuously improved.
In preparing its asset management strategy, the organization should undertake a thorough review of its key documents and plans and identify key statements and objectives such as transport goals and improvement of road condition. The organization’s review of its asset management framework, including delivery of the asset management strategy itself, performance requirements and work programmes, may also lead to the strategy including actions that improve current asset management practices.
The strategy should cover a number of aspects regarding the planning, delivery, and management of road infrastructure assets and how these are delivered over the short, medium, and long term. Typically, these aspects may include the following (PIARC 2016, PIARC 2017):
The strategy should be prepared by the staff responsible for asset management. It must be supported by the senior leaders in the organization in a clear way and be endorsed by senior decision makers. Ideally, it should be a short standalone document that is concise and available to all those who have an interest in asset management. If the organization has a website, the strategy may be posted on it. The asset management strategy is a high-level document that takes a long-term view and will only need to be updated when there is a change in policy or approach or to reflect improvement actions undertaken following the maturity self-assessment.
The maturity levels for an organization demonstrating asset management principles are shown in Table 1.3.3. Organizations may assess their maturity against this scale.
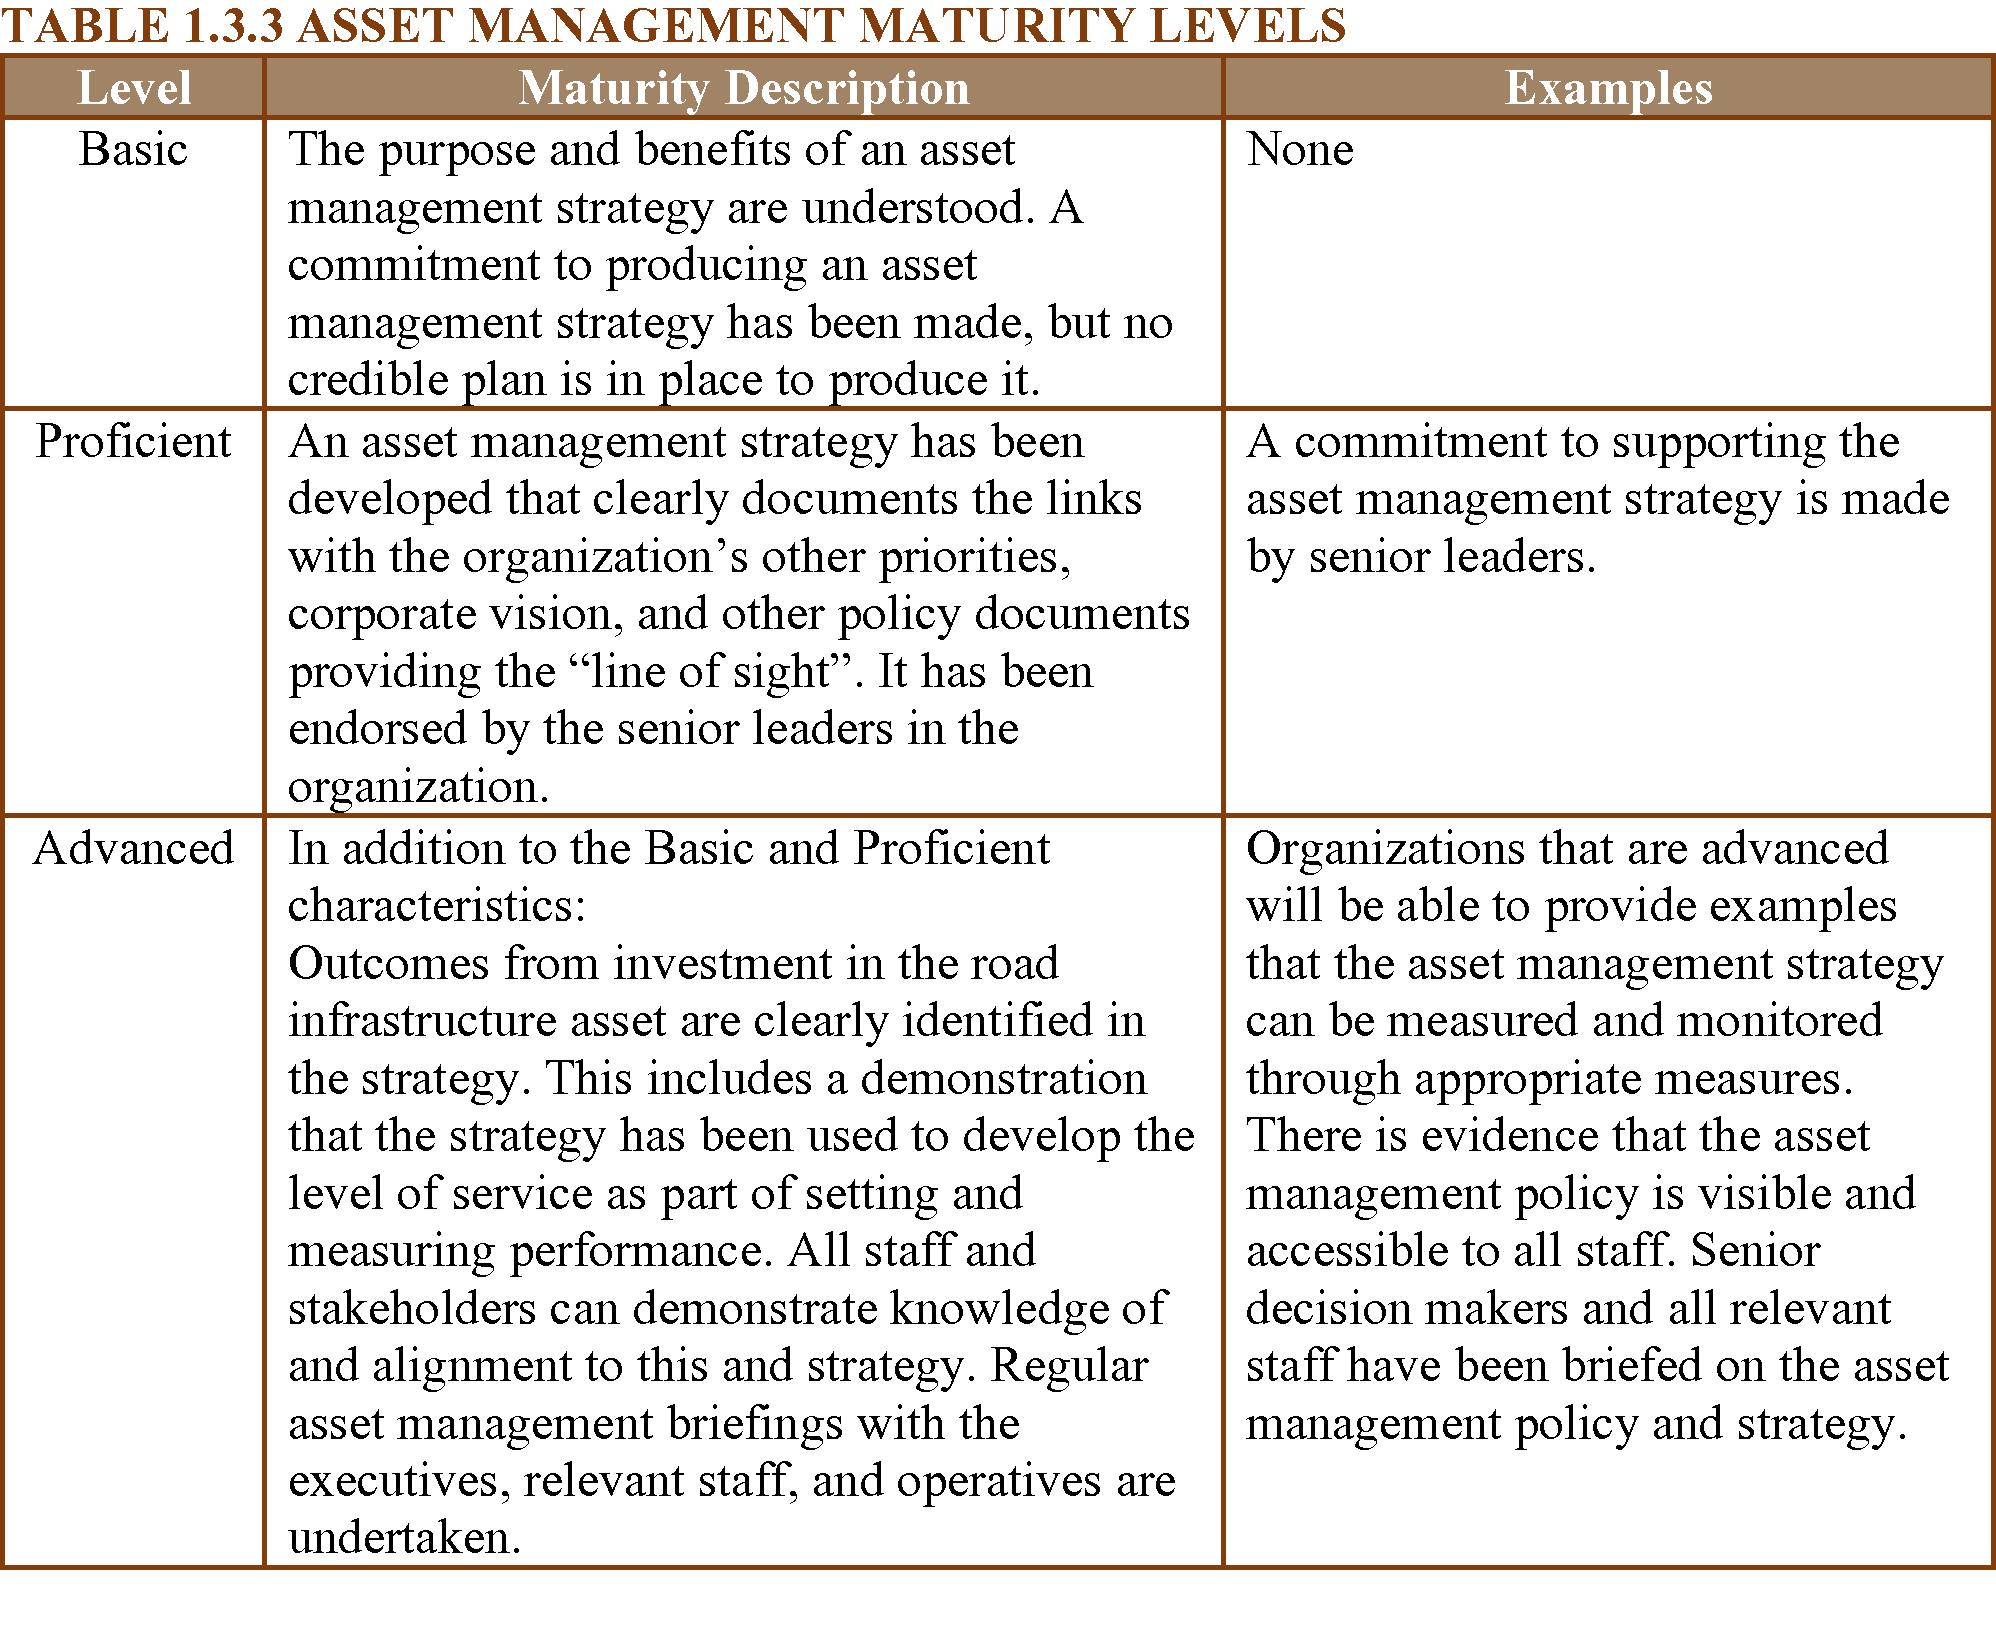
Source: Based in Highways Maintenance Capital Funding: Self-assessment questionnaire for incentive fund
AASHTO, Transportation Asset Management Guide—A Focus on Implementation. January 2011. Last accessed May 2017, http://onlinepubs.trb.org/onlinepubs/nchrp/docs/AASHTO_TAMGFI-1.pdf.
AASHTO, The AASHTO TAM Portal, Last accessed May 2017, http://www.tam-portal.com/.
Department for Transport (DfT), Highways Maintenance Capital Funding, Self-assessment questionnaire for incentive fund, United Kingdom, http://www.trb.org/NCHRP750/ForesightReport750Series.aspx, https://www.gov.uk/government/uploads/system/uploads/attachment_data/file/487481/guidance-and-self-assessment-questionnaire.pdf.
Institute of Public Works Engineering Australasia (IPWEA) The International Infrastructure Management Manual (IIMM), 5th edition, January 2015
International Organization for Standardization (ISO), ISO 55000:2014 Asset management -- Overview, principles and terminology.
Transport Research Board (TRB), NCHRP Report 750: Strategic Issues Facing Transportation, Volume 6: The Effects of Socio-Demographics on Future Travel Demand, Last accessed May 2017.
PIARC 2013. Maintenance methods and strategies, D.2 Road Pavements, PIARC Paris France, ISBN : 978-2-84060-323-8, (https://www.piarc.org/ressources/publications/7/19456,2013R08-EN.pdf).
PIARC 2014. The importance of road maintenance, ISBN : 978-2-84060-349-8, (https://www.piarc.org/ressources/publications/1/22262,2014R02EN.pdf).
PIARC 2016. Assessment of budgetary needs and optimisation of maintenance strategies for multiple assets of road network, Technical Committee 4.1 Management of Road Infrastructure Assets, ISBN : 978-2-84060-378-8, (https://www.piarc.org/ressources/publications/8/24533,2016R04EN.pdf).
PIARC 2017. Management of road assets: Balancing of environmental and engineering aspects in management of road networks, Technical Committee 4.1 Management of Road Infrastructure Assets, ISBN : 978-2-84060-455-6, (https://www.piarc.org/ressources/publications/9/27317,2017R05EN.pdf)
United Kingdom Roads Liaison Group (UKRLG) and Highways Maintenance Efficiency Programme (HMEP). 2013. Highway Infrastructure Asset Management Guidance Document. Department for Transport, London. Last accessed December 28, 2016, http://www.ukroadsliaisongroup.org/en/utilities/document-summary.cfm?docid=5C49F48E-1CE0-477F-933ACBFA169AF8CB.
The following case studies are presented in this chapter:
CASE STUDY 1: Northeast Ohio Areawide Coordinating Agency (NOACA), Cleveland, Ohio, USA
CASE STUDY 2: Asset Management strategy ANAS S.p.A. Italy
JASON J. BITTNER & DAVID K. HEIN, Applied Research Associates, Inc., USA & Canada
In order to ensure that the condition of the roadway is adequate to maintain the usability, comfort, and safety of the travelling public, concession agreements usually include a set of conditions outlining the type and frequency of monitoring and the minimum acceptable levels of pavement performance. The ability to meet these criteria is an important part of the project and is outlined in the operations, maintenance, and rehabilitation plan.
The performance of pavements and their compliance to the project requirements can be measured in a variety of ways. Typical concession agreements focus on the components that most impact the safety and ride comfort level of pavement. The most common conditions identified in the concession agreements for highway projects include:
IRI has become the element of choice to reflect the ride comfort level of a pavement. IRI reflects the serviceability of the pavement, the ride comfort (Patterson), and even the amount of vehicle fuel consumption (Taylor). Typically, a maximum value of IRI is specified for a given section length (i.e. average IRI of 2.5 m/km for each 50 m length of a lane). In addition to a maximum IRI value, it is also becoming common for the concession agreements to also specify a given distribution of IRI values to ensure that the entire network is not maintained at only the minimum level of acceptability. A typical IRI profile cumulative distribution used in can be seen below (NBDOT).
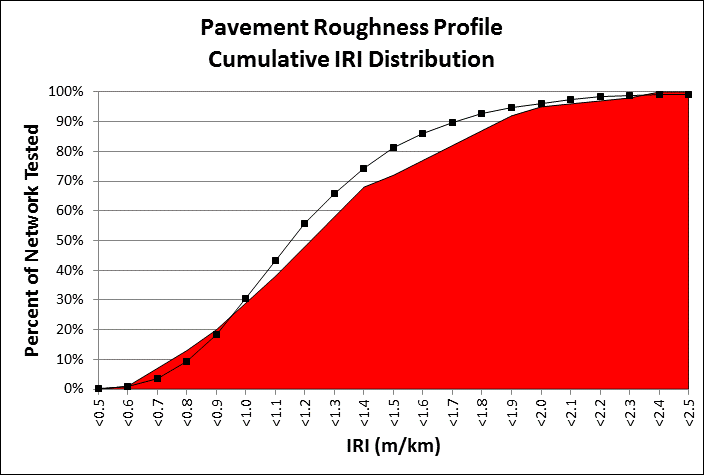
A highway concession may have thousands of 50 m sections. The percent of 50 m sections in each “bin” of IRI range from 0.5 to 2.5 m/km. For example, the figure shows that 50 percent of the sections must have an IRI of less than 1.25 m/km. The curve in the figure shows that about 60 percent of the sections have an IRI of less than 1.25 m/km which is compliant, but the curve moves into the red (non-compliant zone) for number of sections requiring an IRI of less than 0.9 m/km.
A unique component of some of the concession agreements is the use of key performance indicator distributions such as those shown in figure above. These distributions add a new level of complexity to the prediction and budgeting of rehabilitation activities.
Typical PMS software applications allow for a large variety of goals during the forecasting analysis. However, they are not designed to meet the dynamic needs of the distribution analysis. This has proven to be one of the more difficult aspects of performing long term forecasting (ie. 5 years). The most optimal plan for a concessionaire is to plan rehabilitation activities such that in conjunction with the deterioration of non-rehabilitated sections just meets the distribution of IRI in the following year. Traditional pavement performance models for IRI would be developed through an age versus IRI graph. The following figure shows the age versus IRI graph for a typical highway conditions with more than 5,000 pavement management sections each 50 m in length.
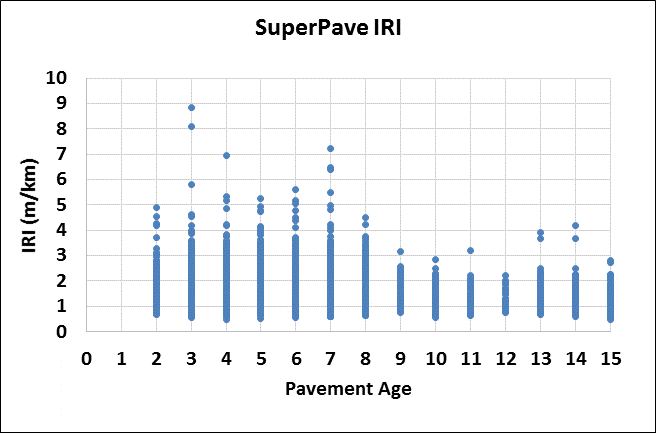
Clearly, it is not possible to fit a traditional performance curve thought this IRI data. Ideally, the overall roadway condition should be hovering just over the distribution line. In order to change the distribution, it is important to understand that improving the condition of an individual section will alter the shape of the distribution of all section with better performance. This means that many minor preventative maintenance activities on the network, although the most cost-effective treatment for the pavement, will not significantly change the distribution. By locating the poor performing sections on the distributions and simulating the results of the repair, an estimate of distribution can be created to assess any other areas of the curve that many need to be adjusted. For areas that affect the performance at around the 50 percent mark of the distribution, localized cost-effective rehabilitation and maintenance alternatives can be used to change the shape and ensure overall compliance.
The nature of the requirements for IRI, is such that pavement sections exhibiting an IRI of greater than 2.5 mm/m are scheduled for rehabilitation each year. The rehabilitation action taken may be very localized to address a bump or settlement and as long as the IRI for the 50 m section is reduced to below 2.5 m/km, the section is in compliance with the project requirements. Predicting when an individual section may exceed the 2.5 mm/m limit is very difficult as “rough” pavement sections may appear very quickly.
In order to develop an indication of the impact of the pavement maintenance and rehabilitation program on the distribution of IRI as compared to the concession IRI requirements, an analysis of the rate of change of IRI was completed. The average rate of change of IRI of 1.6 percent through the past 5 years was selected to represent the typical reduction in smoothness for sections that were not improved by maintenance or rehabilitation action. This average reduction in IRI was then applied to the all of the measured IRI for all 50 m sections that were not improved to determine the expected IRI for each section. For sections that were improved, the IRI values were “reset” and assigned to bins as shown in the following table. The bins are necessary because the result of maintenance to improve IRI will not result in the same IRI for all sections.
Table 1.3.5.1: IRI distribution
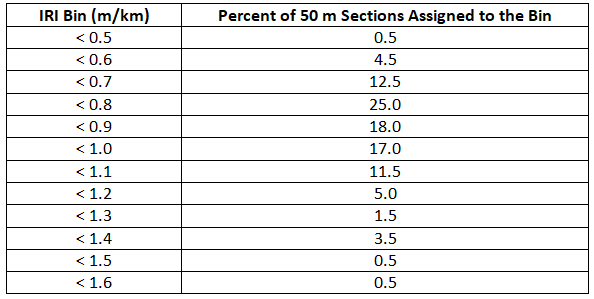
The percent of “improved” sections in each bin represents the expected improvement due to the rehabilitation action taken for pavement sections that exceeded an IRI value of 2.5 mm/m, i.e. 25 percent of sections were improved from an IRI of greater than 2.5 mm/m to less than 0.8 mm/m of roughness. The number of “improved” sections in each bin were then added back to the “deteriorated” IRI dataset based on the average deterioration of 1.6 percent per year to determine the new IRI cumulative distribution curve. The curve for 2018 is shown below.
A similar exercise was then completed for the next 5 years of the concession based on the maintenance and rehabilitation activities planned in the current 5-year plan and average annual rate of deterioration expected.
The cumulative distribution performance modeling described above permits the concessionaire to actively determine the impact of the current 5-year maintenance and rehabilitation plan on the cumulative distribution of IRI and to optimize their annual investments.
Paterson, W.D.O. International Roughness Index: Relationship to Other Measures of Roughness and Riding Quality. In Transportation Research Record 1084, National Research Councel, Washington, D.C., 1987.
Taylor, G.W., and J.D. Patton. Effects of Pavement Structure on Vehicle Fuel Consumption – Phase III Report CSTT-HVC-TR-068. National Research Council of Canada, 2006.
New Brunswick Department of Transportation (NBDOT). OMR – Asset Management Requirements Trans Canada Highway Project Attachment 61. Fredericton, New Brunswick, 1998.
UGO DIBENNARDO, ANAS S.p.A, Italy.
ANAS S.p.A., the main Italian road agency, manages more than 32.000 km of national roads, including hundreds of bridges and tunnels. With the pursuit to optimize technical and economical efforts and build a renovated planning strategy, a Pavement Management System (PMS) has been implemented “in-house”. It is part of a wider project aimed at the proposal of a Road Asset Management (RAM), which suggests a proper allocation of funds based on required maintenance needs. Specifically, the RAM is able to propose optimum technical and financial long-term strategies for planning maintenance activities of all the assets involved in a road network (e.g. pavements, bridges, tunnels).
In the last decade, many PMS have been developed worldwide. However, each system must deal with peculiarities of the involved road network and address specific issues related to local conditions. Consequently, ANAS has decided to develop its own software, a user-friendly system centered on a performance-based approach. Incorporating the control parameters imposed by Italian Ministry of Infrastructure and Transport to monitor pavement conditions, ANAS PMS proposes simple decision-making tools for planning road maintenance, efficiently leading to identification and prioritization of sites needing repairs.
The final objective of the proposed system is to create a simple supporting tool in the decision-making process to properly allocate funds and optimize technical activities. The system will assist technicians and road managers in building up an effective infrastructure network, which must guarantee safety and good service conditions for users, as well as sustainability/benefits in terms of financial resources and technical efforts for the road agency.
Based on the outputs of the proposed system, ANAS sought to identify maintenance and rehabilitation priorities due over time, proposing cost and technical-effective repairing solutions able to comply with budget and performance requirements (i.e. minimizing maintenance activities in terms of frequency and costs and maximizing pavement performance). The system implementation and the consequent planning strategy will guarantee high quality standard infrastructures together with relevant money savings due to direct and indirect benefits for road users and road managers.
Each year ANAS, through its experimental research center, monitors its road network to detect the main parameters for verifying pavement condition ((e.g. CAT, IRI, HS) asked by Italian Ministry of Infrastructure and Transport. This extensive monitoring campaign makes available a huge amount of data that can be exploited for the development of a reliable PMS without needing additional efforts in terms of equipment and/or complex features (i.e. no need of additional costs).
In this sense, the first step of the PMS construction process (still in progress) has been the development of an elaboration method that includes the above-mentioned pavement performance parameters regularly detected by ANAS for the determination of pavement rating. Specifically, a simple methodology was proposed to elaborate all the historical data recorded through in site investigation equipment and visual inspections. The analysis provides two main performance indicators, which describe functional and structural pavement conditions:
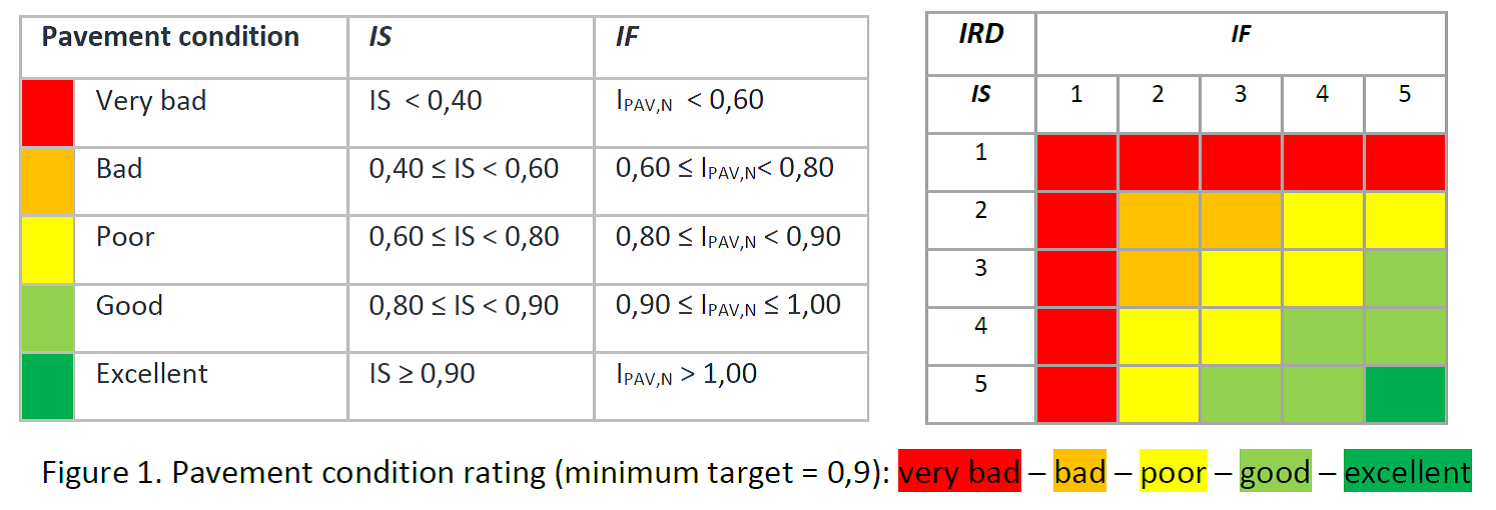
Based upon IF and IS rating combination (Figure 1.3.5.3), the current road pavement condition level is identified as summarized by the parameter IRD (Index of Distress Relevance).
Below, expressions and relationships between the above-described parameters are shown:
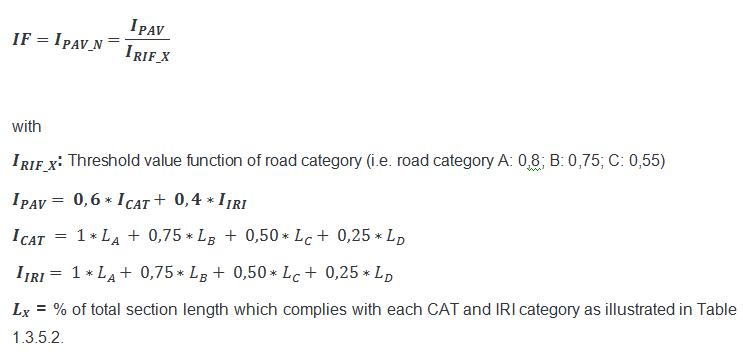
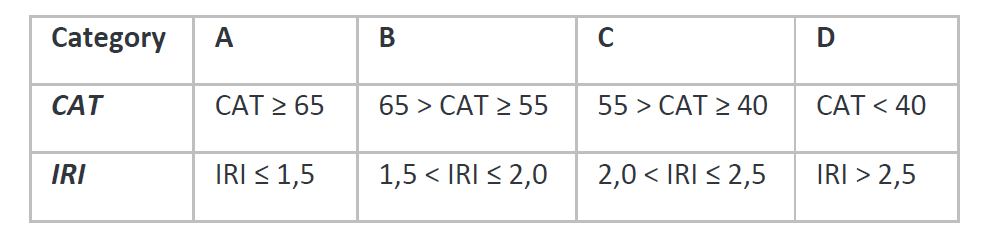
Table 1.3.5.2: CAT and IRI category
With the aim of verifying the capability of the proposed road data elaboration method to provide a feasible and reliable picture of the actual maintenance need of the road network, a case study of its applicability is presented in the next paragraph.
Two 5 km sections of double carriageway roads with same traffic and structure category (i.e. road category B – subjected to heavy traffic – Figure 1.3.5.3) were analyzed in terms of IRD. The sections were selected taking into account maintenance needs previously identified based on the empirical experience of road agency technicians. One section was selected among those identified in “poor conditions” (i.e. requiring repairs – Figure 1.3.5.4). The other one, recently rebuilt, was chosen among those in “good conditions” which do not require priority in rehabilitation (Figure 1.3.5.5). For each section, CAT and IRI data were analyzed as previously described and visual inspections reports were elaborated to determine IF, IS and IRD as summarized below. For the first section, data recorded in two different periods were considered with the aim of verifying the ability of the system to identify the distress evolution over time.
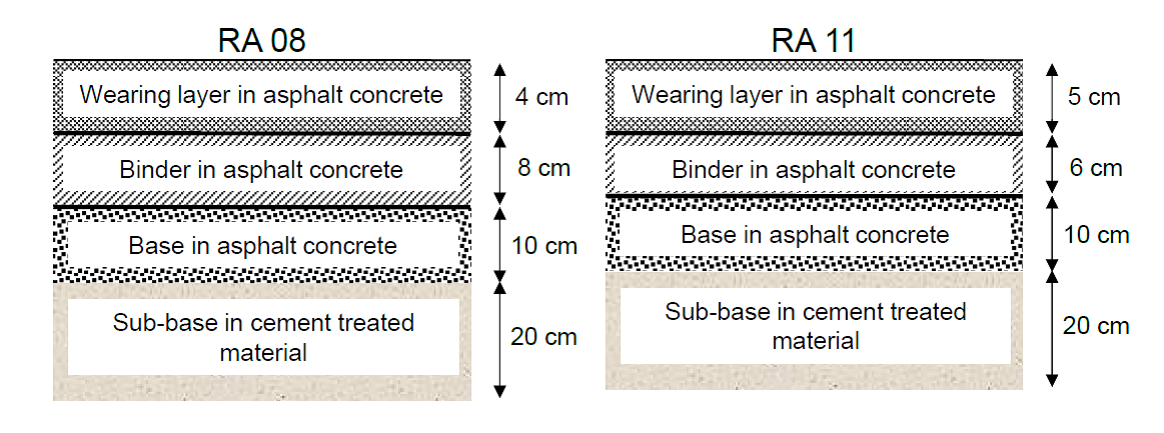
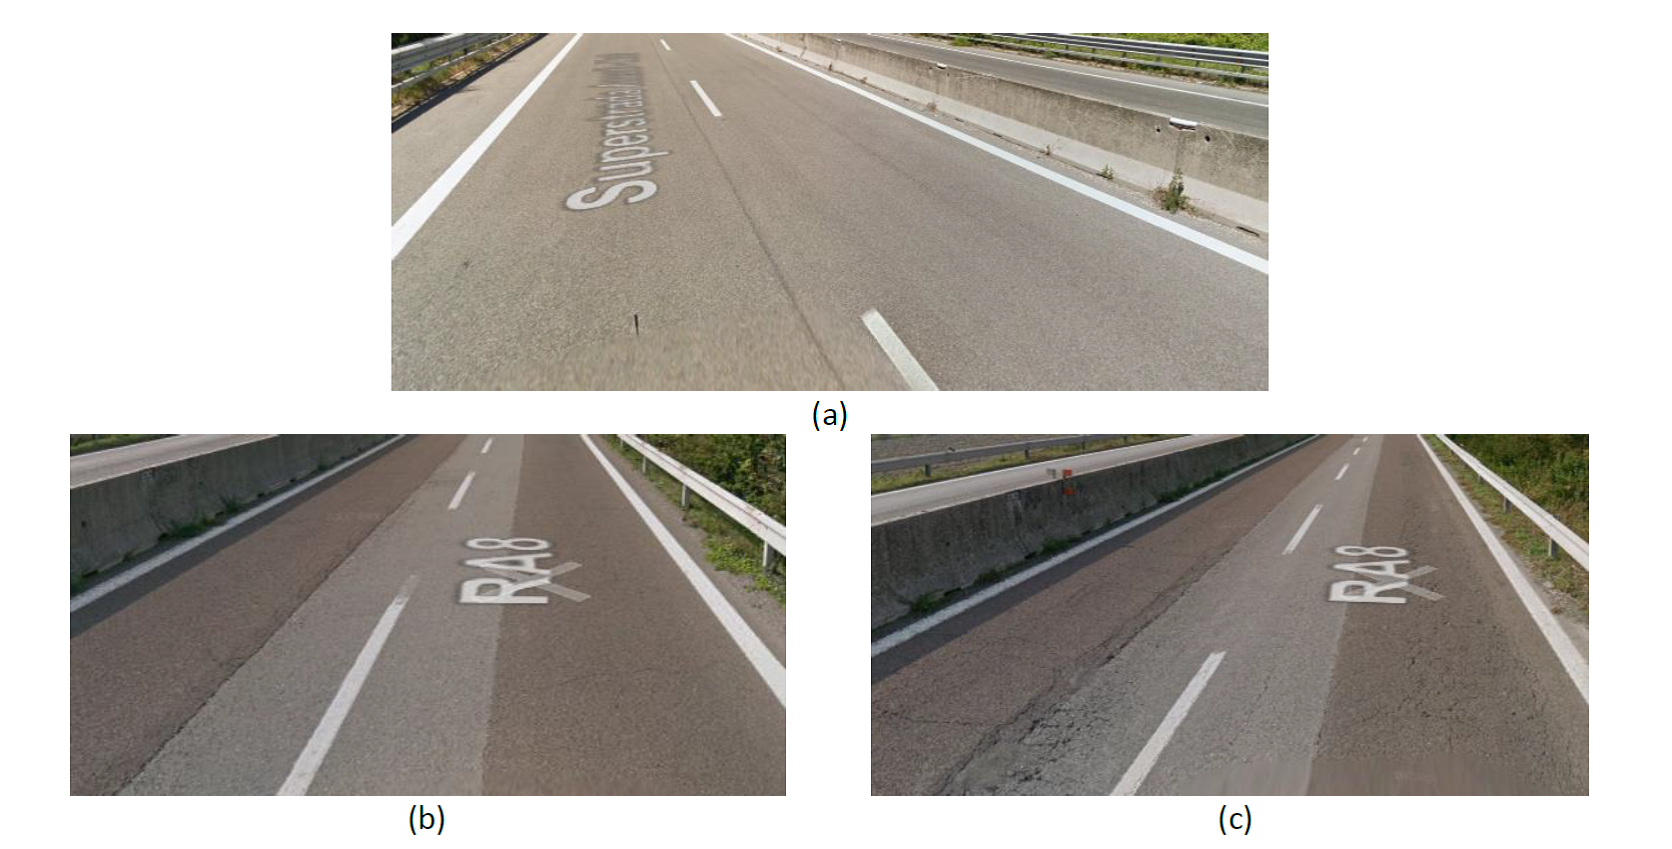
Figure 1.3.5.5: a) RA 11 (2017); b) RA 08 (2015); c) RA 11 (2017)
Table 1.3.5.3: IRI and CAT data elaboration
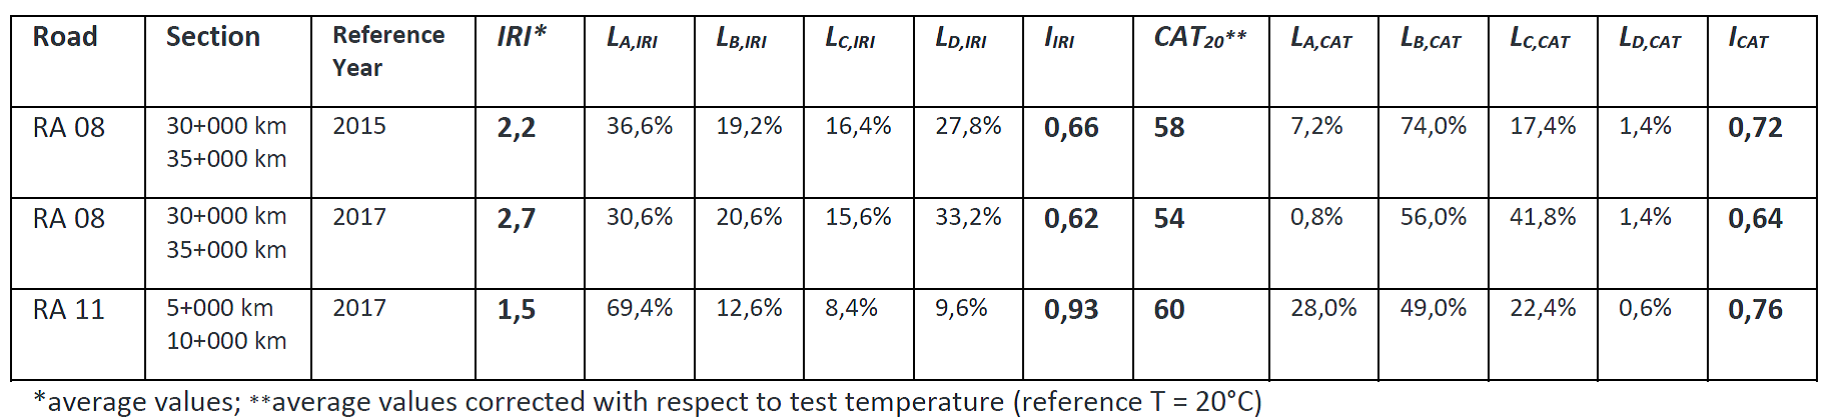
Table 1.3.5.4: Pavement condition rating
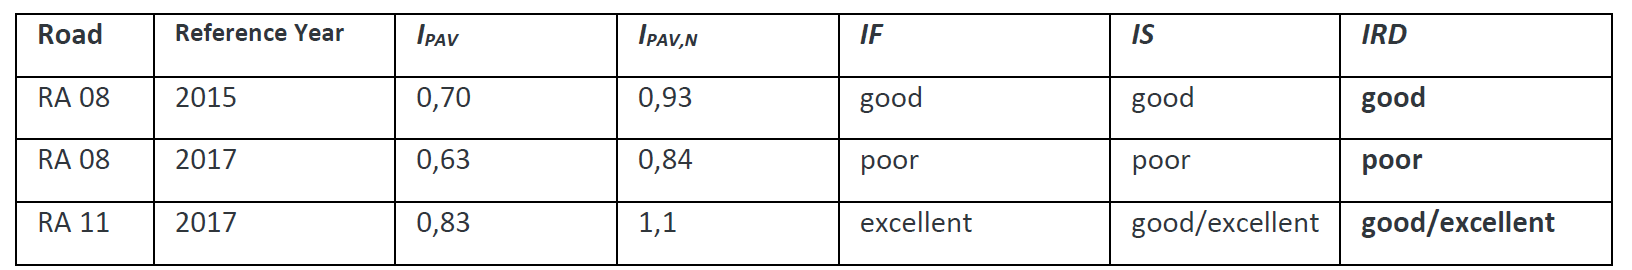
Results shown in Table 1.3.5.3 and 1.3.5.4 validate the reliability of the performance-based elaboration method proposed by ANAS to identify pavement condition. IRD properly ranks roads based on the distress level: a better IRD rate characterizes the road section recently restored (RA 11). At the same time, the road section requiring maintenance (RA 08) shows ICAT and IIRI values that worsen over time with an overall reduction in the IRD rate, as expected due to the higher deterioration recorded with the most recent road inspection. Based on these findings, in order to restore acceptable pavement conditions, ANAS planned specific maintenance activities on the RA 08 road (conducted in 2017 and 2018).
Thus, with few efforts in terms of data acquisition and mathematical calculations, the IRD parameter is able to easily provide a comprehensive picture of the current pavement condition of the whole road network and demonstrates the sensibility to adjust according to distress evolution.
The next step for ANAS PMS development is the implementation of provisional evolution models based on climate and traffic conditions as well as time aging effects. By applying evolution laws to the IRD parameter, the IDF (Index of Future Deterioration) will be identified, so capturing in advanced maintenance needs and priorities of the road network and their evolution. In this sense, for the construction of reliable evolution laws, the wide historical database recorded over time by ANAS research center constitutes an irreplaceable resource. The combination of IDF information with visual inspection data, that provide useful hints about deterioration causes, assists technicians in the identification of the most feasible and effective technical solutions. To this regard, depending on distress type and extension as well as IFD values, a catalogue of standardized maintenance activities will support technical decisions. Finally, based on technical needs and budget availability, ANAS can plan a careful long-term action strategy, which allows significant cost savings and technical efficiency.
ANAS PMS demonstrates optimum capability in identifying gaps and priority maintenance needs, allowing for better allocation of resources as well as technical efficiency. With very limited efforts in terms of data finding and calculation, the proposed system can easily provide a reliable picture of the current pavement condition of the road network, demonstrating the sensibility to adjust according to distress evolution.
ASPHALTICA World Seminar. 2018. “Pavement Management System - Il progetto di ANAS”, presented by Ugo Dibennardo and Tullio Caraffa. Rome, Italy. 26 October 2018.