
The following case studies are presented in this chapter:
CASE STUDY 1: GEPUR guide a single shared methodology for managing an inter-urban or an urban network
CASE STUDY 2: Footway evaluation developed by BRRC
HUGUES ODEON, CEREMA, France
In France, the IQRN method has been used to manage the national road network for about 25 years. But this method is not fit for local road networks, and there is no other simplified method available. The main purpose of the GEPUR project was to provide a single and shared methodology for managing local road networks of Eastern France (ten departments). This methodology was written by officers who are in charge of the daily management of inter-urban and urban road network; the group was led by a representative of the Cerema. The final guide is composed of two parts, the first one for inter-urban networks, and the second one for urban roads. The frame of these two parts of the guide is similar, but the urban roads have specificities that influence their behavior and lifecycle, making it necessary to take them into account.
The aim of the GEPUR project was on one hand to provide a guide available for road network managers and their contracting authorities, and on the other hand to create a group of road network managers who will be able to share their know-how.
The GEPUR project allowed road network managers to build their own methodology together, taking advantage of the experience of each of them.
The GEPUR guide provides an open methodology. Its implementation to a specify network can be different according to the contracting authorities policy, the length of the network and the financial capabilities of the department or the city.
Regarding the asset management plan, the road network manager can opt for different strategies. Usually, the network is divided in three or four classes, and the chosen strategy varies according to the classes.
First, he has to choose between different priorities:
Then, he has to define different technics for maintenance. Each of them has benefits and limits which must be taken into account. For example, the routine maintenance can only maintain the quality level of the road for a few years, a surface dressing can restore the surface characteristics of the pavement (impermeability, skid resistance) and an asphalt concrete can moreover contribute to strengthen the structure.
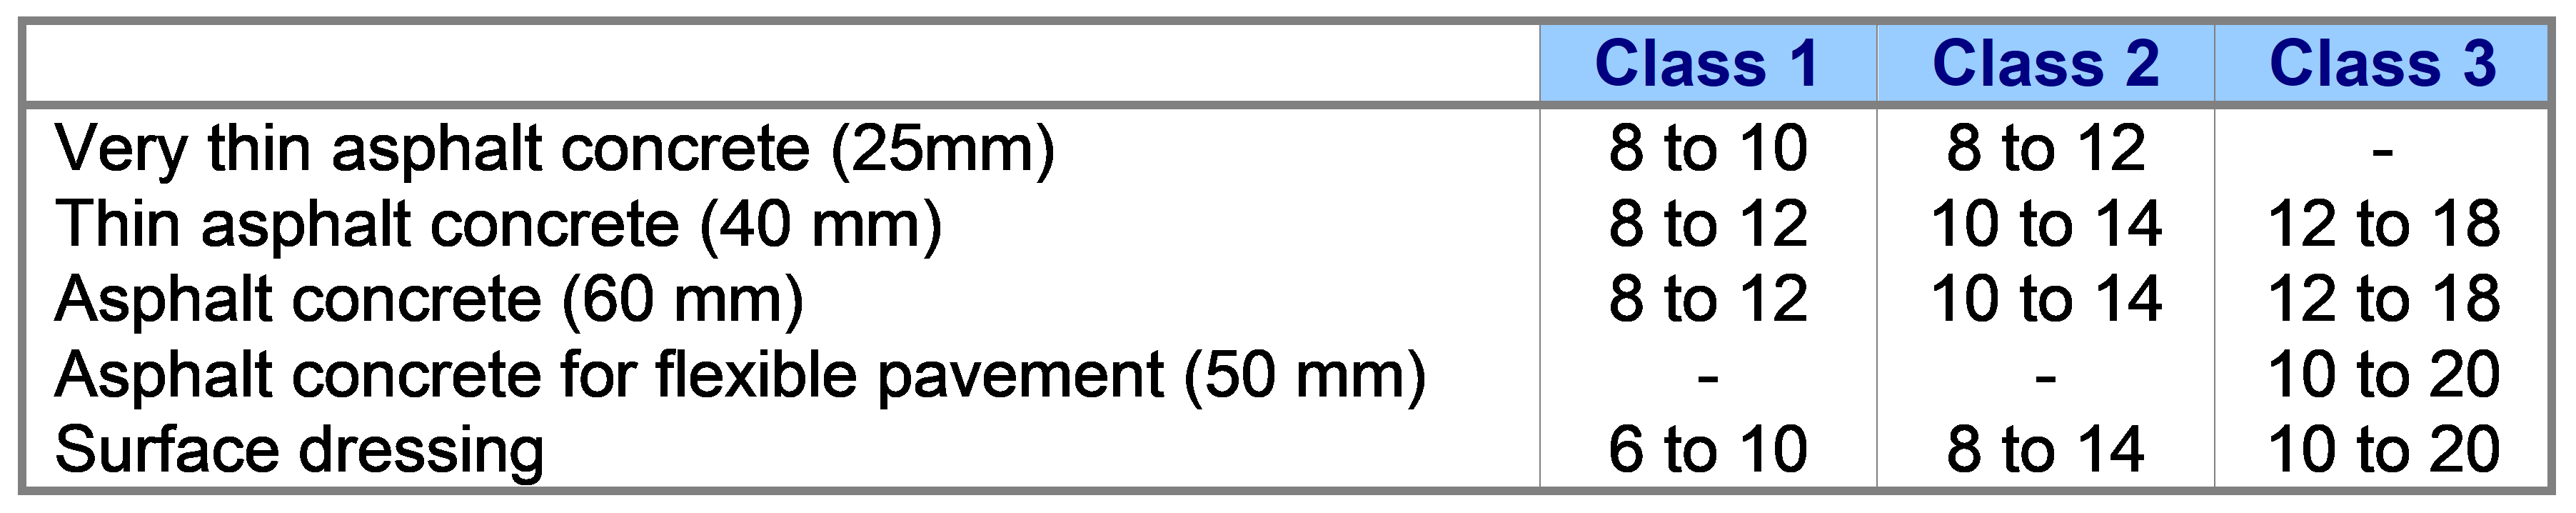
It is then possible to define which technics will be used on each class of the network, what the maintenance frequency is for each of them, and what average percentage of surface will be treated with each technic. For example (Table 1.4.7.1), on the class 1 network, it could be possible to adopt 15% of very thin asphalt concrete, 15% of thin asphalt concrete, 20% of asphalt concrete, and 50% of surface dressing. On the class 3, these percentages can respectively be 0%, 25%, 0% and 60%, with 15% of specific asphalt concrete for flexible pavement. The durability of each technic also depends on the traffic of the road, and consequently of the class (Table 1.4.7.2).
Table 1.4.7.1: Average percentage of each technics per class (%)
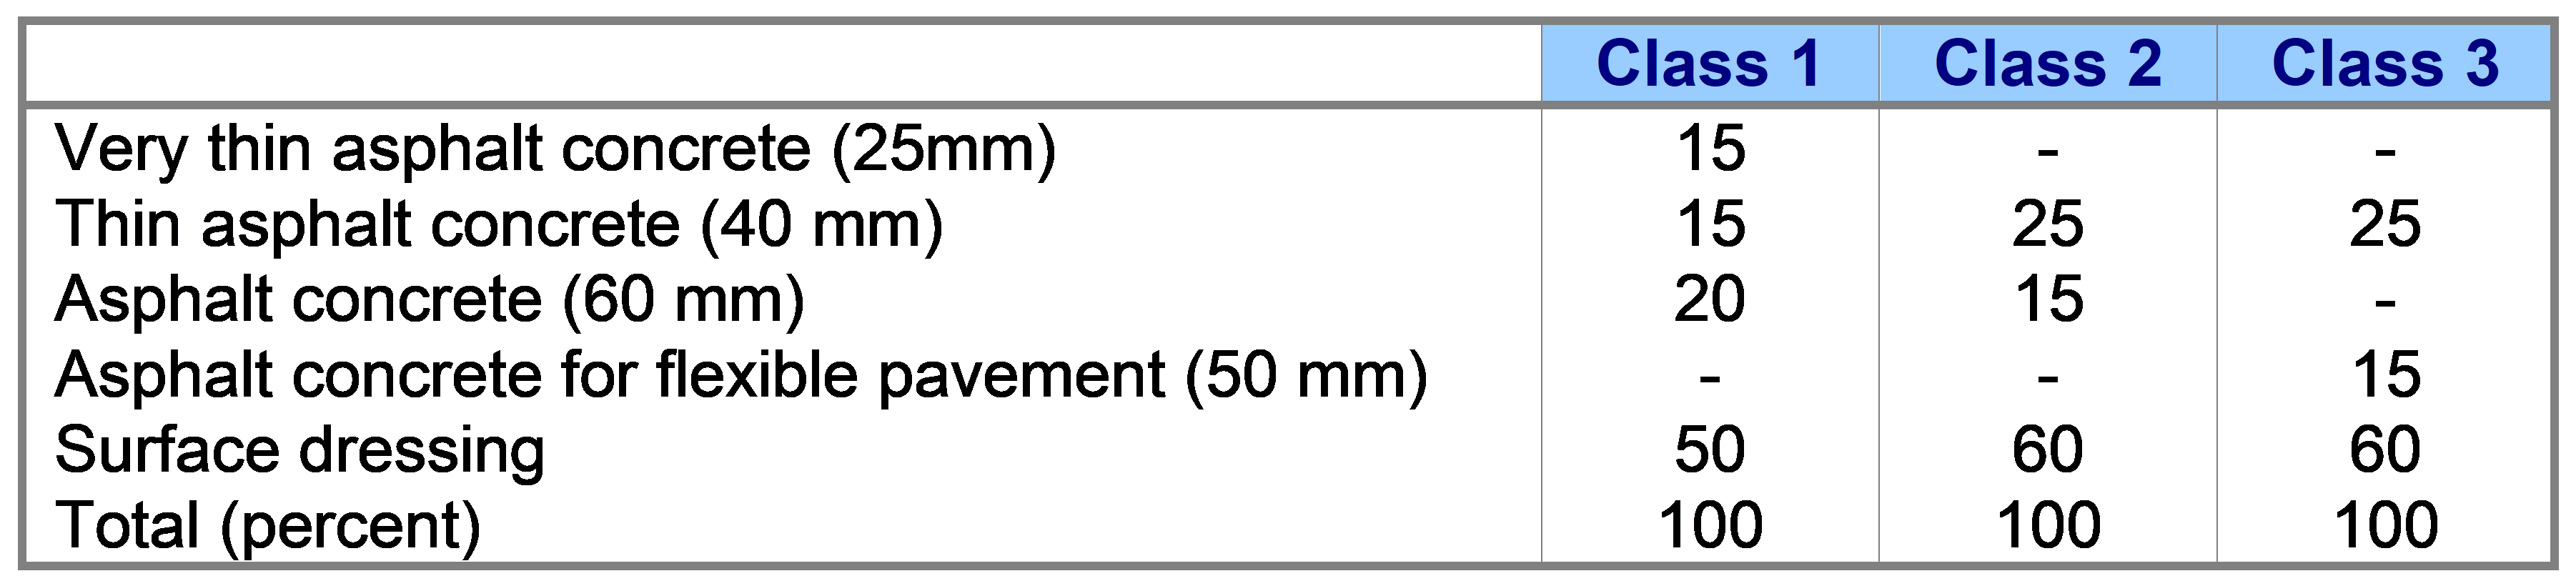
Table 1.4.7.2: Average durability of the different maintenance technics (years)
Finally, the road network manager defines an asset management plan for each class of the network (Figure 1.4.7.1), describing the type of maintenance to be applied and its average durability for a long cycle life (30 years for example). It is then possible to evaluate the global cost of this asset management plan over 30 years, and to adjust it to the financial capabilities of the department.
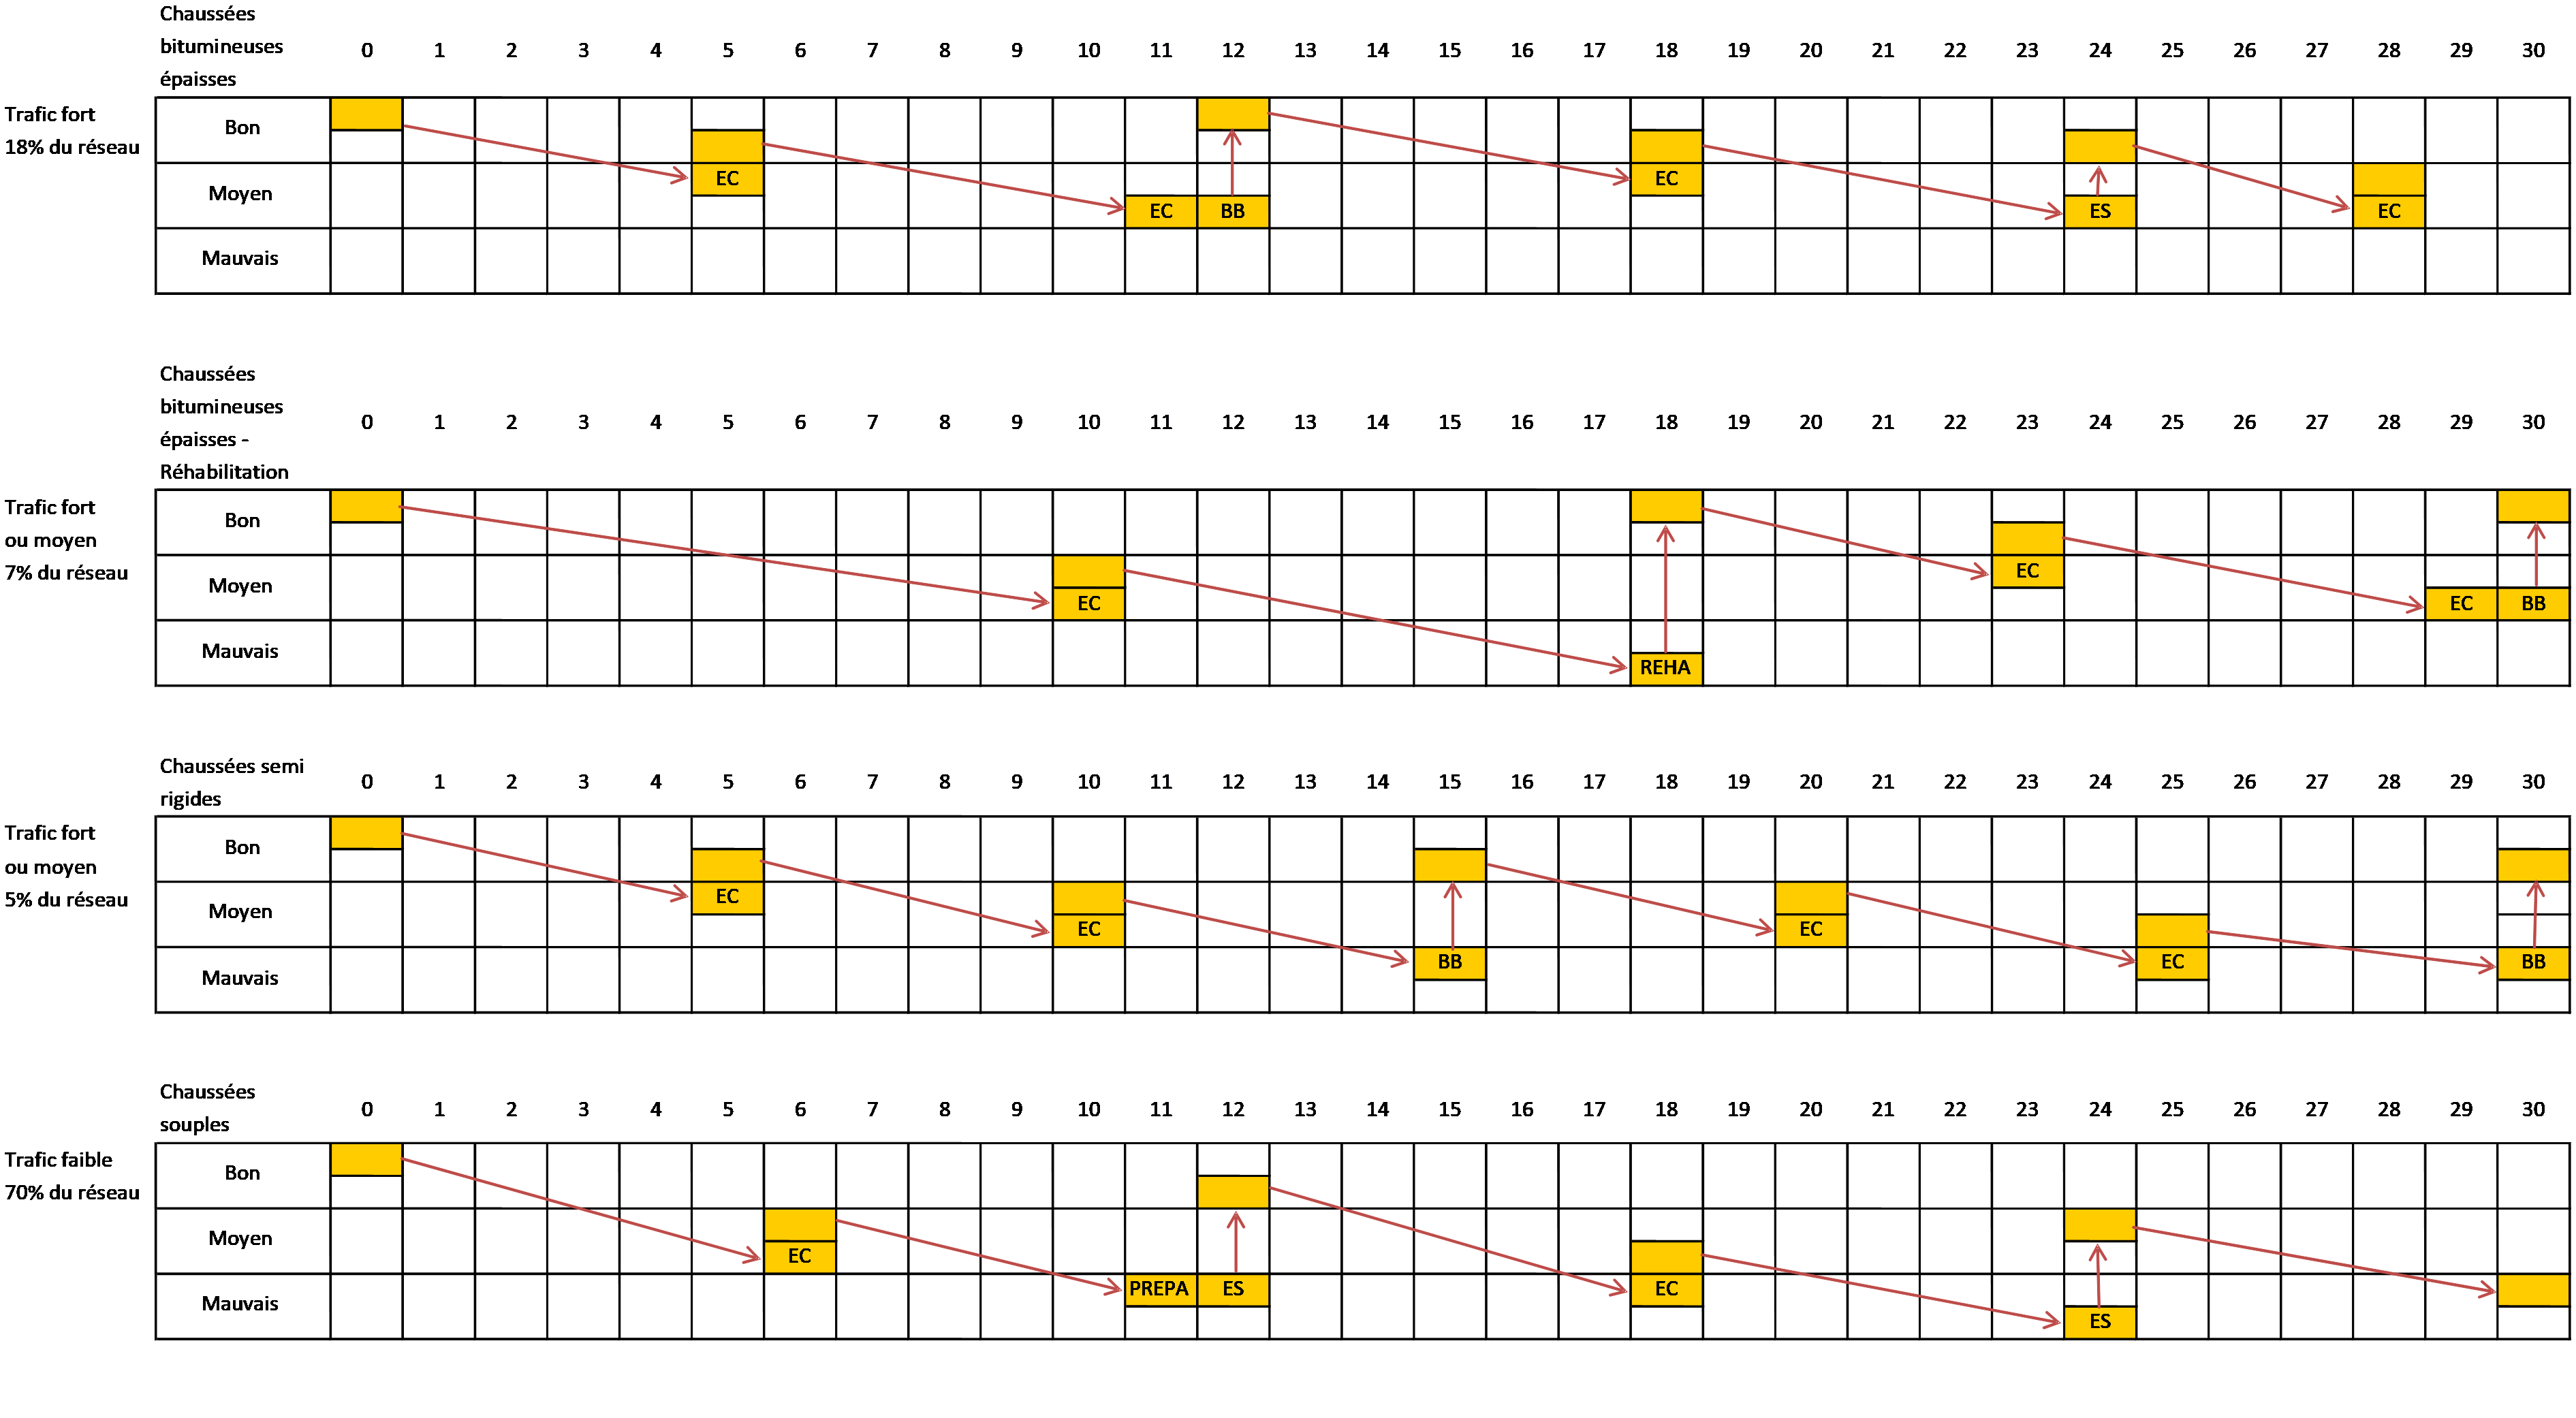
Figure 1.4.7.1: Asset management plan depending on the type of structure (flexible, bituminous, rigid) and traffic
The GEPUR guide provides a tool to the road network managers and their contracting authorities, which allows them to define their own asset management plan, according to their quality policy and the financial capabilities. This guide is in two parts, the first one for inter-urban road network, and the second one for the urban road network.
Group. 2016. GEPUR Part 1 : inter-urban network. IDRRIM. Paris (Fr), June 2016. https://www.idrrim.com/publications/4484.htm
Group. 2018. GEPUR Part 2 : urban network. IDRRIM. Paris (Fr), to be published.
Odéon H., Jung V., Schang J.P. (2015) : GEPUR, une méthode de gestion d’un réseau routier par et pour les collectivités locales, AIPCR 2015, Séoul (Corée du Sud), nov.
Odéon H., Schang J.-P., Jung V. (2017) : GEPUR : a method for managing a road network by and for local authorities, JTTE, USA, Marc-Apr, pp. 104-115.
TIM MASSART, BRRC, Belgium
Walking and cycling are green transport modes which should be given more attention in future. The quality of footways is not always very good. Maintenance planning and budgeting are mostly based on ad hoc repairs.
The problem is the lack of a complete evaluation method. We have developed an evaluation method for footways.
Our approach is based on a network analysis with a wheelchair, which is the most “sensitive” type of footway user. This wheelchair is equipped with sensors and a skid resistance measuring device. Three parameters (comfort/longitudinal unevenness in the direction of travel, gradient in the direction of travel, and crossfall) can be measured in one run, and a skid resistance measurement is made in each section of the network.
We would like to present this measuring equipment with results maintained untill now. Furthermore we would like to promote this approach and show the good relation between the objective measuring device and the subjective rating of the testpanel.
Efficient inventorying and inspection of footways.
The objective of this tool is to measure in 1 pass the comfort, crossfall and longitudinal slope of a footway in an objective way.
By measuring the 3 characteristics, mentioned above, in an objective way, we eliminate subjective complaints from citizens.
At the national and international level, there is currently no objective tool to determine this quality of pedestrian pavements continuously, quickly and cost-effectively. The concept is all too often approached subjectively, on the basis of the feeling that we get as a traffic participant in a public space. That is why the Belgian Road Research Center decided in 2015 to develop a measuring instrument to assess pavements on three criteria that are fundamental for pedestrians: flatness (comfort), skid resistance (resistance to slipping) and slope (transverse and longitudinal).
Relevant technical parameters to be collected for footway evaluation are the following:
Footway width
Different users need different footway widths. In this concept we use a wheelchair. We assume that people with impaired mobility are the most “sensitive” users of a footway. If people with a wheelchair, baby car or other vehicle can travel in an acceptable way, the criterion is met.
Longitudinal unevenness / comfort
The feeling of comfort on a footway varies widely with the type of user. In the concept proposed in this article, we will measure comfort with a wheelchair equipped with an accelerometer. This evaluation is objective and stringent, because a wheelchair user suffers the most from lack of comfort on a footway.
Crossfall / gradient
Crossfall should normally be lower than 2 %. This parameter will be measured continuously in the concept proposed below.
Basic concept (V0)
After analysing the available tools and the way inspections are made in other countries, we found that no existing device can measure all the relevant characteristics at an affordable price. That is why we are suggesting the concept described below. (This measurement method remains to be refined and the measuring equipment still needs to be developed.)
The basic component of the method is a wheelchair. We propose to convert it into a measuring vehicle. The chassis of the wheelchair as well as the wheels and the load (weight in the wheelchair) will be determined experimentally, as a first step. It seems interesting to choose the chassis and wheels so as to minimize suspension and damping, with a view to obtaining a highly sensitive measuring device.
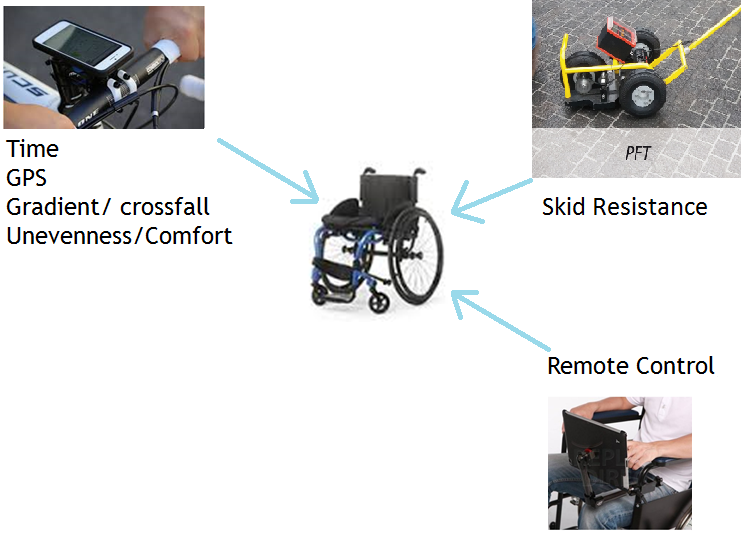
Figure 1.4.7.2: Basic concept (Source: BRRC)
A smartphone is fixed onto the chassis and the following parameters can be measured:
In 2016, a first prototype (V0) was developed by the CRR. This was materialized by a wheelchair on which smartphones containing a GPS and an accelerometer had been fixed (equipment integrated by default in all smartphones). This equipment provided figures concerning the comfort of the coating (rating out of 10). This comfort is evaluated via the accelerometer which will measure the vertical accelerations generated by the surface of the coating on the wheelchair and therefore in fine on the user. In order to measure also the adhesion of the coating, a complementary tool available to the BRRC has been used: the Portable Friction Tester (PFT - more information available on www.brrc.be/fr/article/f1301_06 and www.vti.se/en/Publications/Publication/road-marking-friction_669533).
At the end of 2016, surveys were carried out with this prototype and the PFT tool on eleven "test" sites located in the city center of Brussels, each with a different coating: two asphalt, two concrete and seven natural stone .
In April 2017 and in collaboration with Brussels Mobility, the adherence and flatness of these eleven sites were then evaluated by different users during a morning organized by the CRR. The objective of this approach was to verify if the results obtained by the measuring equipment, reflected the feeling of pedestrians. In total, twenty-eight participants took part in this field exercise: eighteen valid pedestrians and ten people with reduced mobility (people in wheelchairs, people walking with difficulty, people with visual impairments). A test sheet was completed by each participant and for each site.
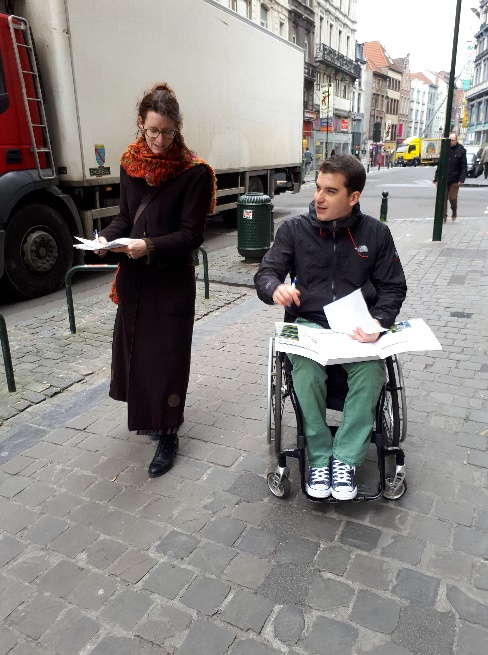
Figure 1.4.7.3: Evaluation of the footway by user (Source: BRRC)
At the end of the analysis and as illustrated in the graph of Figure 1.4.7.4, a classification of the sites according to the comfort of the coating perceived by the users was carried out. The classification obtained from the subjective data collected by the twenty-eight users (light blue on the graph), compared to that obtained with the encrypted data collected by the prototype (dark blue), shows that a correlation exists on this notion of comfort.
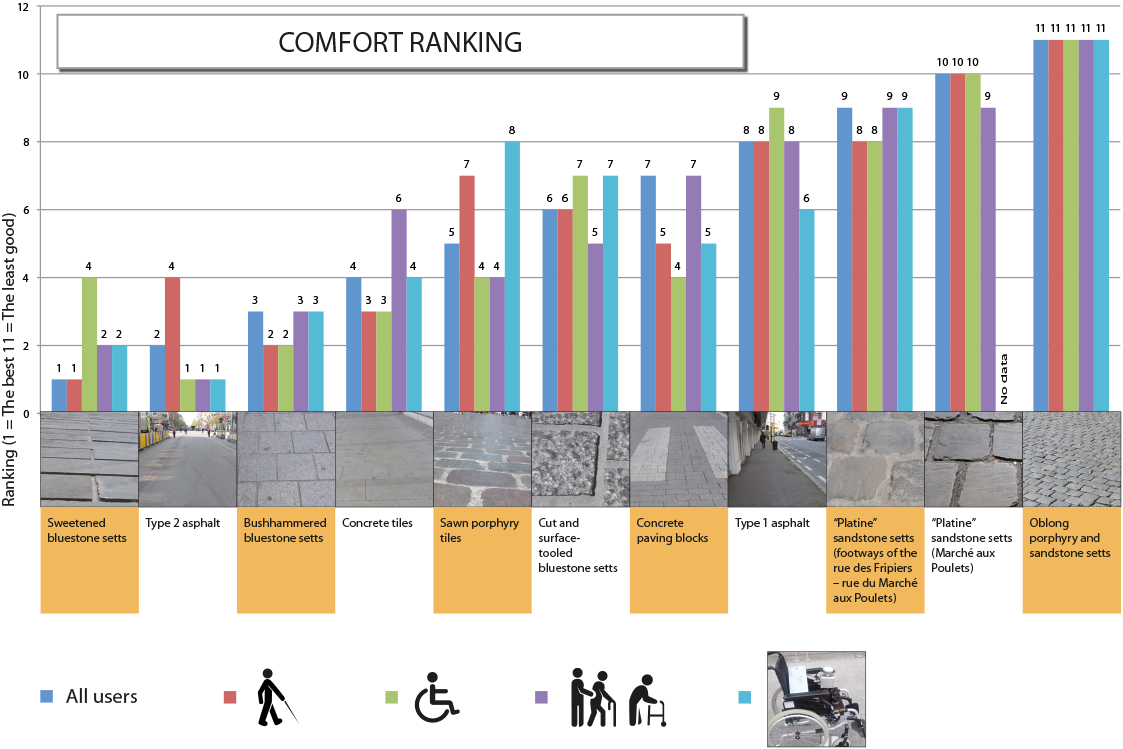
Figure 1.4.7.4: Comfort ranking (Source: BRRC)
Encouraged by this encouraging observation, the BRRC decided during the summer of 2017 to develop a second prototype (V1) with several objectives:
Presented in preview on the stand of the BRRC at the Belgian Road Congress in Brussels at the beginning of October 2017, this equipment allows to measure continuously and in a "geolocated" way the comfort and the longitudinal and transversal slopes of the sidewalks and other pedestrian spaces. The measurement of adhesion can currently not be performed by this equipment and always requires the use of additional equipment (PFT tool for continuous measurement (tests in progress), SRT pendulum (Skid Resistance Tester for point measurement). This second prototype and the sensors that compose it are shown in Figure 1.4.7.5.
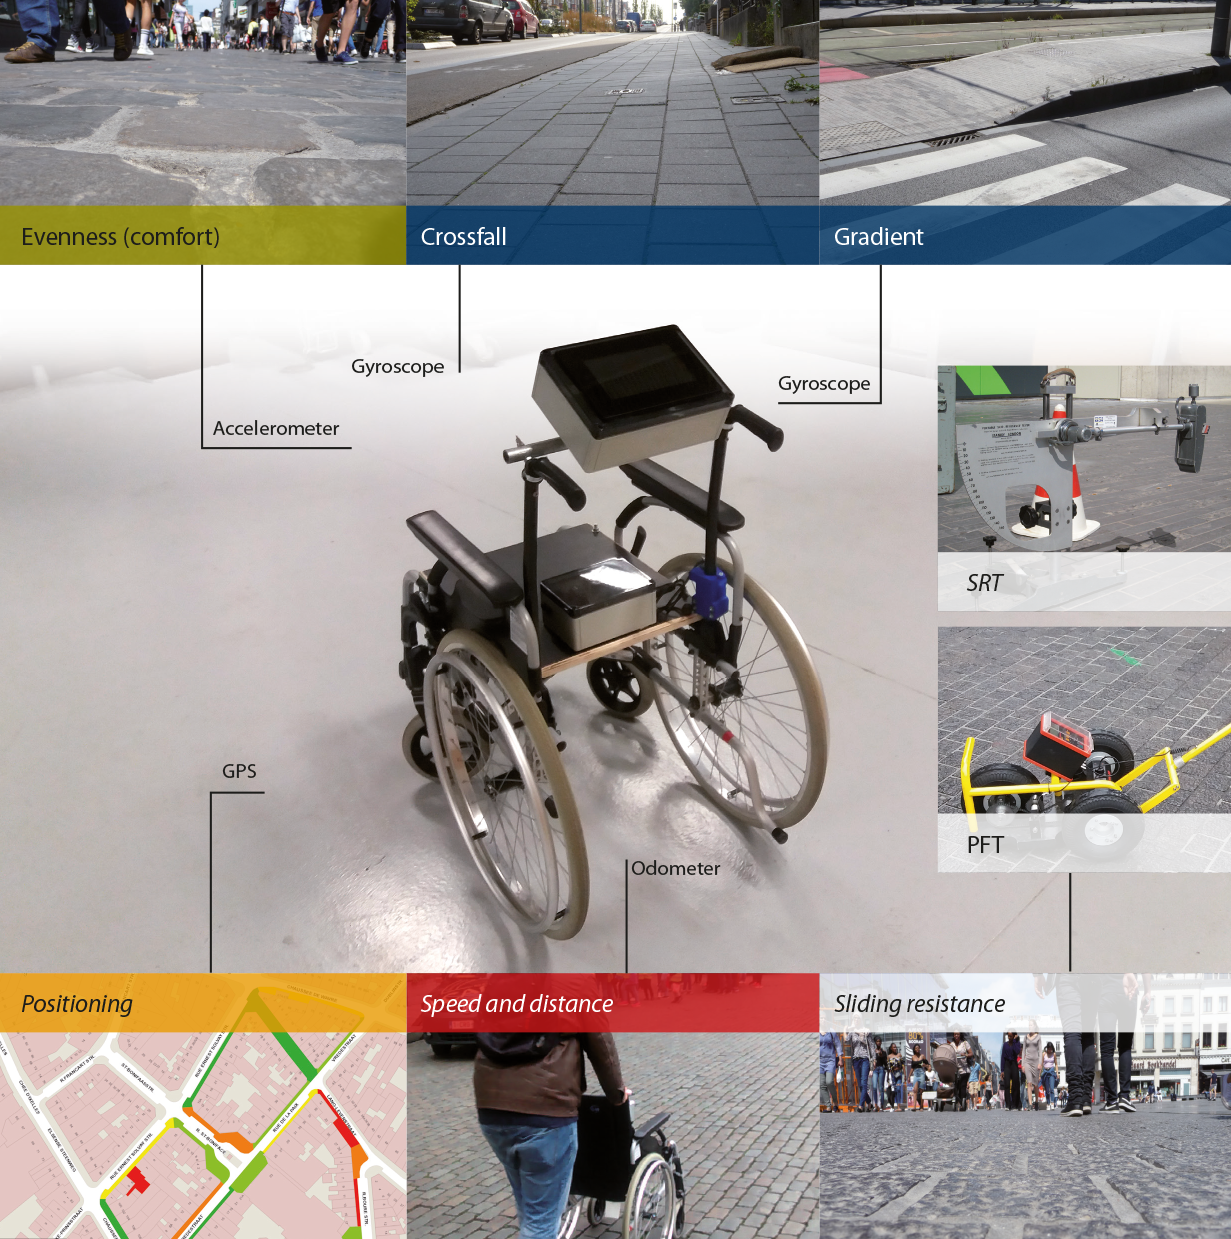
Figure 1.4.7.5: Second prototype (Source: BRRC)
In summer 2018 we have surveyed a complete city center in Belgium with the measurement equipment. In the map beneath, you can find the results on the comfort of the footways for the complete city center.
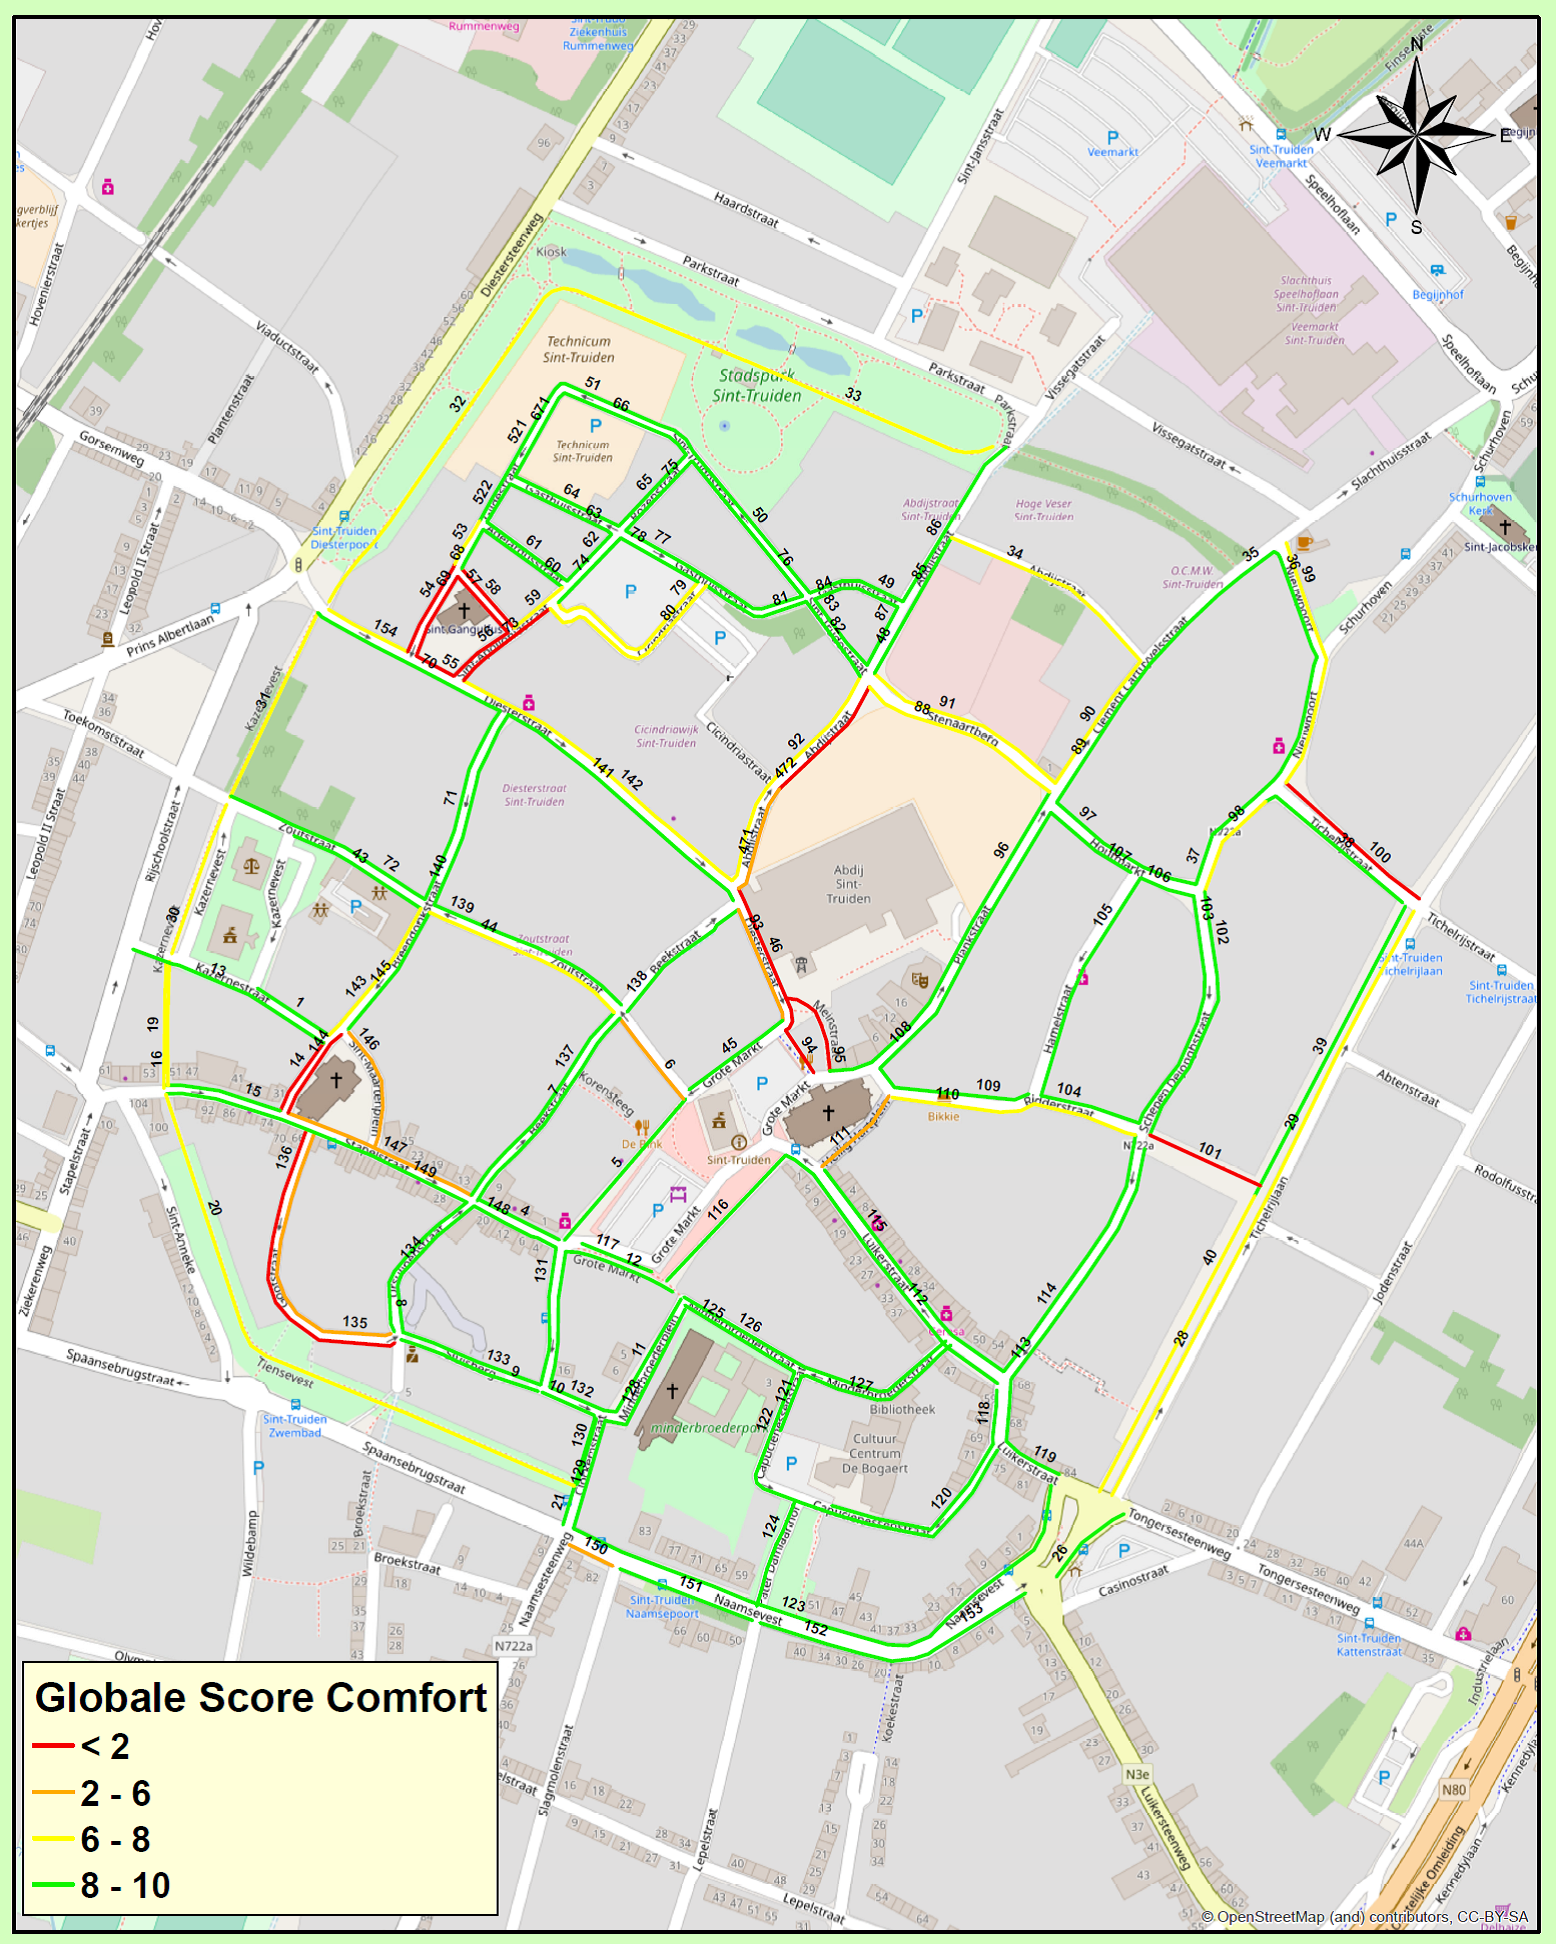
Figure 1.4.7.6: Comfort assessment for a whole network (Source: BRRC)
This functional equipment is now integrated in the family of roadside inspection equipment available at the BRRC. It can be used to respond to external technical assistance specifically oriented to the quality of use of pedestrian coatings.
The road administrator will be able to categorize different pedestrian coatings based on comfort (wheelcair equipment) and adhesion measurements (PFT). The following figure shows a decision grid that can be used to trigger an intervention. In the green area (VG Very Good) we have a pedestrian coating with very good scores on comfort and adhesion. In the red zones we have at least one problem (adhesion or comfort). Based on this we can choose a substantiated measure.
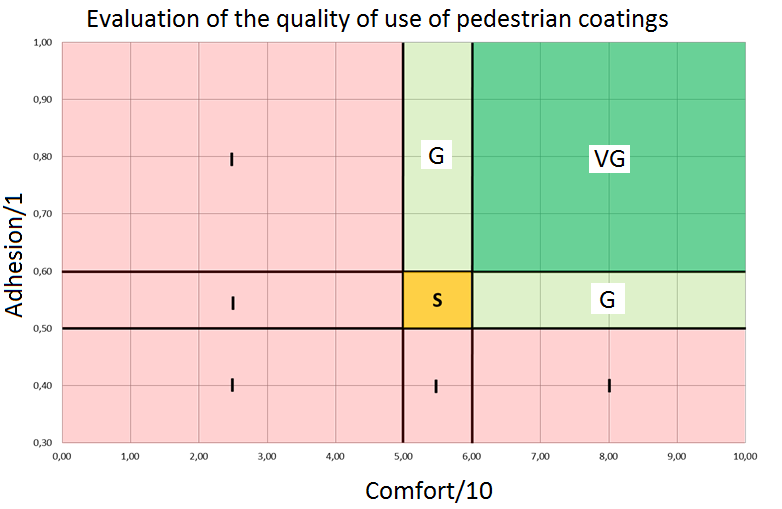
Figure 1.4.7.7: Evaluation grid for footway coatings (Source: BRRC)
The concept presented above has been tested in actual practice. We will explore different strategies to get this equipment on the market.
Walking and cycling are green transport modes which will get more attention in future. The quality of footways is not always very good. In most cities, road managers have difficulties in estimating the quality level of their footway network. Maintenance planning and budgeting are mostly based on ad hoc repairs. With this complete evaluation method administrators will be able to manage this asset in a more efficient way and with a well determined approach.
After this inspection, the administrator will have a good overview of the quality of his footway network. He will easily find those footways who need a maintenance. On the other hand, experience will be gained for different types of pavements for footways. With this experience, the administrator will be able to decide wich type of pavement is suitable for which footway.
Tim Massart, 2018. The Belgian Road Research Center strives to develop a Tool that measures the usability of pedestrian surfacing/ Routes/Roads n°377 – 2nd quarter 2018. Location.